Intermediate-Age Stellar Populations in Classical QSO Host Galaxies
Abstract
Although mergers and starbursts are often invoked in the discussion of QSO activity in the context of galaxy evolution, several studies have questioned their importance or even their presence in QSO host galaxies. Accordingly, we are conducting a study of QSO host galaxies previously classified as passively evolving elliptical galaxies. We present deep Keck LRIS spectroscopy of a sample of 15 hosts and model their stellar absorption spectra using stellar synthesis models. The high S/N of our spectra allow us to break various degeneracies that arise from different combinations of models, varying metallicities, and contamination from QSO light. We find that none of the host spectra can be modeled by purely old stellar populations and that the majority of the hosts (14/15) have a substantial contribution from intermediate-age populations with ages ranging from 0.7 to 2.4 Gyr. An average host spectrum is strikingly well fit by a combination of an old population and a 2.1 (+0.5, 0.7) Gyr population. The morphologies of the host galaxies suggest that these aging starbursts were induced during the early stages of the mergers that resulted in the elliptical-shaped galaxies that we observe. The current AGN activity likely corresponds to the late episodes of accretion predicted by numerical simulations, which occur near the end of the mergers, whereas earlier episodes may be more difficult to observe due to obscuration. Our off-axis observations prevent us from detecting any current star formation or young stellar populations that may be present in the central few kiloparsecs.
Subject headings:
galaxies: interactions — galaxies: evolution — galaxies: stellar content — quasars: general1. Introduction
A paradigm is beginning to emerge that links galaxy mergers, starbursts, QSOs, and the formation of spheroids in galaxies into a single coherent picture that promises to explain a range of disparate phenomena connected to galaxy formation and evolution (e.g., Hopkins et al. 2006a). In outline, galaxy mergers involving gas-rich galaxies drive gas into the center of the resulting merger remnant, fueling both a starburst and the black hole that results from the merger of the central black holes of the merging galaxies. Initially, both the resulting QSO activity and much of the starburst are hidden at optical wavelengths by enshrouding dust, but eventually the strong outflow from the QSO clears a path along at least some sightlines (Canalizo and Stockton, 2001; Di Matteo et al., 2005). This same outflow, however, also clears out much of the gas that is feeding both the starburst and the QSO activity, quenching both within a relatively short time and providing a self-limiting mechanism for the growth of both the black hole and the stellar mass of the galaxy. This removal of the gas feeding the black hole also means that the optically luminous phase of the QSO is necessarily brief, – years. The coupling between black-hole growth and star formation provides a plausible explanation for the correlation between black-hole mass and spheroidal velocity dispersion (Gebhardt et al., 2000; Ferrarese and Merritt, 2000), and relations between the QSO luminosity and the strength of the outflow may also explain the shape of the QSO luminosity function (Hopkins et al., 2005). Furthermore, there may be a link between the QSO and merging galaxy luminosity functions (Hopkins et al., 2006b).
This close relationship between gas-rich mergers and nuclear activity is supported by evidence for recent starbursts in galaxies with high-luminosity AGN (Canalizo and Stockton, 2001; Sánchez et al., 2004; Letawe et al., 2007; Jahnke et al., 2007; Wold et al., 2010). However, it is seemingly difficult to reconcile such star formation with claims that most QSOs in the low-redshift universe are found in normal ellipticals with stellar populations overwhelmingly dominated by old stars (McLure et al., 1999; Nolan et al., 2001; Dunlop et al., 2003). Indeed, much skepticism remains concerning the relevance of major mergers (and their ensuing starbursts) in the triggering of AGN activity (e.g., Cisternas et al., 2011; Kocevski et al., 2012), although many agree that mergers do play an important role for higher luminosity AGN, such as QSOs (e.g., Treister et al., 2012).
Given that determining the relationship between mergers and the QSO population has important consequences in our understanding of galaxy evolution, it is pertinent to revisit the question whether or not QSO hosts have populations indicative of merger-induced starbursts. Bennert et al. (2008) studied the morphologies of five low-redshift QSO host galaxies that had been previously classified as undisturbed elliptical galaxies using deep (5 orbit) Hubble Space Telescope () Advanced Camera for Surveys (ACS) images. They found that, while the hosts are reasonably fit by a de Vaucouleurs profile, they also show significant tidal debris indicative of a merger event within the last Gyr.
Following Bennert et al. (2008), we now turn to the stellar populations in these and other similar bulge-dominated QSO host galaxies. Using high signal-to-noise ratio (S/N), deep Keck spectroscopy, we model the stellar populations to search for traces of significant starburst episodes in the recent past. In Section 2 we describe the sample, spectroscopic observations, and data reduction. In Section 3 we describe our modeling strategy and consider possible caveats, while in Section 4 we compare our results to those of similar studies. In Section 5 we discuss the interpretation of our results in the framework of galaxy evolution. Throughout the paper, we assume a cosmological model with km s-1Mpc-1, and (Spergel et al., 2003).
2. Observations and Data Reduction
2.1. Sample Selection
Our sample is drawn from the sample of 23 (10 radio-loud and 13 radio-quiet) QSOs of Dunlop et al. (2003). This sample contains radio-loud and radio-quiet QSOs in the redshift range of that are matched in optical luminosity. For details of the original sample selection, see Dunlop et al. (1993).
Dunlop et al. (2003) and McLure et al. (1999) performed a morphological study of this sample based on images and concluded that all of the host galaxies having nuclei in the QSO luminosity range are bulges that have properties “indistinguishable from those of quiescent, evolved, low-redshift ellipticals of comparable mass” (Dunlop et al., 2003). Similarly, by studying the stellar populations using spectroscopy obtained with 4-m class telescopes (Hughes et al., 2000), Nolan et al. (2001) conclude that these galaxies are dominated by truly old stellar populations with no significant episodes of star formation in the more recent past.
For this paper, we obtained spectra of as many of the 23 QSOs as we were able to observe during our runs, giving priority to those objects classified as ellipticals by Dunlop et al. (2003). The 17 targets that we observed are listed in Table 1, along with their host galaxy redshifts as measured from absorption lines in our spectra. We use the IAU designation listed in this table to refer to any given object throughout the paper.
| IAU | Host | Slit PA | Slit Offset | Dispersion | Total Int. | |
|---|---|---|---|---|---|---|
| Designation | (deg) | (″) | (kpc) | (Å pixel-1) | Time (s) | |
| 0054+144 | 0.1721 | 32.0 | 2.5 SE | 7.2 | 0.63, 1.86 | 10800 |
| 0137+012 | 0.2640 | 341.3 | 3.0 E | 12.1 | 0.63, 1.86 | 5400 |
| 0157+001 | 0.1637 | 103.0 | 4.0 N | 11.1 | 2.44 | 3600 |
| 0204+292 | 0.1102 | 0.0 | 3.0 E | 6.0 | 0.63, 1.86 | 1200 |
| 0244+194 | 0.1745 | 90.0 | 2.6 N | 7.6 | 0.63, 1.86 | 5400 |
| 0736+017 | 0.1886 | 351.5 | 3.0 W | 9.4 | 1.09, 2.55 | 10800 |
| 0923+201 | 0.1935 | 70.3 | 2.5 NNE | 8.0 | 1.09, 1.86 | 7200 |
| 1004+130 | 0.2415 | 70.0 | 2.5 ESE | 9.4 | 1.09, 1.86 | 7200 |
| 1012+008 | 0.1856 | 61.4 | 0.0 | 0.0 | 2.44 | 1200 |
| 1020103 | 0.1957 | 341.6 | 2.5 NW | 8.0 | 1.09, 2.55 | 7200 |
| 1217+023 | 0.2408 | 337.0 | 2.5 WSW | 9.4 | 1.09, 1.86 | 7200 |
| 1549+203 | 0.2527a | 72.0 | 2.0 NNW | 7.8 | 1.09, 1.86 | 7200 |
| 1635+119 | 0.1476 | 57.0 | 0.0 | 0.0 | 1.09, 2.55 | 5400 |
| 2135147 | 0.1994 | 343.8 | 3.0 WSW | 9.8 | 0.63, 1.86 | 5400 |
| 2141+175 | 0.2115 | 90.0 | 2.2 N | 7.5 | 0.63, 1.86 | 5400 |
| 2247+140 | 0.2340 | 40.0 | 2.5 NE | 9.2 | 0.63, 1.86 | 5400 |
| 2349014 | 0.1746 | 0.0 | 3.0 W | 8.8 | 0.63, 1.86 | 5400 |
Note. — aRedshift for 1549+203 measured from narrow emission lines.
2.2. Spectroscopic Observations
Spectroscopic observations were carried out with the Low-Resolution Imaging Spectrometer (LRIS; Oke et al., 1995) on the Keck I telescope on the nights of UT 2002 March 4 and 8, and 2002 October 3 and 12. For the blue side (LRIS-B), we used either the 400 groove mm-1 grism blazed at 3400 Å or the 600 groove mm-1 grism blazed at 4000 Å yielding dispersions of 1.09 Å pixel-1 and 0.63 Å pixel-1, respectively. For the red side (LRIS-R), we used either the 300 groove mm-1 grating blazed at 5000 Å or the 400 groove mm-1 grating blazed at 8500 Å, yielding dispersions of 2.55 Å pixel-1 and 1.86 Å respectively. The slit was 1″ wide, projecting to 7 pixels on UV- and blue-optimized CCD on LRIS-B and 5 pixels on the Tektronix 20482048 CCD on LRIS-R. A few of the objects were observed with a set up that resulted in a gap of a few hundred angstroms between the blue and red sides. We obtained between two and six exposures for each host galaxy, typically 1800 s each, dithering along the slit between exposures. A spectrum of the QSO nucleus for each object was obtained separately, with total integration times between 600 and 1200 s, depending on the magnitude of each QSO, so as to obtain a S/N 100. The typical seeing for all observations was 07 in . Four or five spectrophotometric standards from Massey et al. (1988) were observed each night for flux calibration.
Objects 0157+001 and 1012+008 were observed with the old LRIS (single camera) on the Keck II telescope on UT 1997 September 13 and 1998 April 6, respectively. We used a 300 groove mm-1 grating blazed at 5000 Å with a dispersion of 2.44 Å pixel-1. The slit was also 1″ wide, projecting to 5 pixels on the Tektronix 20482048 CCD.
In Table 1 we show a complete journal of observations, including slit positions, total exposure times, and wavelength resolutions for the blue and red sides, respectively.
The slit was placed offset from the nucleus for each object, with a separation that depended on the brightness of the QSO and the seeing conditions, so as to minimize the contamination from QSO light. Thus, the spectra that we obtained correspond to regions of the host galaxy at a given distance from the center, as listed in Table 1. For two objects, 1012+008 and 1635+119, we placed the slit through the nucleus. However, the spectra that we recovered corresponded to regions at a distance 5 kpc from the nucleus.
The majority of objects were observed near transit to minimize the effects of differential atmospheric refraction. In a few cases when the objects were observed at somewhat higher airmasses (1.1 to 1.4), shorter exposures at parallactic angle were obtained to correct the continuum of the QSO and the host galaxy. Only one object, 0204+292, was observed at high airmass (2).
Spectra were reduced using standard procedures and corrected for galactic reddening using the values given by NED, which are calculated following Schlegel et al. (1998). For each object, a scaled version of the QSO spectrum was subtracted from that of the host galaxy. In order to model the contribution of the QSO to the host galaxy spectrum at each wavelength, we obtained spectra of bright standard stars by placing the slit at several distances from the star and at different angles to simulate our off-nuclear observations of the host galaxies. We then multiplied the spectrum of each QSO by the corresponding model. Finally, we scaled the model of the QSO contribution for each object by measuring the flux in broad lines in the spectrum of the host and subtracted it from the latter. The precise determination of the scaling of the QSO spectrum was an iterative process where we tested a range of factors until we obtained clearly over- and under-subtracted host spectra. We used these extreme cases to determine the effects of the uncertainty introduced by the subtraction of the QSO light from the hosts on the modeling of the stellar populations, as described below. The QSO contribution to the observed host spectrum that was subtracted, as measured at rest wavelength 4500 Å, is listed as a percentage value in Table 2.
The red-side spectrum of 0244+194 was corrupted, so we only used the blue-side spectrum when modeling stellar populations. As mentioned above, 0204+292 was observed at high airmass and the host galaxy spectrum suffered from strong contamination from the QSO that we were not able to model appropriately. Therefore, we were unable to recover a clean spectrum of the host galaxy. For this reason, this object was not included in the analysis. The spectrum of the host galaxy of 1549+023 was also too noisy to be modeled and it is also excluded from the analysis. Our final sample thus consists of 15 objects.
3. Modeling of Stellar Populations
3.1. Fitting method
Several different strategies for modeling stellar populations in QSO and other AGN host galaxies have been developed over the last two decades. Some authors (e.g., Sánchez et al., 2004; Jahnke et al., 2004) use the SEDs and colors of hosts obtained from images, while others (e.g., Kauffmann et al., 2003) use diagnostic diagrams such as the (4000)/H plane. Although these techniques are powerful to analyze large samples of galaxies, they could potentially be vulnerable to degeneracies, such as the age-metallicity degeneracy, and contamination by scattered QSO light (e.g., Young et al., 2009).
There are relatively few studies in the literature that include modeling of absorption-line spectroscopy of QSO hosts. Even in those few studies, the techniques employed are vastly different. For example, Nolan et al. (2001) model off-nuclear spectra of QSO hosts in the Dunlop et al. (2003) sample using stellar synthesis models. They use the nuclear spectrum of one of the QSOs in the sample to account for QSO light contamination, and they fix a 0.1 Gyr population to account for any recent star formation that may have occurred. They then vary the age of the old underlying population and determine the relative contribution between the older and the younger populations. One problem with this method is that the spectra of younger populations change much more rapidly with age than those of older populations. Whereas the SEDs and stellar features change vastly from 0 to 1 Gyr, they remain almost unchanged for ages greater than 6 Gyr, and the only parameter that changes significantly is the contribution by mass to the spectrum. Thus, this method is prone to result in more degeneracies, and it is unable to determine the actual age and contribution of the younger population. Not surprisingly, they find that the host galaxies are dominated by old stellar populations with a very small contribution of the 0.1 Gyr population
Wold et al. (2010) do a more detailed modeling of the off-nuclear spectra of ten QSOs. Their fitting method is based on that of Cid Fernandes et al. (2005): They fit simultaneously instantaneous burst models of 15 different ages ranging from 0.001 to 13 Gyr. In addition, they account for scattered QSO light and reddening. In contrast to the results by Nolan et al. (2001), they find an average light-weighted age of 2 Gyr for the host galaxies in their sample.
Our approach is a simplified version of the technique used by Wold et al. (2010). The main question we want to answer is whether the host galaxies were formed at high redshift, with their populations only passively evolving, or whether there have been any significant episodes of star formation in the more recent past. Therefore, we have chosen to employ a method that we have used in the past (Canalizo et al., 2007; Canalizo and Stockton, 2001, 2000a, 2000b) which has proved to be very robust. We assume an old stellar population (with a fixed age) corresponding to the populations existing in the host galaxy or galaxies. To this, we add a younger stellar population representing a star forming event in the more recent past. We then vary the relative contribution of the two stellar populations and the age of the younger population, and we perform a least square fit to the observed data, masking out regions of obvious emission lines and any regions showing excessive noise, and giving a lower relative weight to regions that contained pure stellar continuum, i.e., no absorption features. A clear advantage of this method is that there are only two free parameters and thus we encounter fewer degeneracies.
We typically assume the old population to be a 10 Gyr-old population, although we have found that the precise choice of the older population has no significant effect on the age of the younger population determined from the best fit. However, the choice of the old population does have an effect on the determination of the relative contribution between the older and younger populations, in the sense that over-estimating the age of the older population will result into an over-estimation of the contribution of the younger population and vice versa. This systematic uncertainty is of the order of a few percent, even when the age of the old population is varied by as much as five Gyr.
We use the stellar population synthesis models by Bruzual and Charlot (2003, heareafter BC03) because they provide a good match to the spectral resolution of our data and allow us to test the effects of varying a wide range of metallicities. They are also widely used in the literature and allow for us to readily compare our results to those of previous studies. While a recent study by Zibetti et al. (2013) indicates that the BC03 models are still the most successful at reproducing the observed SEDs and features of post-starburst galaxies, we have chosen to also use two other sets of models that include different AGB star prescriptions: those by Maraston (2005, hereafter M05) and S. Charlot & G. Bruzual (2007, private communication; hereafter CB07). As we discuss below, we find remarkable consistency in the results obtained with the three sets of models. The description of the fitting and analysis below refers to the BC03 models, unless otherwise specified.
In carrying out the fitting procedure, we smoothed the models to match the velocity dispersion of the host galaxies and the various resolutions of the spectra. Velocity dispersions were determined by using the penalized pixel-fitting procedure (pPXF) of Cappellari and Emsellem (2004). We followed their prescription for adjusting the bias parameter, although, for our spectra, the results were not particularly sensitive to this choice.
Although the uncertainties in the determination of the QSO contribution to the host spectrum (listed in Table 2) are only of the order of a few percent, they could have an effect in the determination of the age of the stellar populations. In order to estimate the magnitude of this effect, we created versions of host spectra in which the QSO contribution was clearly under- and over-subtracted, and we modeled these extreme spectra. The best-fit stellar population ages determined for the under- and over-subtracted spectra were somewhat different from those determined for the spectra with the best QSO subtractions, but the difference was typically smaller than the 68% confidence intervals in the fits given in Table 2. Moreover, the of the best fits in the extreme spectra was significantly greater.
Many of the spectra of the individual objects show narrow emission lines. In most cases, the emission lines come from gas ionized by the QSO in the extended narrow line region (NLR). However, in a few cases (discussed in more detail in the Appendix), we see [O II] 3727 even when [O III] is weak or absent. This may be indicative of a small amount of current star formation or low velocity shocks in these hosts.
The presence of narrow emission lines in the host galaxy spectra affects the strength of the observed Balmer absorption features. In fact, Balmer absorption features cannot be relied on because of (1) uncertainty in the ratio of narrow to broad emission in the scaled QSO spectrum relative to that in the scattered light (i.e., the QSO spectrum may miss some of the NLR, which will still be present in the scattered component), and (2) the frequent direct contamination from extended narrow-line emission. For this reason, we do not use their equivalent widths or their corresponding Lick indices directly in our analysis. The Balmer absorption lines, when available, do still enter as one component in our spectral fits. In some cases, the emission is clearly narrower than the absorption and can be masked out during the fitting procedure.
For any objects for which there were concerns about the accuracy of the spectrophotometric calibration, we normalized the continuum of both the host galaxy spectrum and the models to unity to eliminate any dependance on the shape of the continuum. In all cases, these fits gave essentially the same starburst ages as the original fits that included the continuum shape.
As an additional check, we have attempted to analyze the stellar populations, again using the pPXF routine of Cappellari and Emsellem (2004). In the mode we used, pPXF finds the best linear combination of spectral synthesis models to fit the observed spectrum over the rest-frame 3500–4500 Å. A 4th-order multiplicative polynomial is included in the fit to remove the low-order dependence on flux calibration and reddening. Because this procedure introduces many more free parameters, it will work best for the spectra for which we have the highest S/N. This indeed seems to be the case: for the roughly half of the sample with the highest S/N and the least impact from extended emission, we find significant contributions from populations with ages within the range given in Table 2. For all but one of the remaining QSO hosts, we find contributions from intermediate-age populations with ages slightly outside this range. For 2135147, this procedure finds only an old stellar population; but this host galaxy is the one most strongly impacted by an extended emission region, so Balmer absorption lines have no influence on the solution.
We used models with metallicities ranging from 0.004 to to fit the host galaxy spectra. Invariably, models with led to poor fits or did not converge. For most objects, the fits with the lowest values corresponded to those of models with solar metallicity. Even in cases where models with metallicities somewhat lower or higher than solar gave reasonable fits, the ages of the best fitting populations changed only by %. For consistency, we report results using solar metallicity models for all objects, except for 1217+023, where a resulted in a significantly better fit. See Section 3.3.1 for further discussion on metallicities.
3.2. Results: Starburst Ages
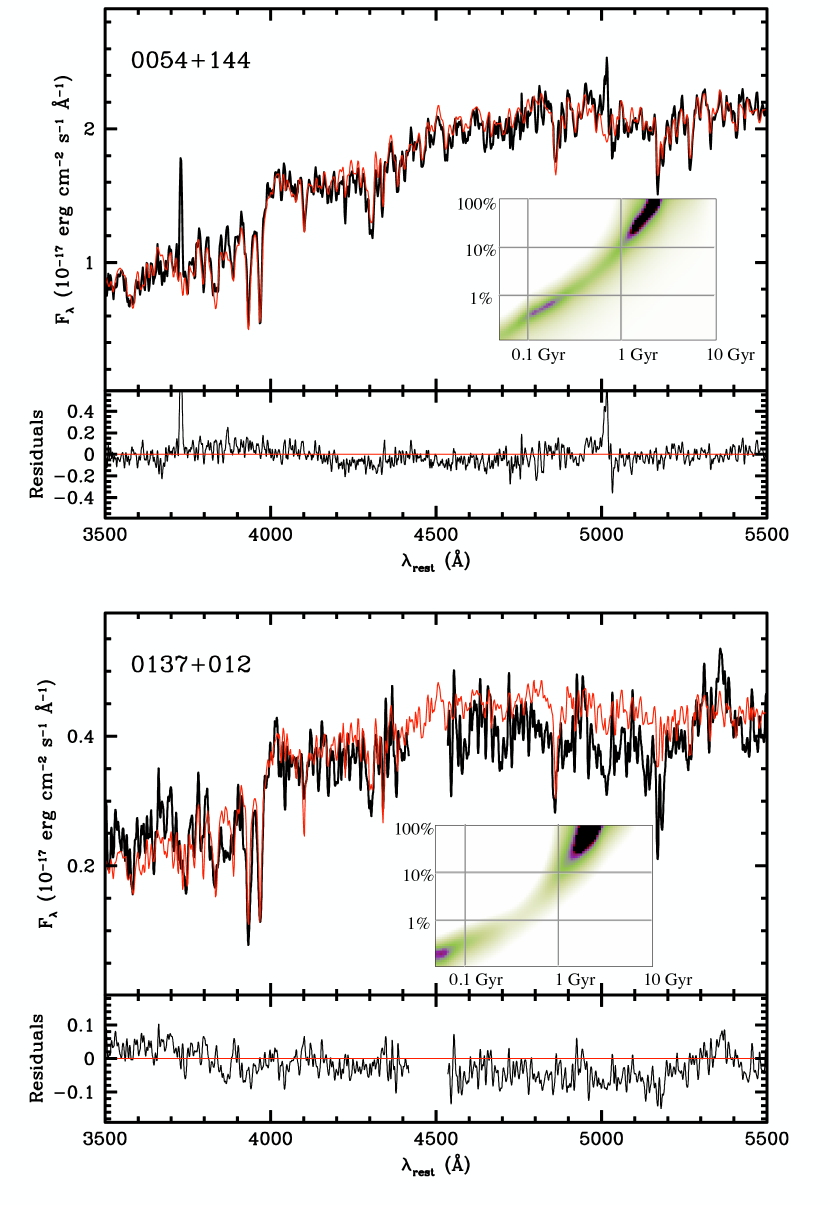
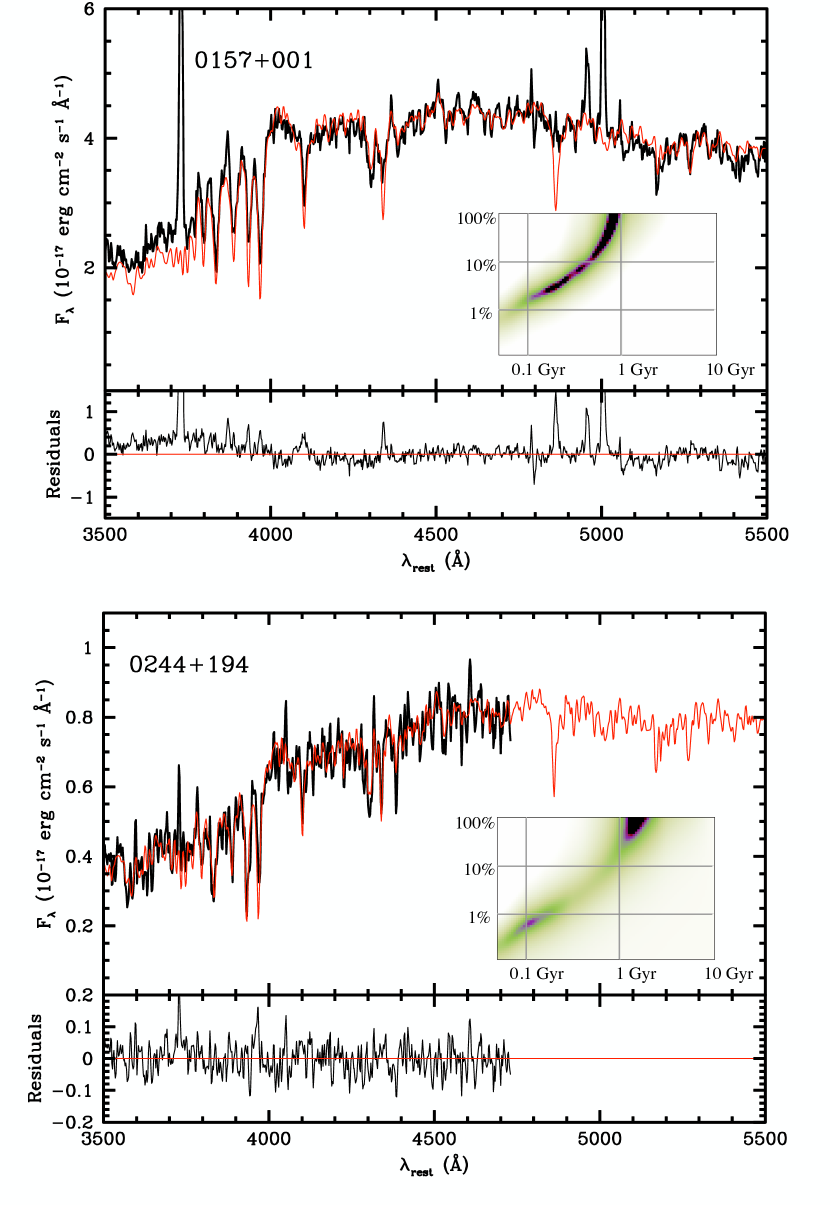
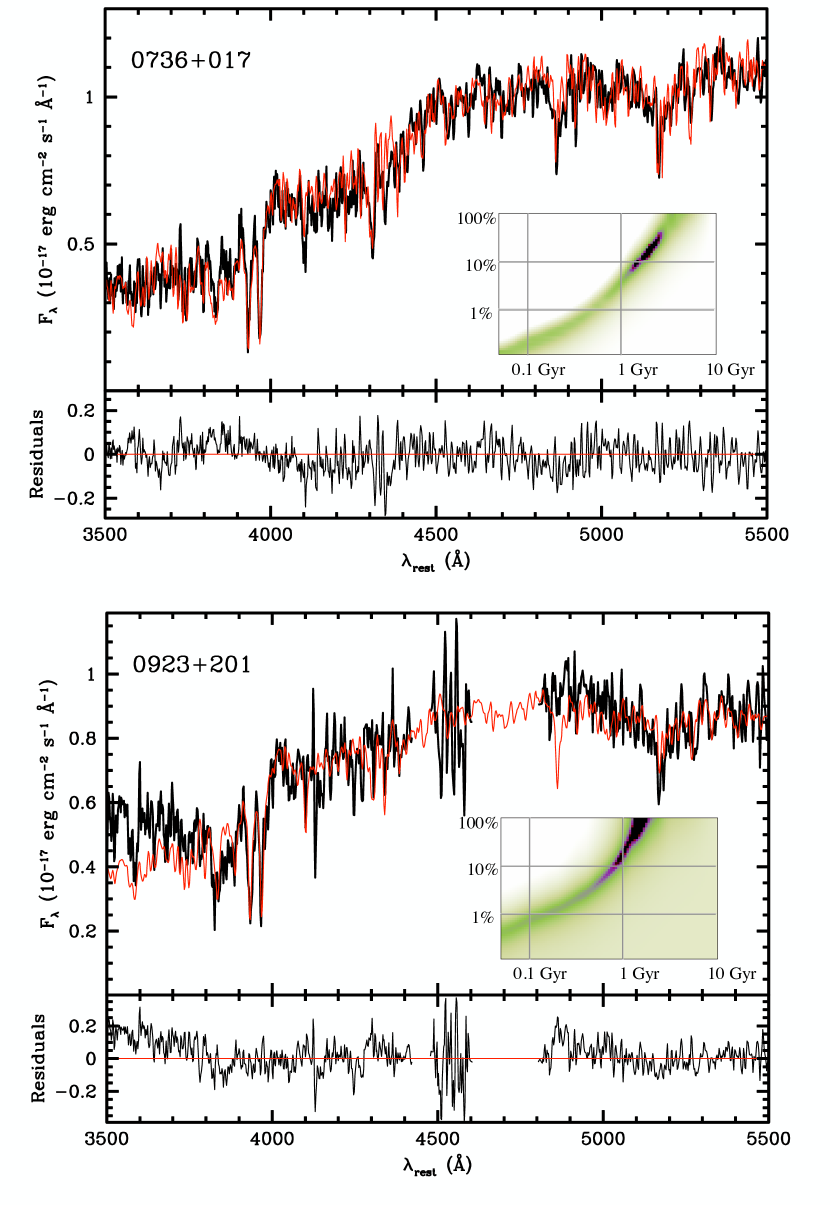
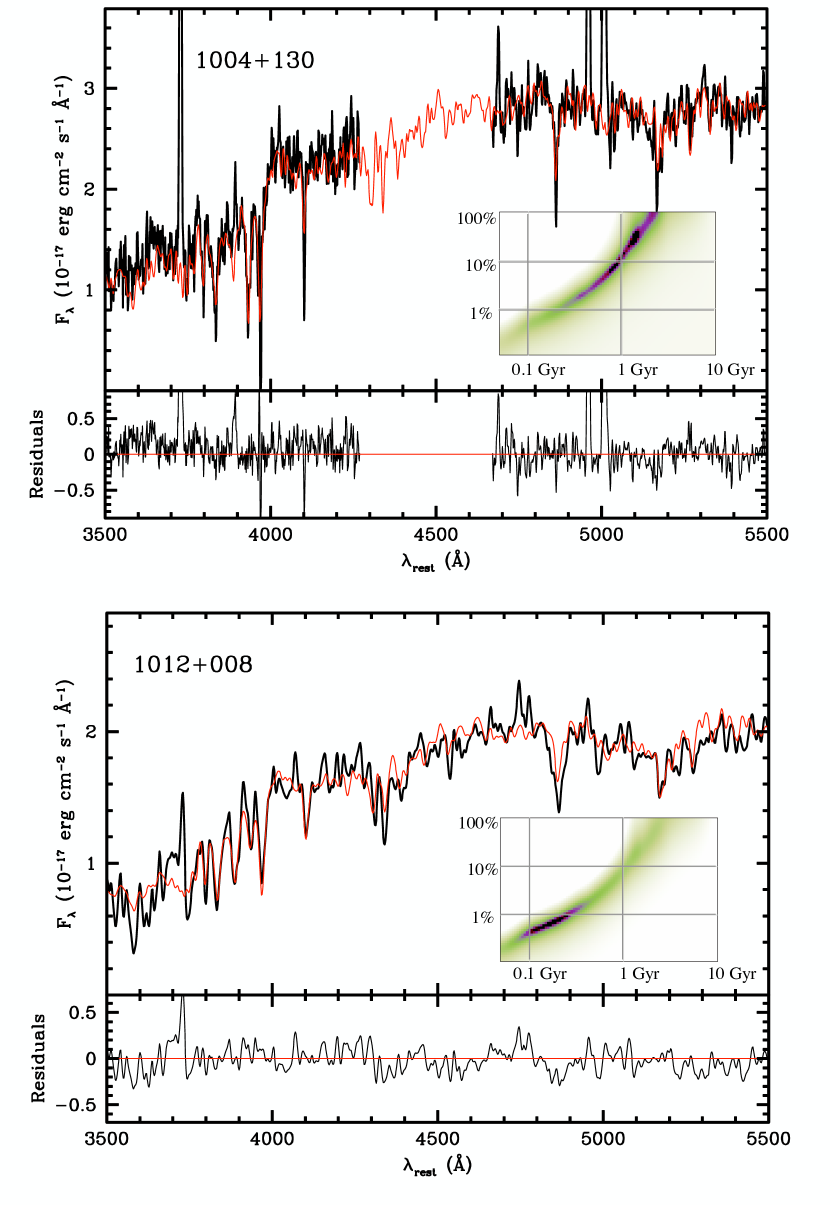
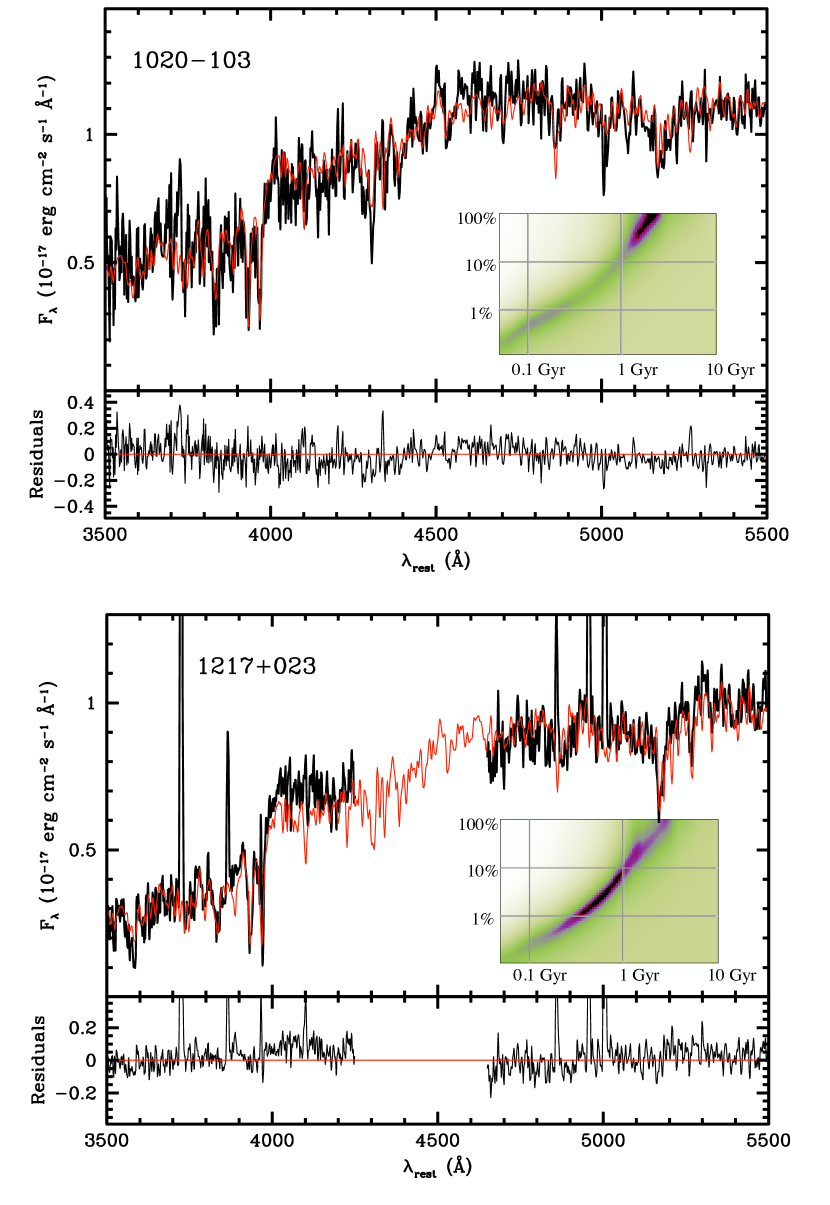
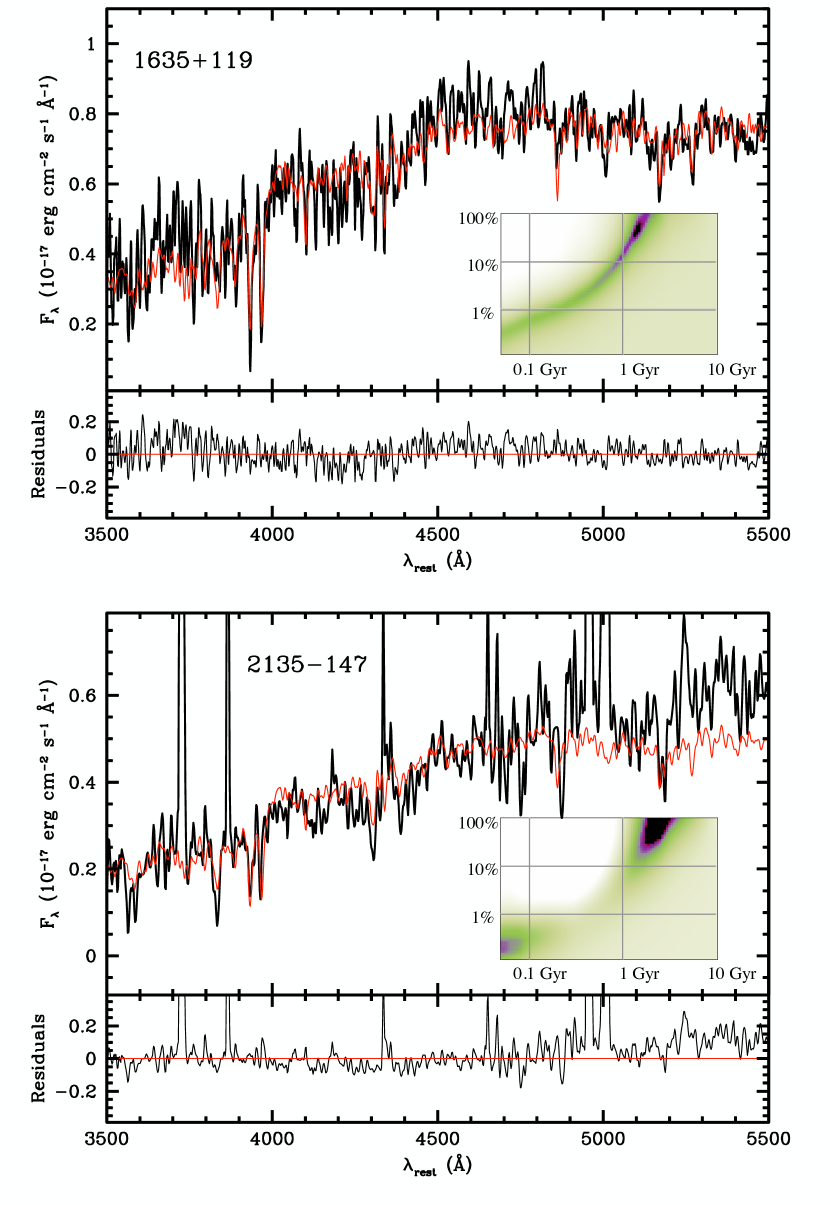
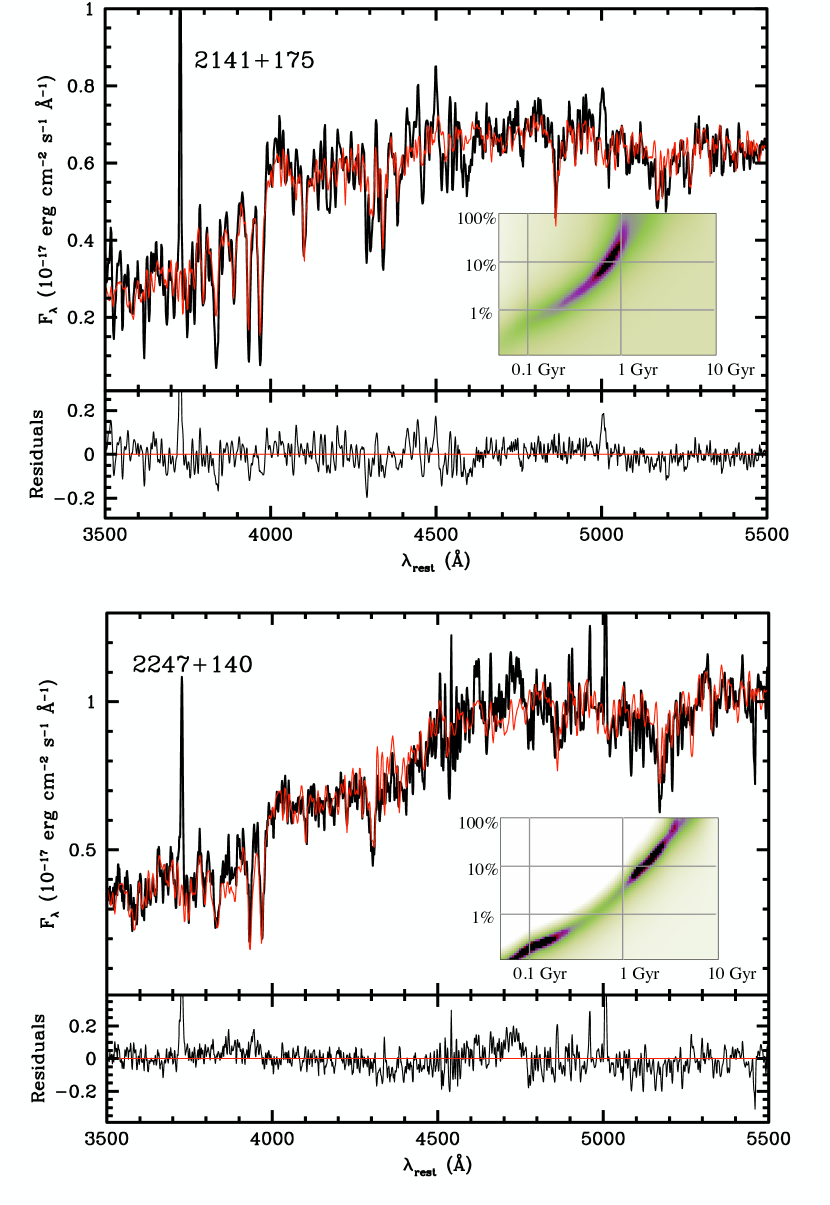
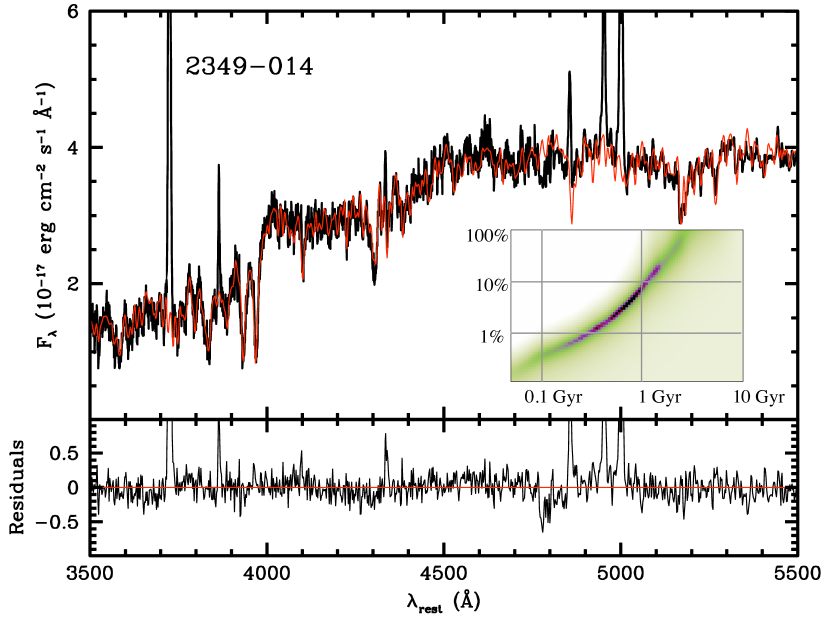
Our results are summarized in Figure 1 and Table 2. Figure 1 shows each of the QSO host spectra in the sample along with the best-fit model. As mentioned above, each model consists of a 10 Gyr old population plus a younger (typically of intermediate-age) starburst. The models have been matched in resolution to the host-galaxy spectra, taking into account both the instrumental profile and the velocity dispersion of the host galaxy. In Table 2, we list the relative contribution at 4500 Å (rest wavelength) of the QSO component that was subtracted from the observed host spectrum as described above, and the off-nuclear stellar velocity dispersion, . We also list the starburst ages and the percentage by mass that they contribute to the best-fit models. The age range given corresponds to the 68% confidence intervals in the fits for starburst ages, with their respective contributions listed as a contribution range. The first striking result is that the majority of the hosts have a substantial contribution from an intermediate-age starburst population.
| QSO | b | Starburst Age | Range | Contribution | Range | |
|---|---|---|---|---|---|---|
| Object | Cont.a | (km s-1) | (Gyr) | (Gyr) | by mass | |
| 0054+144 | 9% | 160.0 9.6 | 2.1 | 1.3–2.7 | 30% | 13–70% |
| 0137+012 | 39% | 160.6 24.5 | 1.7 | 1.4–2.7 | 50% | 20–100% |
| 0157+001 | 21% | 169.4 65.8 | 0.8 | 0.2–1.0 | 61% | 3–100% |
| 0244+194 | 29% | 122.2 11.2 | 1.4 | 1.0–1.9 | 90% | 50–100% |
| 0736+017 | 26% | 214.2 19.6 | 2.2 | 1.6–2.4 | 15% | 9–24% |
| 0923+201 | 57% | 231.4 50.2 | 1.4 | 0.8–1.9 | 56% | 10–100% |
| 1004+130 | 50% | 99.6 59.6 | 1.1 | 0.8–1.4 | 23% | 7–29% |
| 1012+008 | 40% | 157.0 357 | 0.2 | 0.10–0.25 | 0.7% | 0.5–1.2% |
| 1020103 | 29% | 318.3 73.4 | 1.9 | 1.4–2.4 | 80% | 30–100% |
| 1217+023 | 55% | 239.5 27.7 | 0.7 | 0.4–0.9 | 3.7% | 1.0–6.7% |
| 1635+119 | 8% | 150.6 35.2 | 1.5 | 1.2–1.8 | 42% | 25–86% |
| 2135147 | 48% | 184.7 55.4 | 2.4 | 1.8–2.8 | 90% | 85–100% |
| 2141+175 | 77% | 189.8 20.7 | 0.8 | 0.6–1.0 | 12% | 6.3–22% |
| 2247+140 | 20% | 210.5 15.7 | 2.1 | 1.2–2.6 | 15% | 6–30% |
| 2349014 | 26% | 228.4 14.6 | 0.8 | 0.5–1.1 | 4.2% | 2–10% |
Note. — aQSO contribution to total flux of observed off-nuclear host galaxy spectrum, as measured at rest wavelength 4500 Å. This contribution has been subtracted as explained in Section 2.2. bOff-axis stellar velocity dispersions have not been aperture corrected.
In Table 3 we compare the results obtained using the BC03 models with the CB07 and M05 models. In spite of the differences in these sets of models, the best fit starburst ages obtained from these three sets of models are in remarkable agreement. There is considerably more variation among the models in the values of the relative contribution of the starbursts. This is not surprising considering the large ranges of values that are given as confidence levels in Table 2. The large uncertainties in the relative contributions are explained as follows: While the total flux emitted per solar mass changes rapidly (by more than a factor of two) between a population of 1 and 2 Gyr, the spectral features (including the shape of the continuum) change much more slowly and, therefore, changes relatively slowly. In other words, a small increase in age for the starburst requires a larger increase in its relative contribution toward the total spectrum. This results in a broad range of values for the contribution that give similar values of (see insets in Fig. 1). Thus, the precise values of the relative contribution should not be taken at face value, but rather as a general guide for the relative importance of the starburst population. Even taking into account the large uncertainties, our results show that the contribution from the intermediate-age populations is rather substantial.
| Bruzual & Charlot ’03 | Charlot & Bruzual ’07 | Maraston ’05 | ||||
|---|---|---|---|---|---|---|
| Starburst Age | Contribution | Starburst Age | Contribution | Starburst Age | Contribution | |
| Object | (Gyr) | by mass | (Gyr) | by mass | ||
| 0054+144 | 2.1 | 30% | 2.1 | 30% | 1.5 | 50% |
| 0137+012 | 1.7 | 50% | 1.7 | 50% | 1.8 | 65% |
| 0157+001 | 0.8 | 71% | 0.8 | 77% | 1.0 | 100% |
| 0244+194 | 1.4 | 90% | 1.4 | 90% | 1.5 | 100% |
| 0736+017 | 2.2 | 15% | 2.2 | 10% | 2.0 | 14% |
| 0923+201 | 1.4 | 56% | 1.0 | 20% | 0.6 | 34% |
| 1004+130 | 1.1 | 23% | 1.1 | 28% | 0.9 | 20% |
| 1012+008 | 0.2 | 0.7% | 0.2 | 0.8% | 0.6 | 4.0% |
| 1020103 | 1.9 | 80% | 1.9 | 80% | 1.0 | 32% |
| 1217+023 | 0.7 | 3.7% | 0.5 | 0.8% | 0.6 | 1.5% |
| 1635+119 | 1.5 | 42% | 1.4 | 55% | 1.0 | 45% |
| 2135147 | 2.4 | 90% | 2.4 | 88% | 3.0 | 60% |
| 2141+175 | 0.8 | 12% | 0.7 | 9.1% | 0.6 | 9.3% |
| 2247+140 | 2.1 | 15% | 2.2 | 17% | 2.0 | 30% |
| 2349014 | 0.8 | 4.2% | 1.0 | 7.2% | 0.8 | 5.5% |
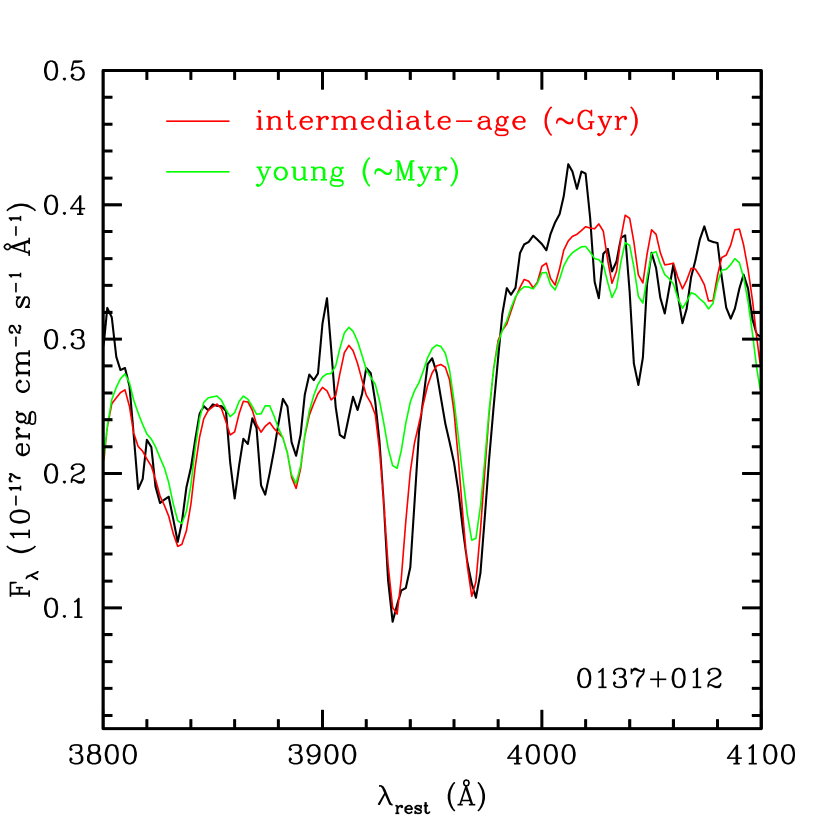
Six of the objects (0054+144, 0137+012, 0244+194, 1020103, 2135147, 2247+140) have a second minimum in (see insets in Fig. 1). The second minimum corresponds to a model with a very small contribution from a very young (tens of Myr or younger) population. This combination of populations reproduces the general shape of the continuum of the host galaxies quite well, and hence the lower value of . However, close examination of the stellar absorption features reveals that the model corresponding to the primary minimum is, indeed, a much better fit to the data than the values of would seem to indicate. Figure 2 illustrates this point. While the continuum of the 0137+012 host is well fit by a model composed of a 40 Myr plus a 10 Gyr old population, the stellar absorption features are best fit by a model including a 1.7 Gyr population.
In our analysis, we did not account for the effects of potential dust in the host galaxies. Any dust extinction will redden the continua and will therefore lead to overestimating the age and/or metallicity when fit with unreddened models. Therefore, the ages that we determine for the intermediate-age populations should be regarded as upper limits. However, the fact that we get similar ages for the intermediate-age populations from techniques that include the overall continuum SED and those that depend primarily on the absorption lines indicates that these populations cannot be substantially younger than these limits.
There was only one object, 2247+140, for which we found a significant age-metallicity degeneracy. For this object, increasingly older populations with increasingly lower metallicities result in equally good fits. At the lowest extreme, the spectrum is well fit by a single BC03 model of a 10 Gyr population with a metallicity of 0.4 Z☉. The M05 models show a similar trend, but in that case the extreme is a fit by a single 1 Gyr population of 0.5 Z☉.
As noted in the Appendix, 1012+008 presents special challenges, in that the host galaxy spectrum is slightly contaminated by the interacting spiral galaxy, and no observations of a star to calibrate the wavelength variation in scattering of the QSO light were available. Nevertheless, the qualitative presence of an intermediate-age population is quite secure because of the strength of the Balmer absorption lines.
We created an average QSO host galaxy spectrum (Figure 3) by combining the spectra of all the host galaxies (except for 1012+008, for the reasons given above). The spectra were normalized to their median flux in the region between 4020 and 4080 Å and weighted by their S/N. The resulting average spectrum is best fit by the combination of a 10 Gyr population with a 2.1 (+0.5, 0.7) Gyr population contributing 64% (+36, 36) to the total model by mass. A similar, but inferior, fit may be achieved for the 0.4 Z☉ models with a 10 Gyr plus a 2.0 Gyr population contributing 18% of the total mass.
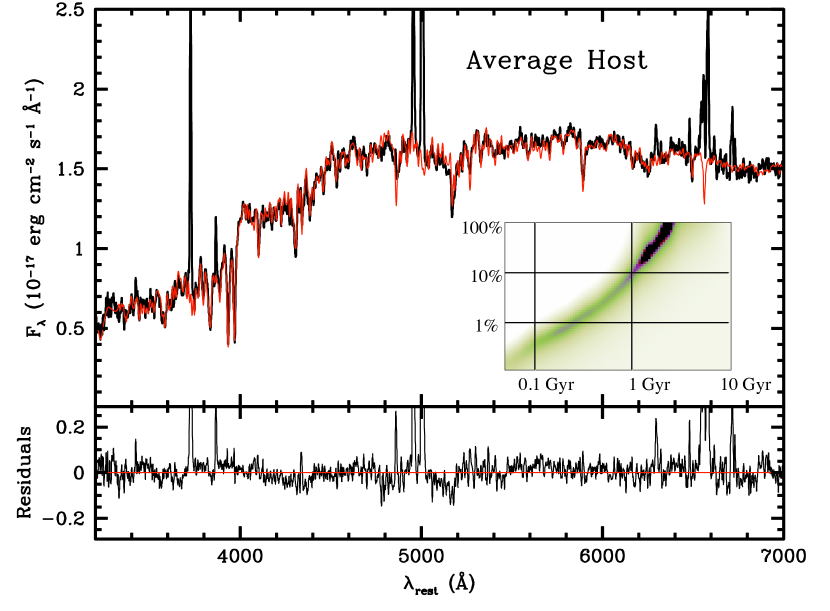
Thus, our results indicate that, far from being passively evolving elliptical galaxies, almost all of the QSO host galaxies have suffered a major event of star formation within the past Gyr.
3.3. Alternatives
We have found that the majority (14/15) of the host galaxies in our sample are composed of large fractions of intermediate-age stellar populations. Here we consider alternative scenarios that may be physically plausible.
3.3.1 Purely old populations
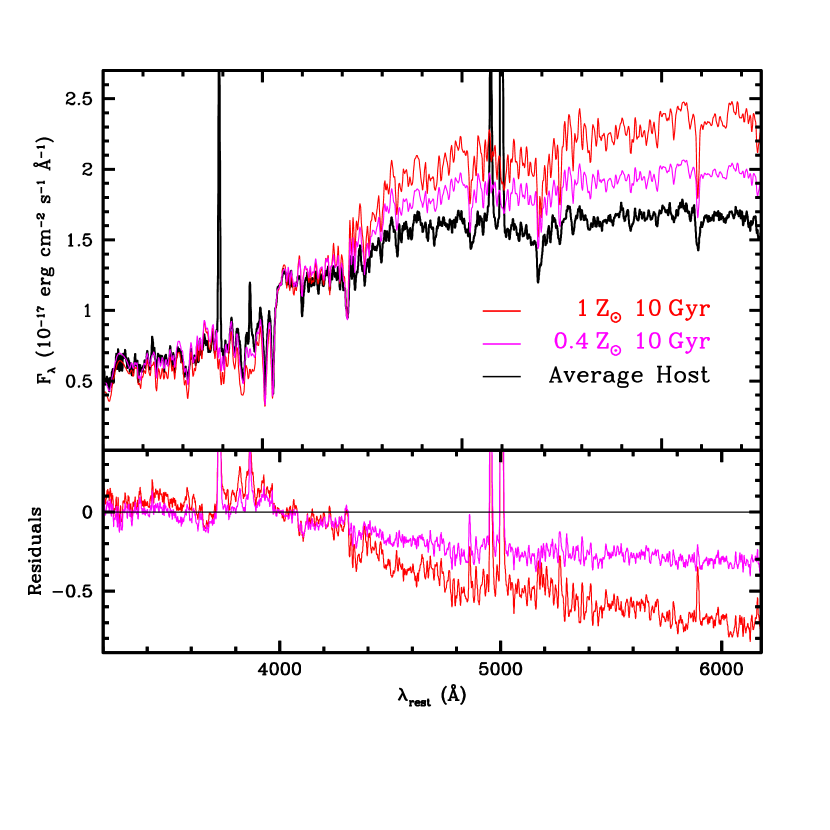
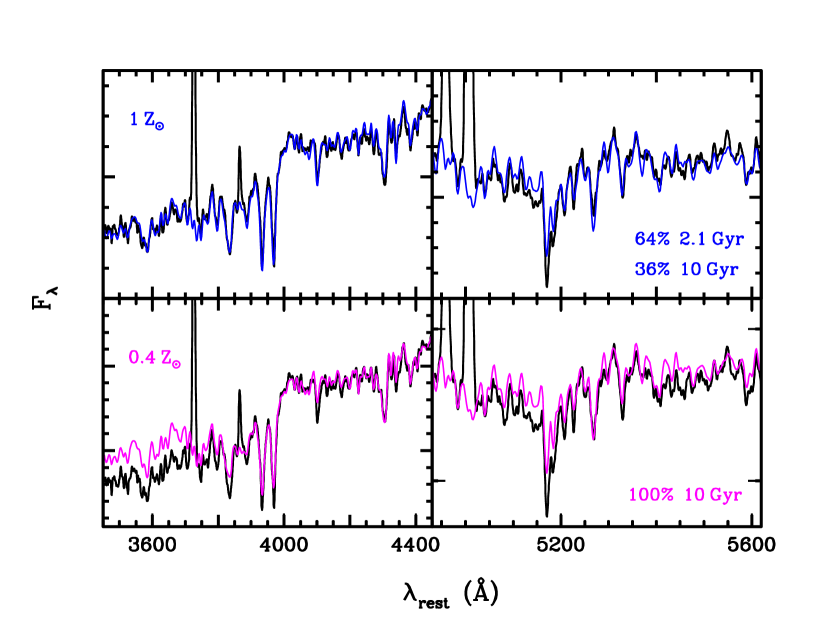
Our results clearly rule out the possibility that these hosts are “red and dead” elliptical galaxies. The values that we obtain by fitting a single population older than 8 Gyr are at least four times higher than those obtained from fits including an intermediate-age population. Figure 4 shows the average host galaxy spectrum described in Section 3.2 above. For comparison, we over-plot the Keck LRIS spectrum of a z=0.1930 elliptical galaxy from a control sample (G. Canalizo et al., in preparation), normalized to the flux at 4000 Å. We also over-plot single 10 Gyr bursts of 0.4 and 1 Z☉. Neither the elliptical galaxy, nor the different models match the host galaxy spectrum. The right panel of Figure 4 shows that the stellar population would have to have a metallicity lower than 0.4 Z☉ in order to match the continuum of the host galaxy spectrum and, even then, the stellar features would not be a good fit to the data, as we discuss below. In any case, it is highly unlikely that galaxies in this mass range ( M⊙; Dunlop et al., 2003; Decarli et al., 2010) would have such low metallicities.
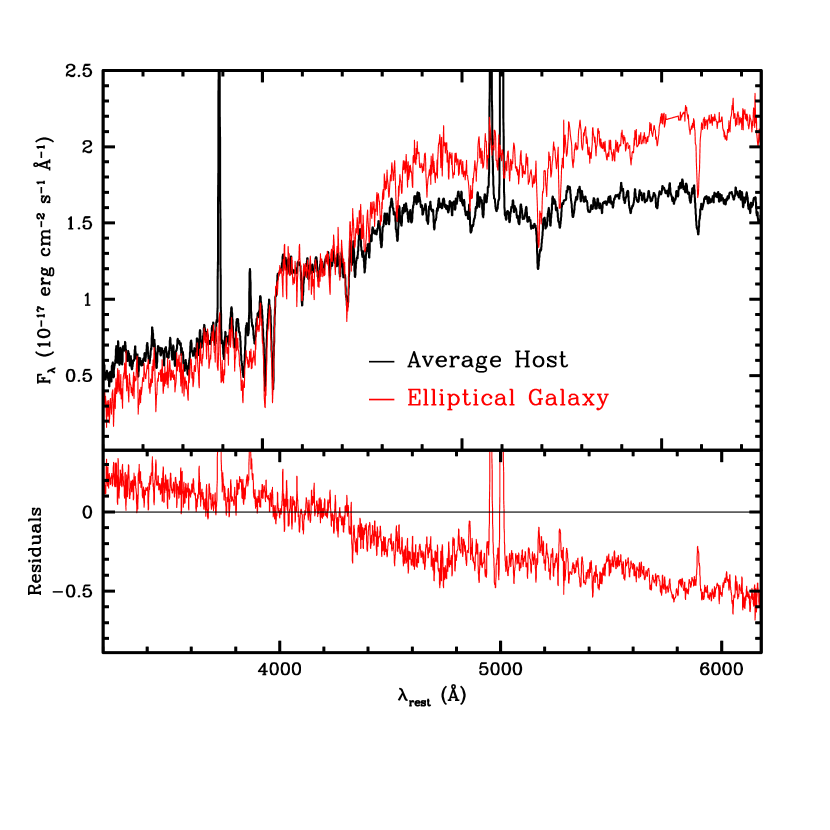
One might argue that the difference between the host galaxy spectra and a purely old population may be explained if the continuum of the host galaxy is affected by QSO light, whether scattered by free electrons and dust, as Young et al. (2009) suggest, or simply resulting from poor corrections of the QSO light contamination on the host. It is clear from the shape of the residuals in Figure 4 that the difference in the continuum between an old population and our QSO hosts cannot be accounted for by QSO light.
To further show that the QSO host spectra differ from old population spectra by more than just the continuum, we subtracted different amounts of QSO continuum from the average host to attempt to match the SED of the purely old populations discussed above. We subtracted a fit to an average QSO spectrum without including the emission lines, since the latter would otherwise be obviously over-subtracted from the average host. We found that there is no way to reproduce the SED of either the elliptical galaxy or the single 10 Gyr-old model of solar metalicity, regardless of the amount of QSO continuum subtracted. We were able to reproduce roughly the SED from 4000 to 6000 Å of the 0.4 Z☉ 10 Gyr-old model by subtracting an additional 18% (at 4500 Å) of QSO continuum (with no emission lines). It is clear from Figure 5 that even if the artificially modified average spectrum can match a portion of the SED of a low-metallicity purely old population, the stellar features are better fit by a population that includes an intermediate-age population. Thus, we conclude that the QSO host galaxy spectra cannot be fit by purely old stellar populations, regardless of metallicity or whether the spectra are contaminated by QSO light.
3.3.2 A very small contribution from a very recent starburst
As we mentioned in Section 3.2, the combination of an old population with a very small fraction of a very young (a few Myr- to a few tens of Myr-old) population can mimic the SED of some (6/15) of the hosts in the spectral range that we cover in our observations. This is essentially the result that Nolan et al. (2001) obtained. However, we have already shown that this particular combination of models is not a good fit to the absorption features in the spectrum.
Adding any other population to a mostly old (10 Gyr) population results in much worse fits. We experimented with different possibilities, such as adding a very small amount of sustained star formation rate, or an old population with an exponentially decaying star formation rate with a long e-folding time. None of these options resulted in acceptable fits.
3.3.3 Contamination by Blue Horizontal Branch Stars
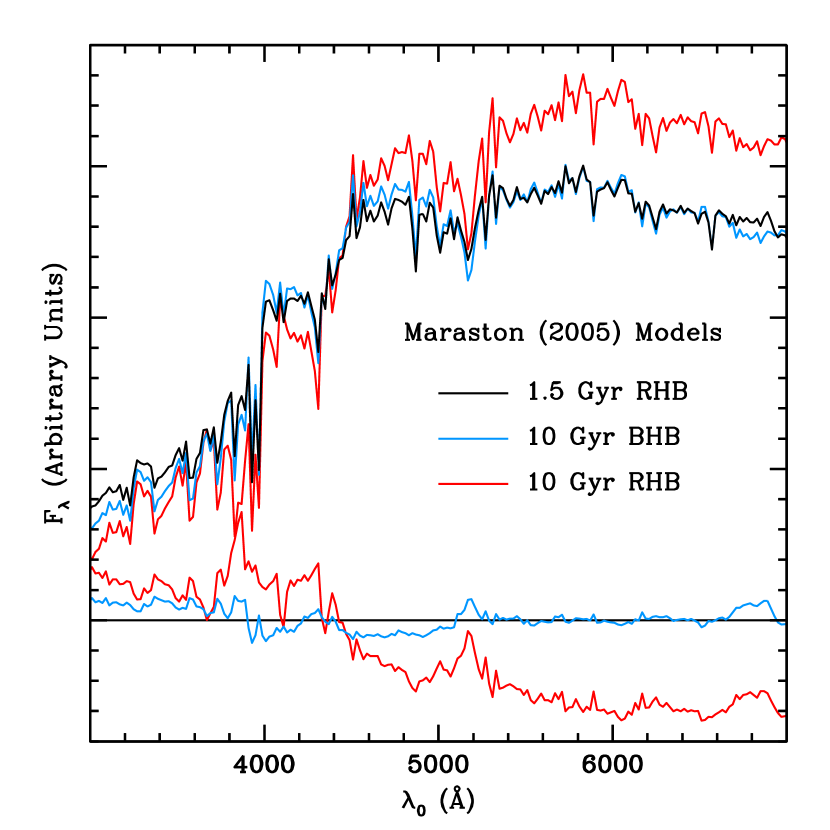
Can a moderately young (1–2 Gyr) population be impersonated by blue horizontal branch (BHB) stars in an old population? Figure 6 shows that such a scenario is at least roughly possible, in that a 10-Gyr-old model with a blue horizontal branch can mimic a 1.5 Gyr population fairly closely. One now has to ask whether it is astrophysically reasonable that luminous elliptical galaxies should have a sufficient population of BHB stars to produce the spectral variations that we have inferred to be signs of a 1–2-Gyr-old starburst.
The color of a star on the horizontal branch is determined to a large degree by its metallicity: the lower the metallicity, the bluer the star. By carefully modeling and subtracting off a maximum old, metal-poor component for a number of local ellipticals, Trager et al. (2005) show that, if a significant intermediate age population is actually present, correcting for the metal-poor population does not alter the age obtained for the intermediate-age population by very much. More importantly, the presence of the metal-poor population does not do away with the need for the intermediate-age population to explain the observed line strengths.
In our spectra, we do not have as good a calibration of line strengths as in studies of local ellipticals. On the other hand, for many of our host galaxies, the Balmer lines are considerably stronger than in the local sample and the inferred intermediate-age population is much more significant than in the galaxies discussed by Trager et al. (2005). Plausible levels of BHB contamination are quite insignificant in comparison. For our few marginal cases, we cannot completely exclude the possibility that BHB stars might reduce or eliminate the need for a younger component. However, given the clear presence of intermediate-age populations in much of our sample, it seems more likely that even these are examples of the same trend.
4. Comparison to other studies
Nolan et al. (2001) use stellar synthesis models by Jimenez et al. (2004) to model off-nuclear spectra of the hosts of 14 of the 15 objects in our sample. Their spectra were obtained with the Mayall 4-m telescope at Kitt Peak and the 4.2-m William Herschel Telescope on La Palma. In stark contrast to our results, they find that the hosts are dominated by populations of ages 8–14 Gyr, with at most a 1% contribution from younger stars. As we mentioned in Section 3.1, they fix a 0.1 Gyr population to account for any recent star formation that may have occurred, and find the best fit by varying the age of the old underlying population. Given their fitting method and the apparent degeneracy that we found at least for some objects in fitting the shape of the continuum, it is not hard to see how Nolan et al. (2001) arrived at this conclusion, especially since their spectra are best constrained redward of the 4000 Å break. Our spectra have much higher S/N that allow us to discriminate between the two combinations of populations that result into a good fit to the shape of the continuum.
Letawe et al. (2007) use Very Large Telescope FORS1 on-axis spectroscopy of the host galaxies of 20 luminous () QSOs at to study the stellar populations in these objects. The QSOs are of comparable to slightly higher optical luminosity than the objects in the Dunlop et al. (2003) sample (see Figure 1 in Letawe et al. 2007 for a direct comparison of the samples). The morphologies of the hosts are not exclusively bulge dominated, as in the Dunlop et al. (2003) sample, but they also include disks and evidently disturbed hosts. Using the multi-object mode, they simultaneously observe several PSFs that they then use to deconvolve the 2-D spectra. They measure Lick indices in the 15 objects for which they are able to recover absorption-line stellar spectra. By comparing them with the Lick indices of different types of galaxies, they find that only two of their hosts are consistent with being elliptical galaxies, while the rest of them have indices closer to those of late-type galaxies. They also find that the majority of the hosts harbor large amounts of gas.
Jahnke et al. (2007) conducted a study similar to that of Letawe et al. (2007), but they used a fundamentally different approach to the deconvolution of the host spectra from the PSF. They perform a semi-analytic two-component spatial PSF fitting of the 2-dimensional spectra of 18 quasars observed on-axis with EFOSC at the ESO 3.6-m telescope and FORS1 at the ESO VLT. They then determine stellar population ages of eight of the host galaxies by using two single stellar population BC03 models, including continuous star formation. They find that the light-weighted age for the hosts is 1-2 Gyr, regardless of whether they are disk or bulge dominated.
The results of Letawe et al. (2007) and Jahnke et al. (2007) agree with those of other studies of AGN hosts based on multi-band imaging studies (Kauffmann et al., 2003; Jahnke et al., 2004; Sánchez et al., 2004). While these studies focus on AGN that are, on average, 1 magnitude fainter than those of the Dunlop et al. (2003) sample, they find that the galaxies hosting the most luminous AGN are most often bulge-dominated. However, in agreement with our results and those of Letawe et al. (2007), they find that the host colors are significantly bluer than those of inactive elliptical galaxies, indicating the presence of intermediate-age populations. In particular, based on their position on the (4000)/H plane, Kauffmann et al. (2003) suggest that AGN hosts have had significant bursts of star formation in the past 1-2 Gyr.
Vanden Berk et al. (2006) use an eigenspectrum decomposition technique to isolate the host galaxy spectra from those of the broad-lined AGN they host in a sample of 4666 objects from the Sloan Digital Sky Survey. The median redshift of the objects with detected hosts is . The majority of the AGN in this sample have lower luminosities than those of the QSOs in the Dunlop et al. (2003) sample, but a significant fraction of them have comparable luminosities (see their Figure 13). Vanden Berk et al. find that the hosts have much higher luminosities than expected for early-type galaxies, and that their colors become increasingly bluer with higher luminosities, when compared with the colors of ellipticals and bulge dominated galaxies. They define two classification angles formed from the first three galaxy eigencoefficients (equations 2 and 3 in Vanden Berk et al. 2006), which are correlated to spectral type and post-starburst activity, respectively (Connolly et al., 1995). Based on the distribution of the second classification angle in the hosts, they determine that host galaxies have significantly more post-starburst activity than their inactive counterparts. Although their analysis does not supply specific ages for the stellar populations, their results are at least in qualitative agreement with ours.
Wold et al. (2010) obtain off-nuclear Keck LRIS and WIYN SparsePak spectra of 10 QSO hosts at . Their sample includes four of the objects in our sample, and six other QSOs with similar optical luminosities. Seven of the host galaxies are classified as elliptical. Their observations are similar to ours and those of Nolan et al. (2001): short exposures of the QSO followed by longer off-axis integrations of the host, with offsets from the nuclei between 2″and 45. We described their modeling strategy in Section 3.1. They also find that the elliptical hosts have rest frame colors that are bluer than those of inactive ellipticals. Moreover, they detect substantial intermediate-age populations in each of the hosts, with an average light-weighted age for the sample of Gyr. We are unable to compare directly the precise starburst ages and contributions that we obtain with the results of Wold et al. (2010) because of the way they present their results. Although they obtain relative contributions of populations with 15 different ages, they bin their results into three groups: young (age 100 Myr), intermediate (age between 100 Myr and 1 Gyr), and old (age 1 Gyr). Since the majority of our objects have starbursts with ages somewhat greater than 1 Gyr, they would be classified as old if we were to use a similar classification. With this in mind, we find general agreement for the four objects that we have in common with their sample (see Appendix for details).
Cales et al. (2013) model the starburst component in the host galaxies of 38 0.3 “post-starburst quasars” observed with Keck LRIS and with the KPNO 4-m Mayall telescope and the R-C spectrograph. These objects show, simultaneously, broad lines from an AGN and absorption lines from a luminous post-starburst stellar population. The sample includes objects with a large range of AGN luminosities, with the high end having significant overlap with our sample. Cales et al. use the CB07 models along with models to simulate the AGN contribution. They do not include a stellar component for a possible old underlying population, as they argue that doing so does not significantly affect the age they determine for the starburst component. Their results are remarkably similar to ours: The age of the starburst component in 36/38 of their hosts ranges from 0.5 to 2.6 Gyr, with only two objects having ages of 0.3 Gyr. It is interesting to note that these objects were selected to have intermediate-age populations by design, whereas our objects were selected based on QSO luminosity, yet the two samples of objects have dominant starbursts with the same distribution of ages.
5. Discussion
The studies discussed in the previous section use vastly different techniques to (1) observe the objects, (2) recover the host galaxy spectra, and (3) model the stellar populations. Yet, with the exception of Nolan et al. (2001), all of these studies point to the presence of a major starburst episode in the host galaxies of low- QSOs within the last 2 Gyr.
What caused these massive starbursts and how are they related to the AGN activity? We have previously reported on the presence of striking tidal features and/or close interacting galaxies for six of the objects in our sample: 0157+001 (Canalizo and Stockton, 2000b), 1635+119 (Canalizo et al., 2007), 0054+144, 0736+017, 0923+201, 2141+175 (Bennert et al., 2008). The timescales implied by these various features are, in very rough terms, consistent with a picture where mergers were responsible for the starbursts that we observe. Assuming a projected velocity of 300 km s-1 on the plane of the sky for the stars that make up the tail, Canalizo and Stockton (2000b) estimate a dynamical age for the prominent tidal tail in 0157+001 of 330 Myr, compared to the stellar population of 0.8 (+0.2, 0.6) Gyr that we find (and already reported in Canalizo and Stockton 2000b). The dynamical age could be underestimated if the projected velocity is lower than 300 km s-1. Canalizo and Stockton speculate that the intermediate-age population may be the relic of a starburst ignited at an initial passage of the two interacting galaxies.
Bennert et al. (2008) estimate a dynamical age between 250 Myr and 1 Gyr for the tidal tails seen in deep images of 2141+175 and 0054+144 . While this age estimate is of the same order as the starburst that we observe in 2141+175 (0.8 [+0.2, 0.2] Gyr), it is younger than the starburst in 0054+144 (2.1[+0.6,0.8] Gyr). Thus, the starburst in the latter may have been triggered in a previous passage of the interacting galaxies, as in the case of 0157+001. Similarly, Bennert et al. estimate a dynamical age of 1 Gyr for the tidal structure (including ripples, tidal arms, and a faint long tidal tail) surrounding the host of 0736+201, which is of the order of, but younger, than the starburst age of 2.2 (+0.2,0.6) Gyr that we find in the host.
Canalizo et al. (2007) find striking shell structure in the host of 1635+119, along with ripples or tails and other debris extending out to a distance of 65 kpc. Their N-body simulations allow the structure to be as old as 1.7 Gyr, which is similar to the 1.6 (+0.4,0.2) Gyr starburst age we determine for the host.
While the host of 0923+201 does not show any obvious tidal features, it lies in a galaxy group of at least six members at similar redshifts (Bennert et al., 2008, and references therein), with several of the galaxies showing clear signs of interaction. There is one pair of interacting large elliptical galaxies at a projected distance of 37 kpc from the QSO host, and a smaller galaxy with tail-like structures 56 kpc away. It is likely that these galaxies have interacted with the host galaxy within the past 1.4 Gyrs, triggering the star formation in the host.
We will present deep images of the remaining objects in the sample, together with similar images of a matched control sample, in a forthcoming paper. In summary, we find clear traces of merger and interaction events in almost two thirds of the QSO hosts and hardly any such traces in the control sample.
A few of the spectroscopic surveys discussed in Section 4 also examine the morphologies of the hosts. Jahnke et al. (2007) and Letawe et al. (2007) find that 50% of the hosts in their samples show morphological signs of interactions and disturbed radial velocity curves. Of the 29 post-starbursts quasars that have images (presented by Cales et al., 2011), 17 (59%) show signs of interactions or mergers. The early-type galaxies in the sample, which host the most luminous AGN, have a similar fraction of objects with signs of interaction.
Although at first it would seem that the fractions of interacting objects in these samples are lower than in ours, we must keep in mind that our results are derived from high-resolution, very deep (five orbits) images that allow us to detect the aging tell-tale signs of mergers as they are fading away. If we were to analyze shallow and/or ground-based images of the six objects in our sample discussed above, we would find that only two (0157+001 and 2141+175) have obvious signs of tidal interactions and one (0923+201) has close interacting galaxies. Thus, based on this subsample, we would conclude that only 50% of the hosts are connected to mergers. It is then possible that most, if not all, of the QSO host galaxies that appear to be bulge dominated may indeed be more evolved merger remnants hosting intermediate age populations.
Thus, we find compelling evidence that the aging starbursts we observe in early-type QSO hosts were triggered during the early stages of a merger event. Typical QSO lifetimes are expected to be, at most, years, so the currently observed QSO activity cannot have been triggered at the same time as these -year-old starbursts. How, then, can we explain this correlation between QSO activity and intermediate-age starbursts?
Numerical simulations of merging galaxies show that the amplitude and duration of enhanced star forming activity, as well as the stage at which it occurs during a merger, depend on the specific parameters of the encounter (orbits, mass ratios, etc.) as well as the morphological type of the progenitors (e.g., Di Matteo et al., 2007). It is clear, however, that many mergers result in two major epochs of star formation: one soon after first passage, and one during final coalescence (e.g., Mihos and Hernquist, 1996; Cox et al., 2008; Torrey et al., 2012; Van Wassenhove et al., 2012). Similarly, numerical simulations show that accretion onto the central black hole(s) is episodic, and there can be two (or more) major epochs of AGN activity roughly corresponding to (but somewhat delayed with respect to; see Hopkins 2012) the times at which star formation is dramatically enhanced (e.g., Hopkins et al., 2008; Van Wassenhove et al., 2012, N.R. Stickley and G. Canalizo, in preparation). The time delay between the first and second epochs of enhanced star formation/AGN activity naturally depends on the details of the merger; typical values are of the order of 1 Gyr, i.e., of the same order as the ages of the starbursts that we observe in the QSO hosts.
Thus, our observations appear to be consistent with the predictions made by numerical simulations. In this picture, the QSO hosts in our sample are products of galaxy mergers. Strong bursts of star formation are induced in the early stages of a galaxy interaction. As the galaxies continue to merge for the next billion or so years, the new stars mix with the older populations, and they age as the morphology of the newly formed galaxy begins to relax. When gas continues to concentrate in the central regions of the galaxy, a new central starburst is triggered, followed by a final epoch of AGN activity. It is precisely at this moment that we seem to be observing the QSOs in our sample.
A glaring difference between this picture and our results is the absence of young stellar populations, expected to be the result of the major starburst triggered during the final coalescence of the galaxies, and a short time (of the order of 100 Myr; Hopkins 2012) before the triggering of the QSO. However, these starbursts are expected to occur very close to the nucleus (P. Hopkins, S. Van Wassenhove, private communication), whereas our spectroscopic observations cover regions of the host galaxies that are typically 8 kpc away from the center (see Table 1). Stars formed during earlier stages of mergers are more easily mixed with the rest of the population by the end of the merger because of the multiple passes that the interacting galaxies experience. However, once the galaxies merge, there is no further violent event to help mix the new stars. This is supported by numerical simulations that show that the velocity dispersions of stars formed in the late stages of mergers remain low compared to those of stars formed earlier on (N.R. Stickley and G. Canalizo, in preparation).
At least for the one object for which we have spatially resolved spectra, 0157+001 (Canalizo and Stockton, 2000b), we do find significantly younger populations (200 Myr old) near the QSO nucleus. There are a few other QSO hosts for which spatially resolved information on stellar populations exists. Canalizo and Stockton (2000a) show that the most luminous and youngest (10 Myr) stellar populations in the host galaxy of 3C 48 are concentrated in the central regions of the host (in the central 5 kpc), while the outer regions are dominated by an older population. Unfortunately, the S/N of the spectra in the outer regions is not sufficient to discriminate between a purely old population and a population including intermediate-age stars. Similarly, the youngest starbursts (50 Myr) in the host of Mrk 231 are found in a region 3 kpc from the QSO nucleus (Canalizo and Stockton, 2000b), whereas the outer regions are dominated by older populations. As in the case of 3C 48, the S/N is insufficient to determine the precise composition of the older populations. Finally, Brotherton et al. (2002) report on the presence of a 40 Myr starburst in the central 600 pc of the host galaxy of the prototype post-starburst quasar, UN J10250040, which is significantly younger than the dominant population of the host of 400 Myr.
However, there is evidence that the picture may be more complicated. Shi et al. (2007) found strong evidence that QSOs selected by different criteria showed different levels of star formation. In particular, their sample of PG QSOs (generally radio quiet; Schmidt and Green, 1983) showed significantly more star formation than did their sample of 3CR (i.e., radio-loud) QSOs. This result is amplified by Fu and Stockton (2009), who found that, of a sample of 13 radio-loud QSOs, only the compact-steep-spectrum quasar 3C 48 showed any evidence of star formation. For the remaining 12 QSOs, all with FR II radio morphologies, a stack of deep Spitzer IRS spectra indicated a conservative average star-formation rate upper limit of 12 M⊙ yr-1. These differences in typical star-formation rates between radio-quiet QSOs and FR II quasars most likely reflect differences in environments (Fu and Stockton, 2009, and references therein), but it is tempting to speculate that there may also be a dependance on merger stage. In any case, when Shi et al. (2009) say, “We propose that type-1 quasars reside in a distinct galaxy population that shows elliptical morphology but that harbors a significant fraction of intermediate-age stars and is experiencing intense circumnuclear star formation,” the last part of this statement appears not to hold generally for FR II quasar hosts.
We have concentrated on the QSO sample of Dunlop et al. (2003) precisely because of their contention that the host galaxies of this sample have properties indistinguishable from those of local quiescent ellipticals. We find instead that virtually all of them have intermediate-age populations comprising a significant fraction of the total mass of the host galaxies. These populations can be interpreted in a natural way in terms of models of galaxy mergers, where the star formation is triggered by a previous passage of the galaxies, while the current QSO activity results from the final merger. While there certainly are some cases of QSOs seen in conjunction with contemporaneous starbursts, or at least with much younger populations (Canalizo and Stockton, 2001), these seem to be relatively rare, and they probably depend on having serendipitous sightlines to the QSO through otherwise dusty host galaxies. In most objects at similar stages, the QSO nucleus is likely obscured, and the galaxies would be classified as ULIRGs or HyLIRGS. By the time the starburst has subsided and the dust has cleared, the QSO activity likely will have stopped, only to be re-triggered during the final merger.
References
- Bahcall et al. (1997) Bahcall, J. N., S. Kirhakos, D. H. Saxe, and D. P. Schneider, 1997: Hubble Space Telescope Images of a Sample of 20 Nearby Luminous Quasars. ApJ, 479, 642.
- Bennert et al. (2008) Bennert, N., G. Canalizo, B. Jungwiert, A. Stockton, F. Schweizer, C. Y. Peng, and M. Lacy, 2008: Evidence for Merger Remnants in Early-Type Host Galaxies of Low-Redshift QSOs. ApJ, 677, 846–857.
- Brotherton et al. (2002) Brotherton, M. S., M. Grabelsky, G. Canalizo, W. van Breugel, A. V. Filippenko, S. Croom, B. Boyle, and T. Shanks, 2002: Hubble Space Telescope Imaging of the Poststarburst Quasar UN J1025-0040: Evidence for Recent Star Formation. PASP, 114, 593–601.
- Bruzual and Charlot (2003) Bruzual, G. and S. Charlot, 2003: Stellar population synthesis at the resolution of 2003. MNRAS, 344, 1000–1028.
- Cales et al. (2011) Cales, S. L., M. S. Brotherton, Z. Shang, V. N. Bennert, G. Canalizo, R. Stoll, R. Ganguly, D. Vanden Berk, C. Paul, and A. Diamond-Stanic, 2011: Hubble Space Telescope Imaging of Post-starburst Quasars. ApJ, 741, 106.
- Cales et al. (2013) Cales, S. L., M. S. Brotherton, Z. Shang, J. C. Runnoe, M. A. DiPompeo, V. N. Bennert, G. Canalizo, K. D. Hiner, R. Stoll, R. Ganguly, and A. Diamond-Stanic, 2013: The Properties of Post-starburst Quasars Based on Optical Spectroscopy. ApJ, 762, 90.
- Canalizo et al. (2007) Canalizo, G., N. Bennert, B. Jungwiert, A. Stockton, F. Schweizer, M. Lacy, and C. Peng, 2007: Spectacular Shells in the Host Galaxy of the QSO MC2 1635+119. ApJ, 669, 801–809.
- Canalizo and Stockton (1997) Canalizo, G. and A. Stockton, 1997: Spectroscopy of Close Companions to Quasi-Stellar Objects and the Ages of Interaction-Induced Starbursts. ApJ, 480, L5.
- Canalizo and Stockton (2000a) —, 2000a: 3C 48: Stellar Populations and the Kinematics of Stars and Gas in the Host Galaxy. ApJ, 528, 201–218.
- Canalizo and Stockton (2000b) —, 2000b: Stellar Populations in the Host Galaxies of Markarian 1014, IRAS 07598+6508, and Markarian 231. AJ, 120, 1750–1763.
- Canalizo and Stockton (2001) —, 2001: Quasi-Stellar Objects, Ultraluminous Infrared Galaxies, and Mergers. ApJ, 555, 719–743.
- Cappellari and Emsellem (2004) Cappellari, M. and E. Emsellem, 2004: Parametric Recovery of Line-of-Sight Velocity Distributions from Absorption-Line Spectra of Galaxies via Penalized Likelihood. PASP, 116, 138–147.
- Cid Fernandes et al. (2005) Cid Fernandes, R., A. Mateus, L. Sodré, G. Stasińska, and J. M. Gomes, 2005: Semi-empirical analysis of Sloan Digital Sky Survey galaxies - I. Spectral synthesis method. MNRAS, 358, 363–378.
- Cisternas et al. (2011) Cisternas, M., K. Jahnke, K. J. Inskip, J. Kartaltepe, A. M. Koekemoer, T. Lisker, A. R. Robaina, M. Scodeggio, K. Sheth, J. R. Trump, R. Andrae, T. Miyaji, E. Lusso, M. Brusa, P. Capak, N. Cappelluti, F. Civano, O. Ilbert, C. D. Impey, A. Leauthaud, S. J. Lilly, M. Salvato, N. Z. Scoville, and Y. Taniguchi, 2011: The Bulk of the Black Hole Growth Since z ~ 1 Occurs in a Secular Universe: No Major Merger-AGN Connection. ApJ, 726, 57.
- Connolly et al. (1995) Connolly, A. J., A. S. Szalay, M. A. Bershady, A. L. Kinney, and D. Calzetti, 1995: Spectral Classification of Galaxies: an Orthogonal Approach. AJ, 110, 1071.
- Cox et al. (2008) Cox, T. J., P. Jonsson, R. S. Somerville, J. R. Primack, and A. Dekel, 2008: The effect of galaxy mass ratio on merger-driven starbursts. MNRAS, 384, 386–409.
- Decarli et al. (2010) Decarli, R., R. Falomo, A. Treves, M. Labita, J. K. Kotilainen, and R. Scarpa, 2010: The quasar MBH-Mhost relation through cosmic time - II. Evidence for evolution from z = 3 to the present age. MNRAS, 402, 2453–2461.
- Di Matteo et al. (2007) Di Matteo, P., F. Combes, A.-L. Melchior, and B. Semelin, 2007: Star formation efficiency in galaxy interactions and mergers: a statistical study. A&A, 468, 61–81.
- Di Matteo et al. (2005) Di Matteo, T., V. Springel, and L. Hernquist, 2005: Energy input from quasars regulates the growth and activity of black holes and their host galaxies. Nature, 433, 604–607.
- Dunlop et al. (2003) Dunlop, J. S., R. J. McLure, M. J. Kukula, S. A. Baum, C. P. O’Dea, and D. H. Hughes, 2003: Quasars, their host galaxies and their central black holes. MNRAS, 340, 1095–1135.
- Dunlop et al. (1993) Dunlop, J. S., G. L. Taylor, D. H. Hughes, and E. I. Robson, 1993: Infrared Imaging of the Host Galaxies of Radio-Loud and Radio-Quiet Quasars. MNRAS, 264, 455.
- Ferrarese and Merritt (2000) Ferrarese, L. and D. Merritt, 2000: A Fundamental Relation between Supermassive Black Holes and Their Host Galaxies. ApJ, 539, L9–L12.
- Fu and Stockton (2009) Fu, H. and A. Stockton, 2009: FR II Quasars: Infrared Properties, Star Formation Rates, and Extended Ionized Gas. ApJ, 696, 1693–1699.
- Gebhardt et al. (2000) Gebhardt, K., R. Bender, G. Bower, A. Dressler, S. M. Faber, A. V. Filippenko, R. Green, C. Grillmair, L. C. Ho, J. Kormendy, T. R. Lauer, J. Magorrian, J. Pinkney, D. Richstone, and S. Tremaine, 2000: A Relationship between Nuclear Black Hole Mass and Galaxy Velocity Dispersion. ApJ, 539, L13–L16.
- Hopkins (2012) Hopkins, P. F., 2012: Dynamical delays between starburst and AGN activity in galaxy nuclei. MNRAS, 420, L8–L12.
- Hopkins et al. (2005) Hopkins, P. F., L. Hernquist, T. J. Cox, T. Di Matteo, B. Robertson, and V. Springel, 2005: Luminosity-dependent Quasar Lifetimes: A New Interpretation of the Quasar Luminosity Function. ApJ, 630, 716–720.
- Hopkins et al. (2006a) —, 2006a: A Unified, Merger-driven Model of the Origin of Starbursts, Quasars, the Cosmic X-Ray Background, Supermassive Black Holes, and Galaxy Spheroids. ApJS, 163, 1–49.
- Hopkins et al. (2008) Hopkins, P. F., L. Hernquist, T. J. Cox, and D. Kereš, 2008: A Cosmological Framework for the Co-Evolution of Quasars, Supermassive Black Holes, and Elliptical Galaxies. I. Galaxy Mergers and Quasar Activity. ApJS, 175, 356–389.
- Hopkins et al. (2006b) Hopkins, P. F., R. S. Somerville, L. Hernquist, T. J. Cox, B. Robertson, and Y. Li, 2006b: The Relation between Quasar and Merging Galaxy Luminosity Functions and the Merger-driven Star Formation History of the Universe. ApJ, 652, 864–888.
- Hughes et al. (2000) Hughes, D. H., M. J. Kukula, J. S. Dunlop, and T. Boroson, 2000: Optical off-nuclear spectra of quasar hosts and radio galaxies. MNRAS, 316, 204–224.
- Jahnke et al. (2004) Jahnke, K., S. F. Sánchez, L. Wisotzki, M. Barden, S. V. W. Beckwith, E. F. Bell, A. Borch, J. A. R. Caldwell, B. Häussler, C. Heymans, S. Jogee, D. H. McIntosh, K. Meisenheimer, C. Y. Peng, H. Rix, R. S. Somerville, and C. Wolf, 2004: Ultraviolet Light from Young Stars in GEMS Quasar Host Galaxies at . ApJ, 614, 568–585.
- Jahnke et al. (2007) Jahnke, K., L. Wisotzki, F. Courbin, and G. Letawe, 2007: Spatial decomposition of on-nucleus spectra of quasar host galaxies. MNRAS, 378, 23–40.
- Jimenez et al. (2004) Jimenez, R., J. MacDonald, J. S. Dunlop, P. Padoan, and J. A. Peacock, 2004: Synthetic stellar populations: single stellar populations, stellar interior models and primordial protogalaxies. MNRAS, 349, 240–254.
- Kauffmann et al. (2003) Kauffmann, G., T. M. Heckman, C. Tremonti, J. Brinchmann, S. Charlot, S. D. M. White, S. E. Ridgway, J. Brinkmann, M. Fukugita, P. B. Hall, Ž. Ivezić, G. T. Richards, and D. P. Schneider, 2003: The host galaxies of active galactic nuclei. MNRAS, 346, 1055–1077.
- Kocevski et al. (2012) Kocevski, D. D., S. M. Faber, M. Mozena, A. M. Koekemoer, K. Nandra, C. Rangel, E. S. Laird, M. Brusa, S. Wuyts, J. R. Trump, D. C. Koo, R. S. Somerville, E. F. Bell, J. M. Lotz, D. M. Alexander, F. Bournaud, C. J. Conselice, T. Dahlen, A. Dekel, J. L. Donley, J. S. Dunlop, A. Finoguenov, A. Georgakakis, M. Giavalisco, Y. Guo, N. A. Grogin, N. P. Hathi, S. Juneau, J. S. Kartaltepe, R. A. Lucas, E. J. McGrath, D. H. McIntosh, B. Mobasher, A. R. Robaina, D. Rosario, A. N. Straughn, A. van der Wel, and C. Villforth, 2012: CANDELS: Constraining the AGN-Merger Connection with Host Morphologies at z ~ 2. ApJ, 744, 148.
- Letawe et al. (2007) Letawe, G., P. Magain, F. Courbin, P. Jablonka, K. Jahnke, G. Meylan, and L. Wisotzki, 2007: On-axis spectroscopy of the host galaxies of 20 optically luminous quasars at z ~ 0.3. MNRAS, 378, 83–108.
- Maraston (2005) Maraston, C., 2005: Evolutionary population synthesis: models, analysis of the ingredients and application to high-z galaxies. MNRAS, 362, 799–825.
- Massey et al. (1988) Massey, P., K. Strobel, J. V. Barnes, and E. Anderson, 1988: Spectrophotometric standards. ApJ, 328, 315–333.
- McLure et al. (1999) McLure, R. J., M. J. Kukula, J. S. Dunlop, S. A. Baum, C. P. O’Dea, and D. H. Hughes, 1999: A comparative HST imaging study of the host galaxies of radio-quiet quasars, radio-loud quasars and radio galaxies - I. MNRAS, 308, 377–404.
- Mihos and Hernquist (1996) Mihos, J. C. and L. Hernquist, 1996: Gasdynamics and Starbursts in Major Mergers. ApJ, 464, 641.
- Nolan et al. (2001) Nolan, L. A., J. S. Dunlop, M. J. Kukula, D. H. Hughes, T. Boroson, and R. Jimenez, 2001: The ages of quasar host galaxies. MNRAS, 323, 308–330.
- Oke et al. (1995) Oke, J. B., J. G. Cohen, M. Carr, J. Cromer, A. Dingizian, F. H. Harris, S. Labrecque, R. Lucinio, W. Schaal, H. Epps, and J. Miller, 1995: The Keck Low-Resolution Imaging Spectrometer. PASP, 107, 375.
- Sánchez et al. (2004) Sánchez, S. F., K. Jahnke, L. Wisotzki, D. H. McIntosh, E. F. Bell, M. Barden, S. V. W. Beckwith, A. Borch, J. A. R. Caldwell, B. Häussler, S. Jogee, K. Meisenheimer, C. Y. Peng, H. Rix, R. S. Somerville, and C. Wolf, 2004: Colors of Active Galactic Nucleus Host Galaxies at from the GEMS Survey. ApJ, 614, 586–606.
- Schlegel et al. (1998) Schlegel, D. J., D. P. Finkbeiner, and M. Davis, 1998: Maps of Dust Infrared Emission for Use in Estimation of Reddening and Cosmic Microwave Background Radiation Foregrounds. ApJ, 500, 525–+.
- Schmidt and Green (1983) Schmidt, M. and R. F. Green, 1983: Quasar evolution derived from the Palomar bright quasar survey and other complete quasar surveys. ApJ, 269, 352–374.
- Shi et al. (2007) Shi, Y., P. Ogle, G. H. Rieke, R. Antonucci, D. C. Hines, P. S. Smith, F. J. Low, J. Bouwman, and C. Willmer, 2007: Aromatic Features in AGNs: Star-forming Infrared Luminosity Function of AGN Host Galaxies. ApJ, 669, 841–861.
- Shi et al. (2009) Shi, Y., G. H. Rieke, P. Ogle, L. Jiang, and A. M. Diamond-Stanic, 2009: Cosmic Evolution of Star Formation in Type-1 Quasar Hosts Since z = 1. ApJ, 703, 1107–1122.
- Spergel et al. (2003) Spergel, D. N., L. Verde, H. V. Peiris, E. Komatsu, M. R. Nolta, C. L. Bennett, M. Halpern, G. Hinshaw, N. Jarosik, A. Kogut, M. Limon, S. S. Meyer, L. Page, G. S. Tucker, J. L. Weiland, E. Wollack, and E. L. Wright, 2003: First-Year Wilkinson Microwave Anisotropy Probe (WMAP) Observations: Determination of Cosmological Parameters. ApJS, 148, 175–194.
- Stockton and MacKenty (1987) Stockton, A. and J. W. MacKenty, 1987: Extended emission-line regions around QSOs. ApJ, 316, 584–596.
- Torrey et al. (2012) Torrey, P., T. J. Cox, L. Kewley, and L. Hernquist, 2012: The Metallicity Evolution of Interacting Galaxies. ApJ, 746, 108.
- Trager et al. (2005) Trager, S. C., G. Worthey, S. M. Faber, and A. Dressler, 2005: Hot stars in old stellar populations: a continuing need for intermediate ages. MNRAS, 362, 2–8.
- Treister et al. (2012) Treister, E., K. Schawinski, C. M. Urry, and B. D. Simmons, 2012: Major Galaxy Mergers Only Trigger the Most Luminous Active Galactic Nuclei. ApJ, 758, L39.
- Van Wassenhove et al. (2012) Van Wassenhove, S., M. Volonteri, L. Mayer, M. Dotti, J. Bellovary, and S. Callegari, 2012: Observability of Dual Active Galactic Nuclei in Merging Galaxies. ApJ, 748, L7.
- Vanden Berk et al. (2006) Vanden Berk, D. E., J. Shen, C.-W. Yip, D. P. Schneider, A. J. Connolly, R. E. Burton, S. Jester, P. B. Hall, A. S. Szalay, and J. Brinkmann, 2006: Spectral Decomposition of Broad-Line AGNs and Host Galaxies. AJ, 131, 84–99.
- Wold et al. (2010) Wold, I., A. I. Sheinis, M. J. Wolf, and E. J. Hooper, 2010: Host galaxies of luminous quasars: population synthesis of optical off-axis spectra. MNRAS, 408, 713–730.
- Young et al. (2009) Young, S., D. J. Axon, A. Robinson, and A. Capetti, 2009: The Contribution from Scattered Light to Quasar Galaxy Hosts. ApJ, 698, L121–L124.
- Zibetti et al. (2013) Zibetti, S., A. Gallazzi, S. Charlot, D. Pierini, and A. Pasquali, 2013: Near-infrared spectroscopy of post-starburst galaxies: a limited impact of TP-AGB stars on galaxy spectral energy distributions. MNRAS, 428, 1479–1497.