Experimental measurements of stress redistribution in flowing emulsions
Abstract
We study how local rearrangements alter droplet stresses within flowing dense quasi-two-dimensional emulsions at area fractions . Using microscopy, we measure droplet positions while simultaneously using their deformed shape to measure droplet stresses. We find that rearrangements alter nearby stresses in a quadrupolar pattern: stresses on neighboring droplets tend to either decrease or increase depending on location. The stress redistribution is more anisotropic with increasing . The spatial character of the stress redistribution influences where subsequent rearrangements occur. Our results provide direct quantitative support for rheological theories of dense amorphous materials that connect local rearrangements to changes in nearby stress.
pacs:
82.70.Kj, 83.80.Iz, 47.50.EfThe flow of complex materials such as emulsions, foams, and grains is the cumulative effect of many discrete particle rearrangements Mason1996 ; Mason1999 . On shorter time and length scales rearrangements result in local stress and velocity fluctuations Durian1995 ; Miller1996 ; Tewari1999 ; Dennin2004 ; Lauridsen2004 ; Chen2012 , and the size and frequency of these fluctuations are thought to relate to the macroscopic response of the material Picard2005 ; Kabla2007 ; Kabla2003 , but a complete connection is yet unclear.
Simulations showed that particle rearrangements are initiated by a build up of local inter-particle stresses that become unstable. Particles rearrange and change the forces they exert on neighboring particles, leading to an anisotropic redistribution of stress over a few particle diameters Kabla2003 ; Picard2004 ; Picard2005 ; Kabla2007 . This redistribution is of significant interest because it can increase the tendency for neighboring particles to undergo a rearrangement Goyon2008 ; Picard2005 ; Kabla2007 . This can lead to avalanches, where one rearrangement alters the stress nearby and triggers a series of other rearrangement Debregeas2001 ; Pouliquen2009 ; Kamrin2012 ; Kabla2007 . Common models of the flow of complex materials, like the Herschel-Bulkley equation, only consider the spatial gradient in stress and strain rate between infinitesimal adjacent layers of fluid sliding past each other Goyon2008 ; bocquet09 ; Becu2006 . However, if a rearrangement can alter the stress farther away and trigger other rearrangements, then the stress and strain rate couple to fluid layers that extend far beyond the adjacent layers, requiring a more complex treatment to properly model the flow. Some theories assume forms for the stress redistribution to account for the non-local effects, for example, the fluidity models for emulsions Goyon2008 ; bocquet09 and grains Pouliquen2009 ; Kamrin2012 .
To properly model the flow of these complex materials, the nature of the stress redistribution must be known. Specifically, (1) what is the magnitude of the stress redistribution, (2) how far does it extend, and (3) how asymmetric is it? These questions have been experimentally difficult to probe because of the necessity to simultaneously image individual particles while measuring the forces between them. For this reason, most prior experiments were limited to tracking particle positions without knowledge of the stresses Miller1996 ; Tewari1999 ; Dennin2004 ; Lauridsen2004 ; chen10 ; besseling09 ; dijksman12 . In this Letter, we present experiments studying the flow of quasi-two-dimensional emulsion droplets. In our experiment we are able to simultaneously observe both positions and inter-droplet forces Chen2012 ; Desmond2013 , allowing us to directly measure rearrangements and stress redistribution. We confirm that stress redistribution occurs in a quadrupolar fashion close to what is predicted Picard2004 ; Kabla2003 .
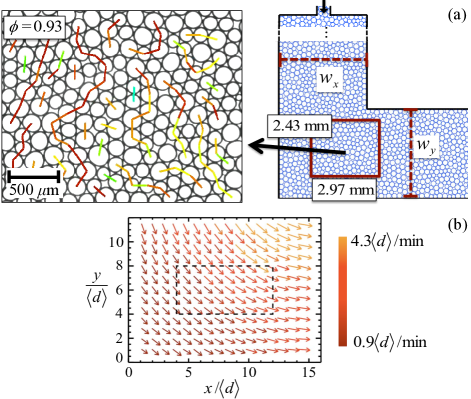
In our experiments, we confine bidisperse emulsions (mineral oil in water) between two glass slides of dimensions 25 mm 75 mm separated by m spacer (transparency film). We produce our droplets using a standard micro-fluidic technique Shan04 and stabilize them from coalescence with Fairy soap Desmond2013 . Their diameters are larger than the sample chamber gap distance so that the system is quasi-2D. A schematic of our chamber is shown in Fig. 1(a) which consists of two channels of widths that meet at a right angle. A syringe pump injects the emulsion into the chamber, far upstream from the imaged region, as indicated in Fig. 1. In the corner the dropets change direction, resulting in many rearrangements. We take a total of 13 data sets at different area fractions ranging between 0.88 - 0.96 and at 4 different strain rates (see Table 1 for experimental details). We record images with a CCD camera at 2 images/s. After the experiment, we post-process the images to identify and track the droplets Desmond2013 ; crocker96 .
In Fig. 1, we show a typical flow field in the region where the two channels meet, corresponding to where we take all our data. Droplets flow faster near the upper right corner and are progressively slower with distance away from the corner. This velocity gradient induces droplet rearrangements. The gradient is non-uniform giving a strain rate that depends on space, although locally it varies by no more than a factor of across the field of view for all our experiments. The results we will present do not vary with the local strain rate for the strain rates we consider. Accordingly, from the droplet trajectories we determine the global (mean) strain rate within the region of our observations and report this as for each data set presented in Table 1, similar to the procedure in Ref. chen10 .
| # exp. | |||||||
|---|---|---|---|---|---|---|---|
| [mm] | [mm] | [mm] | [mm] | ||||
| 7 | 1.3 | 0.95 | 0.090 | 0.118 | 6.0 | 6.2 | 2.4 |
| 1 | 1.3 | 0.95 | 0.090 | 0.118 | 6.0 | 6.2 | 1.3 |
| 3 | 1.3 | 0.67 | 0.85 | 0.110 | 3.8 | 3.8 | 5.5 |
| 2 | 1.3 | 0.67 | 0.85 | 0.110 | 3.8 | 3.8 | 2.7 |
| 0.02 | 0.05 | 5% | 5% | 0.1 | 0.1 | 10% |
In addition to tracking the motion of droplets, we determine the repulsive contact force between droplets and in contact. This is done by relating the deformation of each droplet’s perimeter to the force using the method of Desmond et al. Desmond2013 . Conceptually, the quasi-2D droplets prefer to have circular outlines due to surface tension, and their deformation away from circular relates to the forces they feel. We use our previously developed calibration technique to determine the forces to 15% uncertainty Desmond2013 . In Fig. 1, we show some of the larger forces between droplets. We also determine the viscous droplet-droplet and droplet-glass forces (see Ref. Desmond2012 for details). The largest viscous droplet-droplet forces are less than 1% of the mean repulsive force, and the largest viscous droplet-glass forces are less than 4% of the mean repulsive force. Since the viscous forces are small, we ignore their contribution to the stress.
Using the repulsive contact forces, the stress tensor on each droplet at any time can be computed using
| (1) |
where is a vector from the center of droplet to the center of contact , is an outer product, and is the Voronoi area around droplet Cruz2005 ; Allen89 . The off-diagonal term of this tensor is the shear stress, which depends on the orientation of the coordinate system. We rotate the coordinate system to maximize the time- and droplet-averaged off-diagonal term of the stress tensor; this rotation is . In this rotated coordinate system, we use the instantaneous maximal off-diagonal element as the instantaneous shear stress on each droplet.
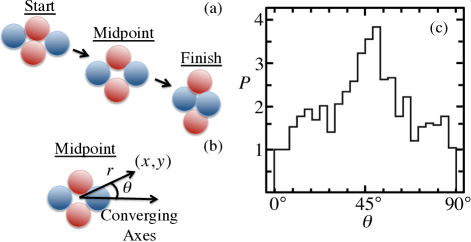
In 2D systems, the simplest topological rearrangements involve neighbor exchanges of four droplets Lundberg08 , known as a T1 event. This exchange is shown in Fig. 2(a): two neighboring droplets become next-nearest neighbors while two next-nearest neighbors become neighbors. To uniquely define the start and end of a T1 event, we only consider T1 events that lead to a stress relaxation on the four rearranging droplets, and define the start as the point in time where the stress is maximal before the neighbor exchange and the end as the minimum in stress after the neighbor exchange. Between the start and the end of the T1 event the stress decreases by , which not surprisingly varies between rearrangements.
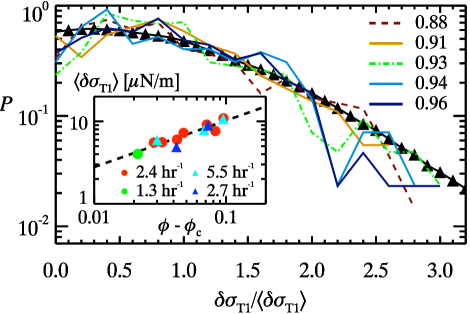
To examine the variability of , we show the probability distributions of as the curves in Fig. 3. These distributions have a Gaussian-like shape and peak near . After normalizing by the mean stress drop , all distributions overlap well regardless of and . This suggests that in the quasistatic limit, fluctuations in local stress due to structural relaxation follow a universal distribution, although we cannot rule out subtle differences that might be below our resolution. Intriguingly, the distributions look similar to the distribution of the instantaneous individual droplet stresses ), plotted as triangles in Fig. 3 (at a representative area fraction ; the shape does not vary significantly at different ). This seems sensible, suggesting that the size of the stress drops correlates with the size of the stresses present in the system.
While the variation in about the mean is independent of the area fraction, the mean stress drop is not. In the inset of Fig. 3, we show that increases with area fraction relative to the jamming point , where was measured in Ref. Desmond2013 . The data for different strain rates overlap, as we are in the quasi-static regime. We fit the data using with , similar to scaling behavior found for the shear modulus, pressure, and coordination number Durian1995 ; Durian1997 .
Thus far we focused on the stress drop averaged over the four droplets defining the T1 event. We next examine how the T1 event redistributes stress on the rest of the sample. To do this, we define a coordinate system for each T1 event, as shown in Fig. 2(b), using the converging direction of droplets as the -axis and the diverging direction as the -axis. Here or measure locations relative to the center of the T1 event.
The stress redistribution around a T1 event can be characterized by a stress propagator , defined as , where is the change in stress on a droplet located a distance away from the center of the T1 event that has a particular stress drop of size . Given a stress fluctuation on the rearranging droplets, quantifies the mean size of the stress fluctuation at . Recall, measures the amount the stress has decreased, and thus, when is positive the stress at decreased. Here we will focus on the stress propagator averaged over 200-400 T1 events (we ignore the angular brackets in our notation).
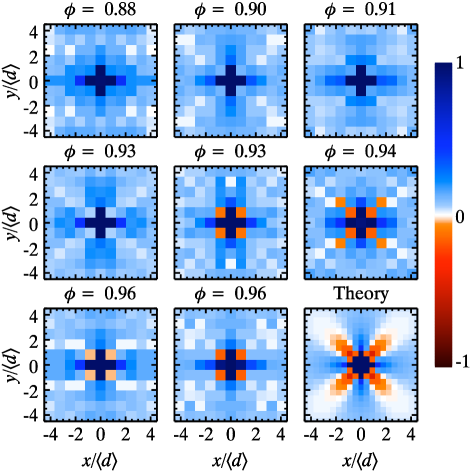
In Fig. 4, we show the measured stress propagator for a range of area fractions. To improve statistics, we impose four fold symmetry on . (Prior to imposing symmetry, the raw data have four fold symmetry within the statistical noise limit.) The data in Fig. 4 show that the stress can decrease (positive , blue) or increase (negative , orange) on nearby droplets depending on their relative position to the T1 event. Along the converging and diverging axes we find that for all the stress decreases on droplets near the rearrangement, although along the directions to the converging and diverging directions, the stress change depends on . At low area fractions, the stress propagators show that a rearrangement tends to decrease the stress on all nearby droplets, while at larger area fractions, droplets along the diagonal directions tend to have their stress increased.
Picard et al. Picard2004 model a T1 event as a localized region of size set by the mean droplet diameter undergoing pure shear within a continuous elastic material. They predict a quadrupolar field for the stress propagator obeying , shown in the bottom right panel of Fig. 4. Along the converging and diverging directions, the stress on neighboring droplets decreases, while the stress on the nearby droplets at 45∘ to the converging direction increases. In simulations on dry foams (), Kabla et al. Kabla2003 observed a qualitatively similar quadrupolar field in the stress propagator.
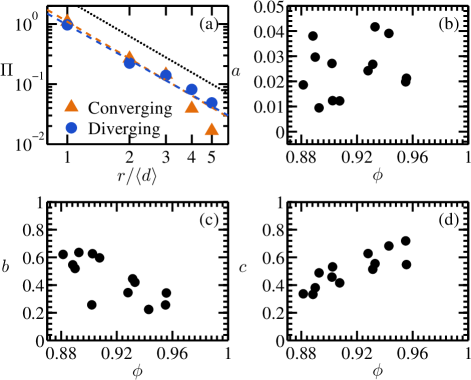
We first test Picard et al.’s prediction of a scaling by looking at the decay in along the converging and diverging directions. An example is given in Fig. 5(a). The data are consistent with decay, indicated by the dotted line. Next we look at the anisotropy of the stress propagator. Qualitatively, we find that as the area fraction approaches unity, the experimentally measured stress propagator appears to approach a quadrupolar field. However, at lower area fractions the stress propagator appears more isotropic. To quantify this, we add onto the prediction of Picard et al. two isotropic terms, and fit the raw data (without imposing 4-fold symmetry) to , with fit parameters , , and . This is an empirical fit that works well for all our data; we do not rule out the possibility of other forms for .
The fitting parameters are shown in Fig. 5(b) - (d). The monopole term is slightly positive with no trend in . shows that the global (space-averaged) stress tends to decrease during a T1 event, supporting the idea that rearrangements are a mechanism to relax the global stress. Qualitatively, this is seen in the overall “blue” colors of the panels in Fig. 4. Examining the other fitting parameters, we find that (the isotropic term) decreases with , while (the quadrupolar anisotropic term) increases with . These trends indicate a transition from an anisotropic stress relaxation to an isotropic one as the jamming area fraction () is approached from above. Simulations have shown Ellenbroek2006 , that with increasing above , the response of grains to a localized force is more affine (elastic-like). It is reasonable that the prediction of Picard et al. works well for samples in the limit , since these cases are closer to their assumption of a continuous elastic material.
The above analysis shows that along the converging and diverging axes the stress drops significantly, while droplets located from the converging axis show either a slight decrease or a large increase in stress. One would expect subsequent rearrangements to be more likely where the stress has increased, and this is what we find. We measure the location of the next T1 event in the same coordinate system used to compute . In Fig. 2(c), we plot the probability to find the next event at angle relative to the previous. ( overlaps well for all the data sets, so to improve the statistics we use the average of all the data.) The peak near confirms that events are biased to occur along the directions where the stress typically increases during a T1 event.
Our experiments demonstrate that simple rearrangement events (T1 events) relax the stress on neighboring droplets. At higher area fractions, we observe that this stress relaxation has a quadrupolar character, confirming theoretical predictions Picard2004 . One implication is that T1 events increase the stress felt by nearby droplets along certain directions, and subsequent T1 events are more likely to occur in those regions with increased stress. Our observations provide direct evidence that on a droplet scale, flow is spatially heterogeneous with a connection between rearrangements in one location and stresses felt in other locations. While the spatially heterogeneous nature of rearrangements in amorphous materials has been well-established by prior work Miller1996 ; Tewari1999 ; Dennin2004 ; Lauridsen2004 ; chen10 ; besseling09 ; dijksman12 , this is the first quantitative experimental link connecting such rearrangements to the internal stresses, as expected by a variety of theories of rheology of complex fluids Picard2005 ; Kabla2007 ; Kabla2003 ; Picard2004 ; Goyon2008 ; Debregeas2001 ; Pouliquen2009 ; Kamrin2012 ; bocquet09 .
This work was supported by the National Science Foundation (grant CBET-0853837).
References
- (1) T. Mason, J. Colloid Interface Sci. 179, 439 (1996)
- (2) T. G. Mason, Curr. Opin. Colloid Interface Sci. 4, 231 (Jun. 1999)
- (3) D. J. Durian, Phys. Rev. Lett. 75, 4780 (1995)
- (4) B. Miller, C. O’Hern, and R. P. Behringer, Phys. Rev. Lett. 77, 3110 (1996)
- (5) S. Tewari, D. Schiemann, D. J. Durian, C. M. Knobler, S. A. Langer, and A. J. Liu, Phys. Rev. E 60, 4385 (1999)
- (6) M. Dennin, Phys. Rev. E 70, 041406 (2004)
- (7) J. Lauridsen, G. Chanan, and M. Dennin, Phys. Rev. Lett. 93, 018303 (2004)
- (8) D. Chen, K. W. Desmond, and E. R. Weeks, Soft Matter 8, 10486 (2012)
- (9) G. Picard, A. Ajdari, F. Lequeux, and L. Bocquet, Phys. Rev. E 71, 010501 (2005)
- (10) A. Kabla, J. Scheibert, and G. Debregeas, J. Fluid Mech. 587, 45 (2007)
- (11) A. Kabla and G. Debrégeas, Phys. Rev. Lett. 90, 258303 (2003)
- (12) G. Picard, A. Ajdari, F. Lequeux, and L. Bocquet, Eur. Phys. J. E 15, 371 (2004)
- (13) J. Goyon, A. Colin, G. Ovarlez, A. Ajdari, and L. Bocquet, Nature 454, 84 (2008)
- (14) G. Debrégeas, H. Tabuteau, and J. M. di Meglio, Phys. Rev. Lett. 87, 178305 (2001)
- (15) O. Pouliquen and Y. Forterre, Philos. T. R. Soc. A 367, 5091 (2009)
- (16) K. Kamrin and G. Koval, Phys. Rev. Lett. 108, 178301 (Apr. 2012)
- (17) L. Bocquet, A. Colin, and A. Ajdari, Phys. Rev. Lett. 103, 036001 (2009)
- (18) L. Bécu, S. Manneville, and A. Colin, Phys. Rev. Lett. 96, 138302 (Apr. 2006)
- (19) D. Chen, D. Semwogerere, J. Sato, V. Breedveld, and E. R. Weeks, Phys. Rev. E 81, 011403 (2010)
- (20) R. Besseling, L. Isa, E. R. Weeks, and W. C. K. Poon, Adv. Colloid Interfac. 146, 1 (2009)
- (21) J. A. Dijksman, F. Rietz, K. A. Lőrincz, M. van Hecke, and W. Losert, Rev. of Sci. Instrum. 83, 011301 (2012)
- (22) K. W. Desmond, P. J. Young, D. Chen, and E. R. Weeks, Soft Matter 9, 3424 (2013)
- (23) R. Shah, H. Shum, A. Rowat, D. Lee, J. Agresti, A. Utada, L. Chu, J. Kim, A. Fernandez-Nieves, and C. Martinez, Materials Today 11, 18 (2008)
- (24) J. C. Crocker and D. G. Grier, J. Colloid Interface Sci. 179, 298 (1996)
- (25) K. W. Desmond, Structure, Dynamics, and Forces of Jammed Systems, Ph.D. thesis, Emory University (2012)
- (26) F. da Cruz, S. Emam, M. Prochnow, J. N. Roux, and F. Chevoir, Phys. Rev. E 72, 021309 (2005)
- (27) M. P. Allen and D. J. Tildesley, Computer Simulation of Liquids (Oxford University Press, USA, 1989)
- (28) M. Lundberg, K. Krishan, N. Xu, C. S. O’Hern, and M. Dennin, Phys. Rev. E 77, 041505 (2008)
- (29) D. J. Durian, Phys. Rev. E 55, 1739 (1997)
- (30) W. G. Ellenbroek, E. Somfai, M. van Hecke, and W. van Saarloos, Phys. Rev. Lett. 97, 258001 (2006)