Zooming towards the Event Horizon - mm-VLBI today and tomorrow
Abstract:
Global VLBI imaging at millimeter and sub-millimeter wavelength overcomes the opacity barrier of synchrotron self-absorption in AGN and opens the direct view into sub-pc scale regions not accessible before. Since AGN variability is more pronounced at short millimeter wavelength, mm-VLBI can reveal structural changes in very early stages after outbursts. When combined with observations at longer wavelength, global 3 mm and 1 mm VLBI adds very detailed information on the source structure. This helps to determine fundamental physical properties at the jet base, and in the vicinity of super-massive black holes at the center of AGN. Here we present new results from multi-frequency mm-VLBI imaging of OJ 287 during a major outburst. We also report on a successful 1.3 mm VLBI experiment with the APEX telescope in Chile. This observation sets a new world record in angular resolution. It also opens the path towards future mm-VLBI with ALMA, which aims at the mapping of the black hole event horizon in nearby galaxies, and the study of the roots of jets in AGN.
1 Introduction
In Active Galactic Nuclei (AGN) the energy extraction from black holes (BH) and the detailed understanding of jet formation and jet acceleration are still poorly understood. It is therefore desirable to observe galaxies with black holes and their emanating jets with an as high as possible angular and spatial resolution. For nearby super massive black holes, such as the BH in the Galactic Center (D kpc) and in M 87 (Virgo A, D Mpc) ground-based VLBI at mm ( GHz) provides an observing beam well matched to the expected size of the event horizon - and by this to the size of the observable emission region around such black holes. For the more distant quasars (and other AGN) a spatial resolution of several 10-1000 gravitational radii is obtained. Two fundamentally different types of jet formation models are often discussed: (i) in Blandford-Payne (BP) type models the particle acceleration is done via a magnetic sling-shot mechanism with field lines anchored in the rotating accretion disk collimating and accelerating a disk wind. (ii) In Blandford-Znajek (BZ) type models the energy extraction is purely electromagnetic and is directly coupled to the spin of the black hole. As a consequence of this, the diameter and morphology of the jet base (i.e. at radii where the jet emission becomes observable) may be different for BP- and BZ-type jet launching, in the sense that BZ-jets may appear more narrow and compact. VLBI imaging with ten micro-arcsecond scale resolution can help to discriminate between these models and constrain the parameter space for the theoretical modeling.
2 Global VLBI at 3 mm wavelength
Global 3 mm VLBI imaging at 86 GHz is performed with the stand-alone VLBA (8 antennas equipped with 3 mm receivers, no receiver at HN and SC) and with the Global Millimeter VLBI Array (GMVA). The GMVA combines the big European antennas (100 m Effelsberg, 30 m IRAM Pico Veleta, (6x15) m IRAM Plateau de Bure, 40 m Yebes, 20 m Onsala, 14 m Metsähovi) with the VLBA. While the VLBA could observe more frequently, the GMVA is about 3 times more sensitive and offers also a much higher resolution than the VLBA (up to 40 as). A brief description of the present status of the GMVA and new results are presented by J. Hodgson et al., in this conference [5] (and references therein).
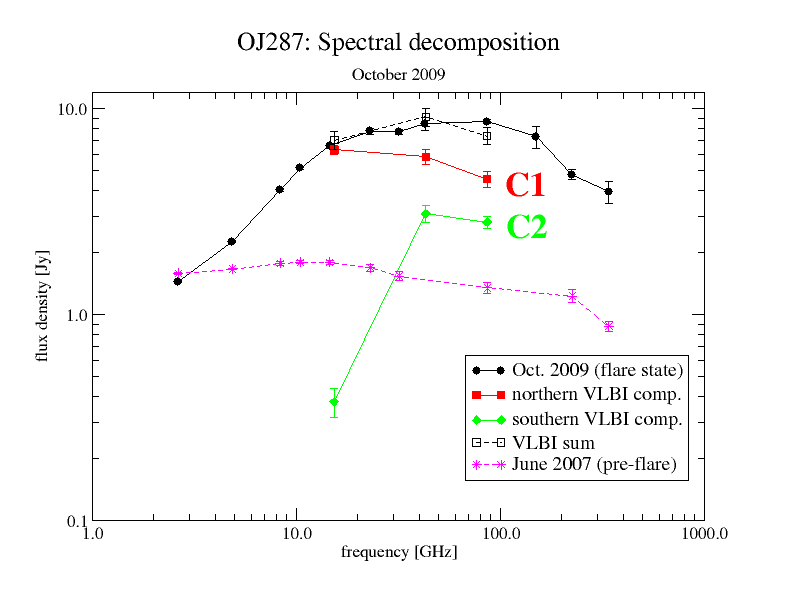
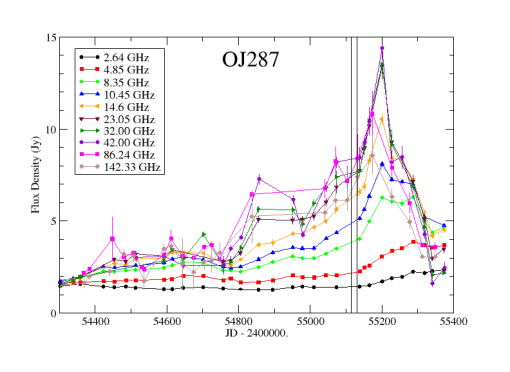
VLBI imaging with the highest possible angular (and spatial) resolution can shed light on the physical processes acting within the centers of blazars, in regions where jets are forming and gamma-rays are produced. As an example we show in Figure 1 three VLBI maps of the prominent blazar OJ 287 observed in October 2009 at 15 & 43 GHz with the VLBA, and at 86 GHz with the GMVA. At the lower frequencies, OJ 287 shows a bent core-jet structure, with a prominent and unresolved core and some faint jet-emission extending west to mas. At 86 GHz, however, the core regions breaks up into two bright sub-components (C1 & C2), which interestingly are oriented along a line almost perpendicular to the direction of the mas-scale jet. If interpreted by a spatially bent jet, one would expect that the northern most component (C1) to be the VLBI core, which is the unresolved base of a synchrotron self-absorbed jet. In Figure 2 (left) we show the 43 GHz and 86 GHz maps convolved with a circular beam of 0.1 mas in size (factor super-resolution at 43 GHz). The two components seen at 86 GHz, now are also clearly visible at 43 GHz. In October 2009, OJ 287 was in the rising phase of a prominent radio-flare (peak: Jan. 2010), which followed a strong gamma-ray flare (peak: October 24, 2009, see [2]). In Figure 3 we show the radio light-curves from the F-GAMMA program [3], from which we determine two radio spectra, one near the onset of the flare and one for October 2009 (see Figure 2, right panel). To this figure we have added the spectra of the VLBI components C1 and C2, with their flux densities determined from Gaussian model fits. The spectrum of the fainter southern VLBI component C2 is more inverted and peaks at a much higher frequency than C1, suggesting that C2 could be the VLBI core and not C1. In view of the orientation of the pc-scale jet, this however would require some extreme geometry. An alternative interpretation could be that C2 is a very compact and highly magnetized shock which is evolving. The continued mm-VLBI monitoring should clarify, if we see a moving or a stationary feature and if there is a relation with the gamma-ray activity observed at this date.
3 Global VLBI at 1 mm wavelength
The development of 1 mm VLBI started in the the early 1990’s and first transatlantic fringes were detected in 2002/2003 on a 8400 km long baseline between the IRAM 30 m telescope (Pico Veleta, Spain) and the 10 m SMT (Mt. Graham, AZ, USA) (see: [6] and references therein). Recent progress in the development of digital VLBI recording systems has led to larger observing bandwidth (& data rates) and higher sensitivities. The VLBI detection of ultra-compact emission regions in Sgr A* and M 87 at 230 GHz and with telescopes in the USA (SMTO, SMA, CARMA) is another important step towards global mm-/sub-mm VLBI, which aims at the as scale imaging of the event horizon in nearby black holes ([4], Event Horizon Telescope: EHT).
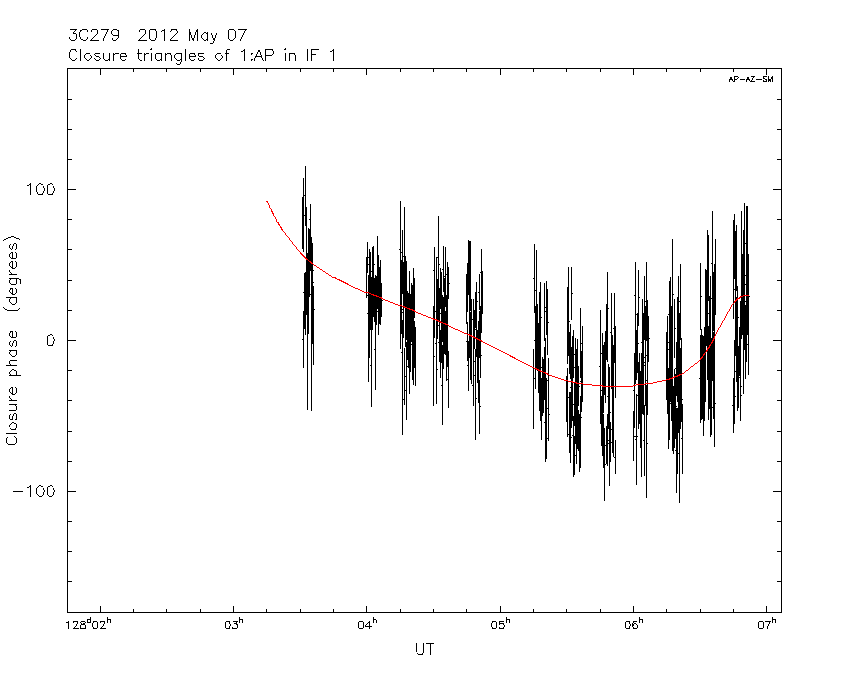
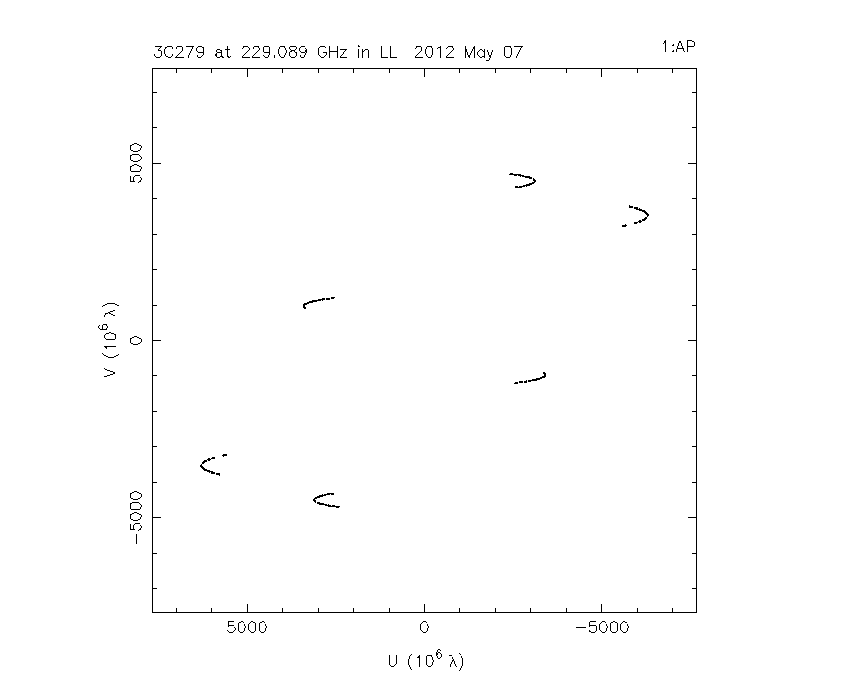
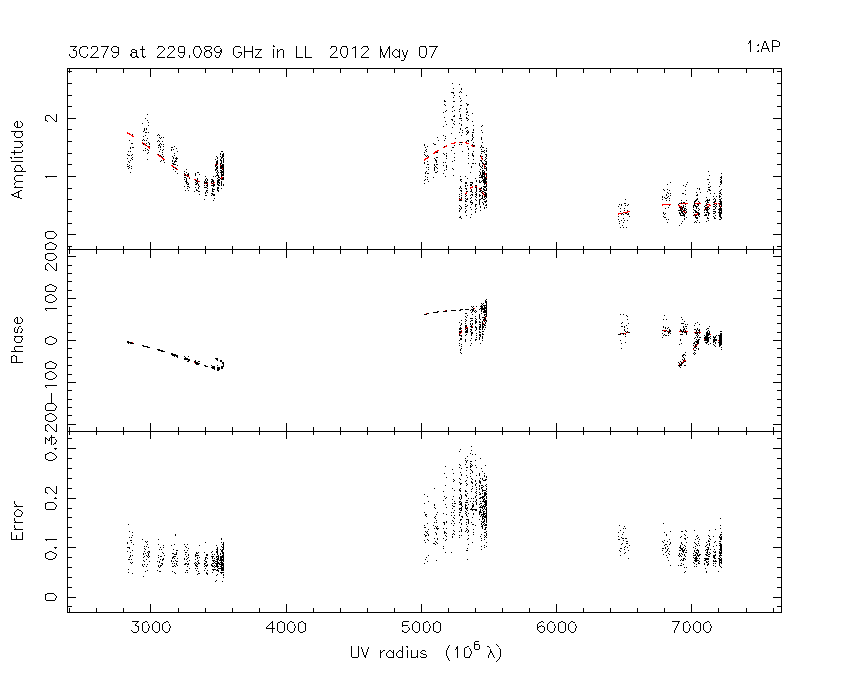
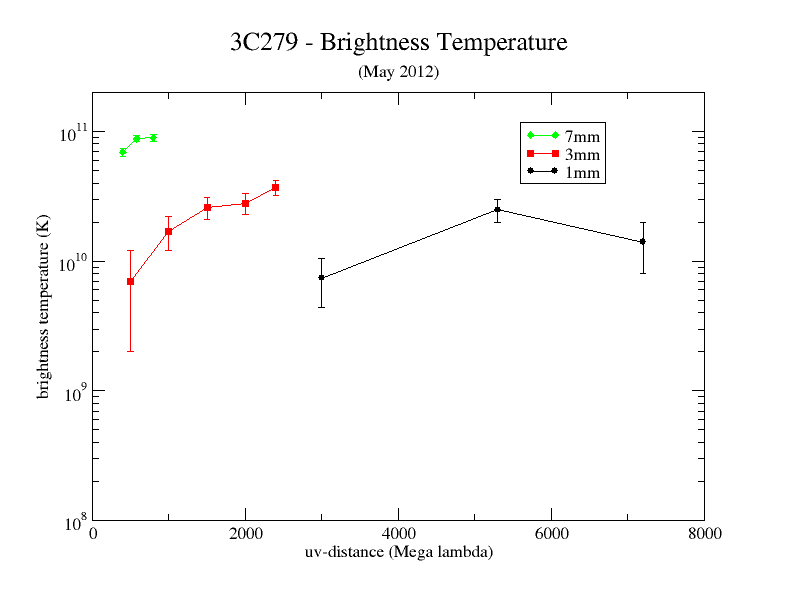
In this context we begun in 2009 the planning, and in 2010 the outfit of the 12 m APEX telescope in Chile (Llano de Chajnantor, 5105 m) for VLBI. In addition to the science case (see the Whitepaper [7]) our second motivation was the idea that APEX can serve as pathfinder for future mm-VLBI with ALMA. It took 2 years of work and one unsuccessful VLBI-test (in spring 2011), before we could claim the detection of first fringes with the APEX telescope. The setup and the observing details are presented in the talk by A. Roy et al. (this conference [8]), and [9]). On May 7, 2012 the bright quasar 3C 279 (S = 19.8 Jy) was observed with APEX and the SMTO (Arizona) in circular polarization and with the phased SMA (Hawaii) in linear polarization at a recording rate of 2 GBit/s. On the baselines to APEX, fringes were detected with a typical SNR and on the SMTO-SMA baseline the source was seen with SNR . The detection of 3C 279 on the 7.22G long VLBI baseline between Chile and Hawaii forms a new world-record in angular resolution (28.6 as) and demonstrates the feasibility of 1.3 mm VLBI even on the longest baselines. The amplitude calibration of the visibilities took into account all known effects and resulted in the visibilities shown in Fig. 4 (see [9] for details). In Fig. 5 we show a preliminary 1 mm VLBI map of 4 circular Gaussian components, which fit the visibilities and closure phases reasonably well111Linear polarization at SMA may affect the closure phase if 3C 279 is highly polarized or antenna D-terms are large. (). Owing to the sparse uv-coverage and the residual calibration uncertainty, this model is not unambiguous and should be regarded with some care. A robust statement however seems to be, that 3C 279 appears elongated in North-South direction on the 0.1 mas scale. A similar elongation is also seen in a 3 mm VLBI image obtained with the GMVA only 10 days later (Fig. 6, left panel). In the imaging process we were puzzled about a relatively low correlated flux at 230 GHz of Jy at G and Jy at G (see Fig. 5, right panel). In Fig.6 (right panel) we therefore plot the brightness temperature for a few typical uv-distances. We also have added near-in time VLBI data at 86 GHz (GMVA) and 43 GHz (VLBA). It can be seen that the brightness temperatures at 86 GHz and 230 GHz are very similar, but about a factor of lower than at 43 GHz. A jet brightness temperature which is decreasing with increasing frequency could indicate intrinsic jet acceleration or a decrease of the jet Doppler-factor towards the black hole.

4 Future Perspective
The obvious next steps for improving the capabilities of mm-VLBI are the addition of more sensitive telescopes and the further enhancement of array sensitivities. Since at mm-wavelengths weather is a limiting factor, triggered VLBI observations in pre-allocated longer time blocks are very feasible and require only moderate logistical efforts at the individual stations. The addition of the phased ALMA, equivalent to a m dish, to the existing VLBI arrays (at GHz) will lower the detection limits for mm-VLBI by up to 2 orders of magnitude (see [1] for the ALMA Phasing Project (APP)). Global mm-VLBI with ALMA however will be only possible, if in parallel to the ongoing technical development also a strong scientific user community not only obtains interesting results using the existing mm-VLBI arrays, but also actively pushes ALMA to this new frontier.
References
- [1] W. Alef, et al., 2013, An ALMA beamformer for ultra high resolution VLBI and phased array science, in proceedings of 11th EVN Symposium, \posPoS(11th EVN Symposium)053.
- [2] I. Agudo, et al., 2011, Location of -ray Flare Emission in the Jet of the BL Lacertae Object OJ287 more than 14 pc from the Central Engine, ApJ 726, 13.
- [3] L. Fuhrmann, et al., 2007, The First GLAST Symposium, AIPC, 921, 249 (arXiv:0704.3944).
- [4] V. Fish, et al., 2013, New results from the Event Horizon Telescope, in proceedings of 11th EVN Symposium, \posPoS(11th EVN Symposium)056.
- [5] J. Hodgson, et al., 2013, The latest results from the global mm VLBI array, in proceedings of 11th EVN Symposium, \posPoS(11th EVN Symposium)096.
- [6] T.P. Krichbaum, et al., 2008, Towards mm-VLBI, in proceedings of 9th EVN Symposium, \posPoS(IX EVN Symposium)001.
- [7] T.P. Krichbaum, et al., 2010, ”Imaging Super Massive Black Holes and the Origin of Jets - Global mm- and sub-mm VLBI Studies of Compact Radio Sources”, A Whitepaper and Proposal for submm-VLBI with APEX and ALMA, MPIfR, Bonn (download pdf).
- [8] A. Roy, et al., 2013, VLBI at APEX: first fringes, in proceedings of 11th EVN Symposium, \posPoS(11th EVN Symposium)057.
- [9] J. Wagner, et al., 2013, in preparation.