1 Hz Flaring in the Accreting Millisecond Pulsar NGC 6440 X-2: Disk Trapping and Accretion Cycles
Abstract
The dynamics of the plasma in the inner regions of an accretion disk around accreting millisecond X-ray pulsars is controlled by the magnetic field of the neutron star. The interaction between an accretion disk and a strong magnetic field is not well-understood, particularly at low accretion rates (the so-called “propeller regime”). This is due in part to the lack of clear observational diagnostics to constrain the physics of the disk-field interaction. Here we associate the strong Hz modulation seen in the accreting millisecond X-ray pulsar NGC 6440 X-2 with an instability that arises when the inner edge of the accretion disk is close to the corotation radius (where the stellar rotation rate matches the Keplerian speed in the disk). A similar modulation has previously been observed in another accreting millisecond X-ray pulsar (SAX J1808.4–3658) and we suggest that the two phenomena are related and that this may be a common phenomenon among other magnetized systems. Detailed comparisons with theoretical models suggest that when the instability is observed, the interaction region between the disk and the field is very narrow – of the order of 1 km. Modeling further suggests that there is a transition region ( km) around the corotation radius where the disk-field torque changes sign from spin up to spin down. This is the first time that a direct observational constraint has been placed on the width of the disk-magnetosphere interaction region, in the frame of the trapped-disk instability model.
Subject headings:
X-rays: binaries — pulsars: individual (NGC 6440 X-2),
1. Introduction
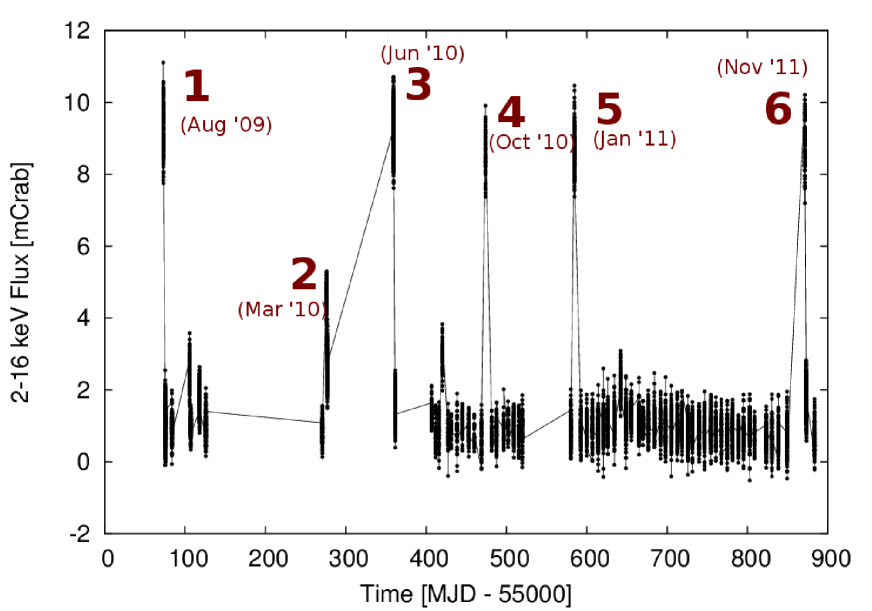
The serendipitous discovery of the accreting millisecond X-ray pulsar (AMXP) NGC 6440 X-2 has presented new challenges to our understanding of magnetospheric accretion. This source was discovered in 2009, and is, on average, the faintest known AMXP (Altamirano et al., 2010). The neutron star spins at 206 Hz and orbits around its white dwarf companion in about 1 hr(Altamirano et al., 2010). Between 2009 and 2011 it underwent 10 outbursts, all of which were unusually short (2-3 days) with a very short recurrence time ( month; Heinke et al. 2010) and peak luminosities of about . Subsequent time-series analysis revealed a strong modulation at 1 Hz during an outburst (Patruno et al., 2010). This modulation is similar to that observed in SAX J1808.4–3658 in the decay tail of a number of outbursts (van der Klis et al. 2000; Patruno et al. 2009a).
Both sources show the modulation at moderately low luminosities, around what is known as the “propeller regime”. Accretion disks surrounding strong stellar magnetic fields are disrupted close to the star, where the field is strong enough to control the gas dynamics. The location where the disk ends is usually termed the magnetospheric radius (). If the star is spinning rapidly or the accretion rate is sufficiently low, the magnetospheric radius will lie outside the corotation radius, the point at which the Keplerian disk rotates at the same rate as the star
| (1) |
The rapidly-spinning magnetic field then acts as a centrifugal barrier that inhibits accretion onto the star. It is usually assumed that the gas in the disk will then be expelled from the system, much like a propeller (Illarionov & Sunyaev, 1975).
Recent new work, however, has suggested this picture is incomplete. Spruit & Taam (1993) and Rappaport et al. (2004) noted that in order for a large amount of mass to be expelled from the system the inner edge of the disk must be (at minimum) substantially outside the corotation radius. If not, the interaction between the magnetic field and disk will prevent gas from accreting but not inject enough energy to expel it from the disk. Furthermore, the coupling between the magnetic field and disk will transfer angular momentum from the star to the disk, which will both spin down the star and change the radial gas density distribution in the inner disk region. This disk solution, known as a “dead disk”, was first described by Siuniaev & Shakura 1977, but has been little-examined since then.
When a dead disk forms in the inner disk regions, D’Angelo & Spruit (2010, 2012) demonstrated that continued accretion from large radii will often drive an accretion instability. The instability sets in when the inner edge of the disk moves outside , halting accretion onto the star. As gas continues to accumulate from the outer regions of the disk, the inner edge of the disk gradually overcomes the centrifugal barrier created by the magnetic field and eventually crosses . Once the disk inner edge has moved inside , the accumulated reservoir of gas is depleted and the inner edge again moves outside , allowing a new cycle to begin.
Building on earlier work by Spruit & Taam (1993) (which did not incorporate the dead disk solution), D’Angelo & Spruit (2010, 2012) studied this instability extensively, demonstrating that it in fact exists in two different accretion regimes, one at very low accretion rates, and one at higher fluxes compatible to those observed in some AMXPs at the onset of the propeller stage.
The dead disk model also makes a radically different prediction for disks in quiescence from the standard one. In the conventional model, the inner edge of the disk is a straightforward function of accretion rate , moving outwards as decreases. In contrast, the dead disk model predicts that even at very low accretion rates the inner edge of the disk will not move far outside , and a significant amount of gas will remain in the inner disk region even when . D’Angelo & Spruit (2011) demonstrated that in this case a ‘trapped disk’ can develop, in which the disk inner edge stays trapped close to and acts as an efficient sink for angular momentum, spinning down the accretor considerably. This disk solution will also likely alter the duration of individual outbursts, which in the ionization disk instability model ( see e.g. Lasota 2001 for a review), is affected by both the surface density in the inner disk regions and the feedback of radiation from accretion onto the central object back onto the disk.
In this paper we present an analysis of the unusual outburst behaviour seen in NGC 6440 X-2 and the 1 Hz modulation and argue that both are manifestations of an unstable dead disk, following the model of D’Angelo & Spruit (2010). Using data from the Rossi X-ray Timing Explorer (RXTE) we identify the 1 Hz modulations in six different outbursts and we study its spectral and timing properties, demonstrating that these are consistent with coming from accretion rate modulation onto the neutron star. We propose that the 1 Hz modulations seen in NGC 6440 X-2 and SAX J1808.4–3658 have the same origin and are a new and unique diagnostic to study the disk-magnetosphere interaction.
2. X-Ray Observations
| Outburst Start | 1 Hz mod. | Instrument | (Obs-Id) |
|---|---|---|---|
| 04-Jun-2009 | NA | Swift/XRT | 31421001 |
| 30-Jul-2009 | NA | RXTE/PCA | Bulge-Scan |
| 30-Aug-2009 | Y | RXTE/PCA | 94044-04-02-00 |
| 01-Oct-2009 | NA | RXTE/PCA | Bulge-Scan |
| 28-Oct-2009 | NA | RXTE/PCA | Bulge-Scan |
| 21-Mar-2010 | Y | RXTE/PCA | 94315-01-12-00; |
| 94315-01-12-02 | |||
| 12-Jun-2010 | Y | RXTE/PCA | 94315-01-14-00 |
| 04-Oct-2010 | Y | RXTE/PCA | 94315-01-25-00 |
| 23-Jan-2011 | Y | RXTE/PCA | 96326-01-02-00 |
| 06-Nov-2011 | Y | RXTE/PCA | 96326-01-35-00 |
Note. — The outbursts discussed in this paper are highlighted in bold text.
We used all pointed RXTE observations recorded with the Proportional Counter Array (PCA; Jahoda et al. 2006) that cover a time range from August 30, 2009 (MJD 55073) to November 18, 2011 (MJD 55883). We used the Standard 2 mode data (16-s time resolution) to calculate the X-ray lightcurve. The background counts are subtracted and dead-time corrections are made. The energy-channel conversion is done by using the pca_e2c_e05v04 table provided by the RXTE team. In order to correct for the gain changes and the differences in effective area between the different PCUs, the flux is normalized to the Crab Nebula values (see Kuulkers et al. 1994; van Straaten et al. 2003) that are closest in time but in the same RXTE gain epoch (Jahoda et al., 2006).
For the timing analysis we used all GoodXenon and Event data, with a time resolution of and s, respectively. The GoodXenon data were rebinned to the same resolution of the Event data. No background subtraction or dead-time correction was applied to the data before calculating the power spectra. The Poissonian noise level was determined by taking the average power between 3000 and 4000 Hz, a region in the power spectra dominated by counting statistics noise. This mean value was then subtracted from the power spectra. The background was calculated for each observation (Obs-Id) with the FTOOL pcabackest over the entire energy range.
We used 256s-long segments to calculate power spectra with no energy selection (i.e., using all 256 energy channels). The frequency boundaries for the power spectra are therefore Hz and 4096 Hz. The power spectra were normalized in the rms normalization (van der Klis, 1995) which gives the power density in units of . Consistent with Patruno et al. (2009a), we define the fractional rms amplitude between and as:
| (2) |
and calculate the errors from the dispersion of the data points in the power spectra.
To confirm the presence of coherent X-ray pulsations at the spin frequency ( Hz) of the neutron star, we barycentered the photons arrival times with the FTOOL faxbary using the most precise Chandra astrometric position available (Heinke et al., 2010) and the JPL DE-405 solar system ephemeris. We then generated dynamical power spectra with 256 s long data segments and overlapping intervals of 64 s. As is common practice in coherent timing studies of AMXPs, we here retain only the energy channels between 5 and 37 (absolute channels).
Each power spectrum is inspected by eye to look for the presence of the 1 Hz modulation which was already observed and reported on June 12th 2010 (Patruno et al., 2010). The 1 Hz modulation was observed in the power spectrum of SAX J1808.4–3658 as a broad feature that can be described by one or multiple Gaussians (Patruno et al., 2009a). Therefore we follow the same procedure here and fit the 1 Hz modulation in the power spectrum with one or more Gaussian functions:
| (3) |
where A is the amplitude of the modulation, the centroid frequency and the constant is related to the FWHM via the expression:
| (4) |
The choice of a Gaussian distribution rather than a Lorentzian distribution (which is more typical in QPOs fitting) is made because the power spectrum shows a rapid decline at lower frequencies, leading to a systematic overestimate when fitting with a Lorentzian function.

We study the energy dependence of the 1 Hz modulation by selecting the observation with the highest signal-to-noise (ObsId 94315-01-14-00) and splitting the data into four energy bands (2.475.31, 5.719.81, 10.2215.60 and 16.0128.67 keV). The intrinsic faintness of NGC 6440 X-2 does not allow a splitting of the data into more sub-bands. We do not select any energy above keV as the count rate is consistent with the background.
We also investigate the coherence of the time variability in different energy bands, closely following the method outlined in Vaughan & Nowak (1997) and Scaringi et al. (2013). The coherence between two time series is defined as the degree of linear correlation between two Fourier frequencies in two different lightcurves observed simultaneously but in different energy bands. Once each lightcurve is corrected for the Poissonian noise component, then it is possible to calculate the intrinsic coherence function . In simple terms, the intrinsic coherence function describes how strongly the variability observed in one energy band is causally connected to the variability seen in the other band. If the the degree of coherence is high, then the variability seen in one energy band is correlated to the variability observed in the other band.
In our measurements, we use again the observation 94315-01-14-00 ( ks exposure) and define two energy bands: 2.477.76 keV (soft band “x”) and 8.1728.67 keV (hard band “y”). The two bands are defined so that the counting statistics is similar in both time series. We split the two time series in data segments of length 256 s each. Each -th time series and (with ) is Fourier transformed into and . We then calculate the cross-spectra between each pair as:
| (5) |
and the power spectral density of each time series: and
In an ideal linear system with an input time series , the output time series will be perfectly correlated to provided that no extra noise enters in the measurements. In this case the intrinsic coherence function has a value of 1. Two completely unrelated time series have instead an intrinsic coherence value of 0. The intrinsic coherence function is obtained by removing the Poissonian noise level from each power spectrum and correlation function. We then define the intrinsic coherence by following Scaringi et al. (2013):
| (6) |
where the double brackets refer to averages over the N ensembles and the number of adjacent Fourier frequency bins.
3. Results
We detect the 1 Hz modulation in seven distinct Obs-Ids and six different outbursts (30-Aug-2009, 21-Mar-2010, 12-Jun-2010, 04-Oct-2010, 23-Jan-2011, 06-Nov-2011; see Figure 1 and Table 1), with power in a narrow range of spectral frequencies (Hz). In the remaining four outbursts we cannot place any significant constraint on the presence of the 1 Hz modulation. Indeed one outburst was observed with the Swift X-Ray Telescope (XRT) in photon counting mode (2.5 s time resolution) with a Nyquist frequency of only 0.2 Hz. The remaining three outbursts (30-Jul-2009, 01-Oct-2009, 28-Oct-2009) were observed within the PCA Galactic Bulge Scan program (Swank & Markwardt, 2001) and analyzed in Altamirano et al. (2010). In these latter three outbursts the power spectra show no significant feature due to the poor counting statistics dominated by photon counting noise.
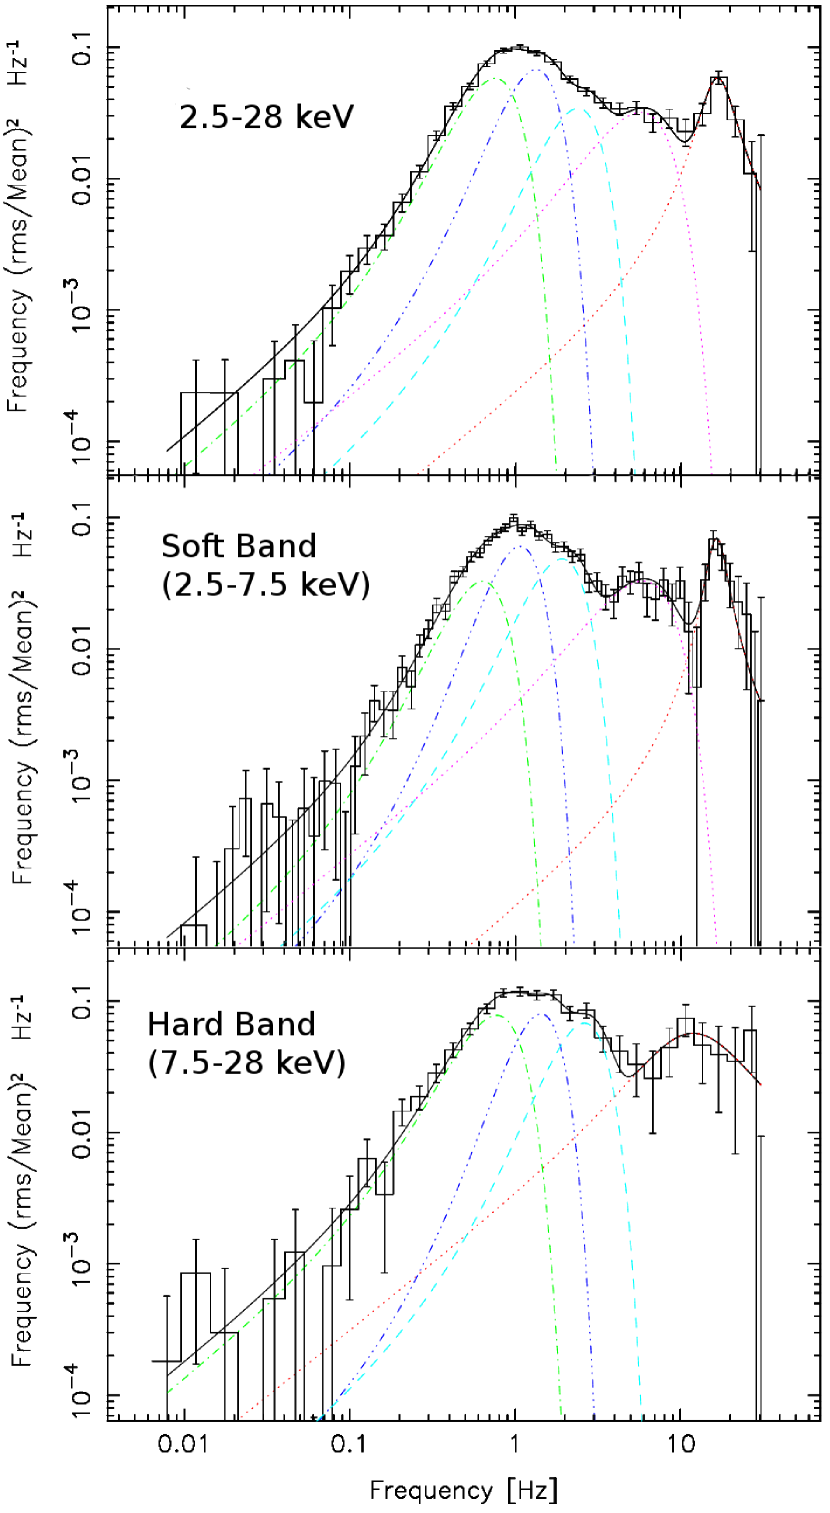
In some observations the 1 Hz modulation is also clearly observed in the time domain (see Figure 2 and compare to Figure 4 in Patruno et al. 2009a). The 1 Hz modulation appears as a Gaussian in the power spectrum along with one or more other Gaussians whose centroid frequency is harmonically related to the “fundamental” Gaussian centroid frequency (see Figure 3). The quality factor of the Gaussians is rather low, with and the amplitude is 40-55% rms (2-60 keV full energy band) in three observations. In the remaining observations the feature turns into a broadband-limited noise feature with rms amplitude between 20 and 40% rms. In all these observations the X-ray flux is always above 3 mCrab, whereas in all the others with a lower flux, the source NGC 6440 X-2 is not detected with a measured flux consistent with background emission.
In addition to the 1 Hz modulation, in two observations we also detect a broad QPO () with centroid frequency of Hz (Obs-Id: 94044-04-02-00; reported also in Altamirano et al. 2010) and Hz (Obs-Id: 94315-01-14-00). This QPO is well fitted in the power spectrum with a Lorentzian function.
3.0.1 Energy Dependence, Coherence and Time Lags
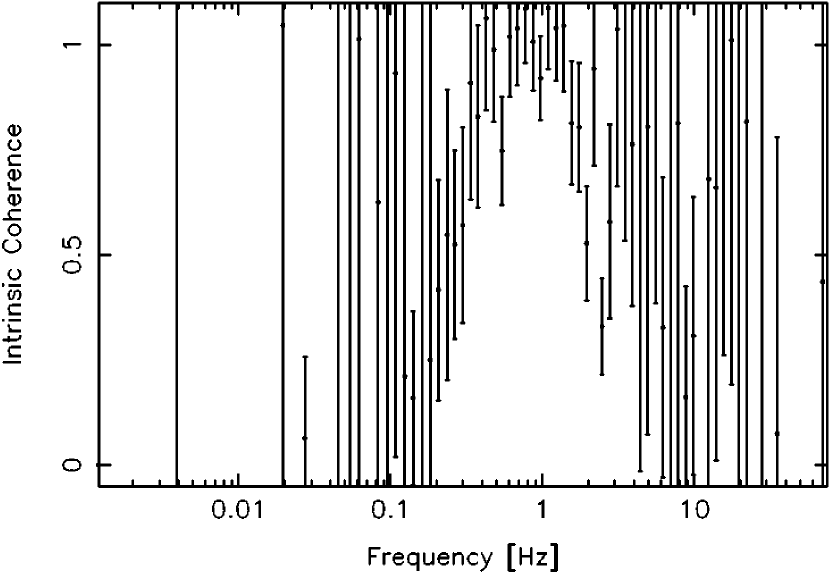
We detect a clear increase of the 1 Hz modulation rms amplitude at high energies, with a rms amplitude that grows linearly from 40% up to a peak of rms in the 16-28 keV energy band (Figure 4). The intrinsic coherence between two broad energy bands (2.477.35 keV and 7.7628.67 keV) is at frequencies between 0.5 and 1.5 Hz, and drops substantially outside this frequency range. Above 3 Hz and below 0.1 Hz the statistics become poor and the data points in the intrinsic coherence function have large error bars (Figure 5). We use the cross-spectra to inspect for the presence of time lags between the soft and hard energy bands. The time lags are defined as:
| (7) |
where is the Fourier phase lag between two identical Fourier frequencies () measured between the soft and hard energy bands. No time lags are detected between the two time series, with typical upper limits on the time lags between a specific Fourier frequency of less than 5 ms.

3.1. Pulsations
We detect significant pulsations at a frequency of Hz in all seven Obs-Ids. The frequency shows a Doppler modulation consistent with the orbital solution reported in Altamirano et al. (2010), although we do not attempt to refine the solution with a coherent timing analysis. The pulsations are detected in coincidence with the presence of the 1 Hz modulation.
4. Discussion
The spectral and timing properties of NGC 6440 X-2 provide a wealth of observations to compare with the predictions of the trapped disk and disk instability model presented in D’Angelo & Spruit (2010, 2011, 2012). Below we argue that the 1 Hz modulation spectral energy dependence and coherence between energy bands suggest the variability is driven by a changing accretion rate onto the star, while the 1 Hz modulation timescale, amplitude and mean accretion rate are in line with the predictions from D’Angelo & Spruit (2010, 2012). We also discuss the detailed timing properties of the source: the unusual power spectral shape of the modulation, and the short recurrent outbursts.
4.1. Evidence for accretion rate modulation
Our analysis of the outbursts of NGC 6440 X-2 shows that the 1 Hz modulation is present with high amplitude in at least six out of ten outbursts and that it is a recurrent phenomenon. The lack of the 1 Hz modulation in the remaining four outbursts is unconstrained due to the poor photon flux or time resolution limits. The timing and energy properties of the outburst strongly suggest that the modulation is produced by variations in the accretion rate onto the star.
Coherent pulsations at 206 Hz are clearly detected during all outbursts, demonstrating that the channeled accretion flow persists when the 1 Hz modulation is seen. A complete study of the periodic variability of the pulsations will be presented elsewhere.
The energy spectrum (Heinke et al., 2010) and energy-timing information (this work) also suggests a large-amplitude variation in accretion rate onto the star at one second intervals. The spectral energy distribution across all outbursts can be fit with a power law with an index between (Heinke et al., 2010), which is most likely produced by inverse Compton scattering of thermal seed photons, both from hot accretion-shocked gas on the stellar surface and hot optically thin gas in the inner accretion flow.
The soft and high energy bands are strongly coherent between 0.5–1.5 Hz, consistent with an overall change in luminosity produced by a changing accretion rate onto the star, where the variability timescale is long enough for the optically thin corona above the neutron star and thermal emission from the neutron star surface to reach quasi-equilibrium (Haardt & Maraschi, 1991). The drop in coherence above this frequency may then be a reflection of the intrinsic timescale for density or temperature fluctuations in the hot corona.
We also measure a steep increase (by about 20%) of the 1 Hz modulation rms amplitude with energy, so that the flux at higher energies varies more than the flux at low energies. Assuming that the overall emission is dominated by the accretion shock right above the neutron star’s surface (see e.g., Gierliński & Poutanen 2005), the increased rms amplitude at higher energies naturally results from a changing accretion rate.
Changes in the density and temperature in an optically thin corona above the neutron star will lead to a variable slope of the power-law index in the spectrum. (The slope is set by the Compton parameter, a function of the gas’s temperature and optical depth, where higher temperatures and higher densities both produce harder spectra). A fluctuation in accretion rate will thus change not only the overall flux but also the hardness of the inverse Compton spectrum, so that flux at higher energies is more variable than at lower energies, as seen in both NGC 6440 X-2 and SAX J1808.4–3658.
No thermal component was detected in the 49.1ks observation during the July 28, 2009 outburst (Heinke et al., 2010) or any other (less constraining) observation. This is in contrast to SAX J1808.4–3658, in which a thermal component is frequently seen in outbursts, and is attributed to a hot spot on the surface of the neutron star (Poutanen & Gierliński, 2003; Gierliński & Poutanen, 2005; Patruno et al., 2009b; Papitto et al., 2009; Kajava et al., 2011). In SAX J1808.4–3658 the thermal component is observed to lag the high energy one by ms (Cui et al., 1998; Gierliński et al., 2002), which Gierliński & Poutanen (2005) attribute to strong Doppler beaming of the blackbody emission compared to the more diffuse inverse Compton emission. The lack of thermal emission and low pulsation fraction may indicate that the main accretion hot spot in NGC 6440 X-2 is beamed out of our line of sight, while the upper limits on phase lags between hard and soft energy bands (of the order of 5 ms) are not particularly constraining.
4.2. Oscillations in an unstable dead disk
The instability studied in Spruit & Taam (1993) and D’Angelo & Spruit (2010, 2012) appears when the inner edge of the disk moves into a marginally dead state, with . This condition requires a low mean accretion rate so that the inner edge of the disk moves temporarily outside the corotation radius. NGC 6440 X-2, which has one of the lowest outburst luminosities of all known AMXPs, supports this picture. Its typical X-ray outburst luminosity is (Heinke et al., 2010), corresponding to a mass accretion rate of for a canonical neutron star mass of 1.4 and radius of 10 km.
The disk truncation radius is set by the magnetic field, and is subject to considerable uncertainty due to the uncertainty in exactly how the disk and field interact. We follow Spruit & Taam (1993) and D’Angelo & Spruit (2010) and define the inner disk radius as where the field is strong enough to force the gas to co-rotate with the star:
where the subscript “*” identifies quantities referred to the neutron star and is the fractional size of the toroidal field induced by the relative rotation between the magnetic field and the disk. For , the field lines will rapidly inflate and sever the connection between the disk and the star (e.g., Aly 1985; Lovelace et al. 1995), but the exact average value is uncertain. Assuming implies an uncertainty of up to on the value of that will put . The inferred magnetic field for NGC 6440 X-2 (assuming and for ) will be , well in line with most AMXPs (see e.g., Patruno & Watts 2012 for a review).
The timescale of the 1 Hz modulation also suggests an instability in the inner accretion disk. This timescale is much longer than the spin frequency of the star (206 Hz) or the dynamical timescale of the inner disk (similar when ). It is also likely much longer than the timescale on which the field lines are twisted open and reconnect to the disk, although this is currently somewhat uncertain (e.g., Romanova et al. 2009).
The disk instability studied by Spruit & Taam (1993) and D’Angelo & Spruit (2010, 2012) causes density fluctuations in the inner parts of the disk, which generally evolve on viscous timescales. The instability frequency roughly scales with the viscous timescale around the inner edge of the disk. This timescale is given by:
| (9) | |||||
where is the canonical -disk parameter for geometrically thin and optically thick disks (Siuniaev & Shakura, 1977) and . For NGC 6440 X-2, , and the modulation at 1 Hz is well in the instability range seen by D’Angelo & Spruit (2010, 2012). In section 4.4, we discuss this further and place tighter physical constraints on the disk-magnetosphere interaction based on the instability properties.
4.3. A dead disk in quiescence?
As well as being weak with short durations, the outbursts seen in NGC 6440 X-2 have the shortest recurrence time of any known AMXP, with ten outbursts seen at roughly monthly intervals between 2009 and 2011. Similar behaviour was seen in another AMXP, IGR J00291+5934, which in 2008 underwent two small outbursts (lasting around 10 days each) separated by a month in quiescence (Patruno, 2010; Hartman et al., 2011). This AMXP also showed a QPO at 0.5 Hz (Hartman et al., 2011), although this QPO is much more typical (with substantially lower amplitude of , and a standard Lorentzian shape) than those seen in NGC 6440 X-2 and SAX J1808.4–3658. There also may be a connection between the appearance of the instability in SAX J1808.4–3658 and the ’reflaring’ portion of the light-curve. The ’reflaring’ refers to large luminosity variations (up to 3 orders of magnitude) on timescales of 3-5 days in the decay tail of SAX J1808.4–3658 (see e.g., Figure 1 in Patruno et al. 2009a), suggesting large-scale changes in the accretion rate as the source approaches quiescence.
The short variation timescale of the reflares and outbursts is incompatible with the standard ionization instability model believed to power normal outbursts (e.g., Lasota 2001) and suggests that a substantial amount of gas remains in the inner regions of the accretion disk (close to ) when the accretion rate decreases, exactly as is expected for a dead disk. As was first noted by D’Angelo & Spruit (2012), the unusual frequent outbursts and strong 1 Hz modulation are both well-explained by a disk that never moves into a strong propeller phase at very low , but instead stores mass as a ‘dead disk’, which becomes unstable at higher .
The density structure of a dead disk, with its low temperature and a substantial amount of stored mass in the disk inner regions, is considerably different from the standard accretion disk and could strongly alter the ionization instability cycle. Although detailed calculations of how the ionization instability would be triggered in a dead disk are beyond the scope of the current work, the additional stored mass during quiescence could lower the density threshold for which newly accumulated mass (from the star or the outermost regions of the accretion disk) can trigger a new outburst. Such outbursts would be expected to have both shorter recurrence times and weaker outbursts, since less additional mass is accumulated between outbursts.
A further prediction of the dead disk picture is that spin-down should be enhanced during the quiescent phase, since the disk inner edge remains close to and continues to spin down the star. Note however, that the disk-field coupling parameters we infer for this source (in section 4.4) imply a narrow connected region between the star and the disk, which will also limit the spin-down from this source.
4.4. Constraining properties of the disk-field interaction
In the model presented in D’Angelo & Spruit (2010, 2012), the instability develops in two different regimes, depending mainly on the mean mass accretion rate through the disk. The more-studied regime (called RI in D’Angelo & Spruit 2012) occurs at very low accretion rates, with (where is the accretion rate that sets ). It is characterized by long periods of quiescence while mass accumulates in the inner regions of the disk followed by brief accretion outbursts. Indeed, the authors found that the period of the instability could span several orders of magnitude, from around (where is the viscous timescale at , Equation 9), depending chiefly on the time needed to fill up the reservoir and tip the source into an accretion burst.
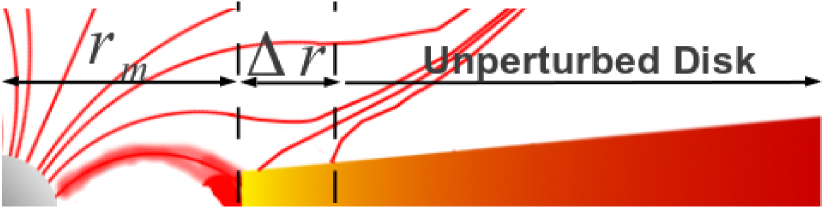
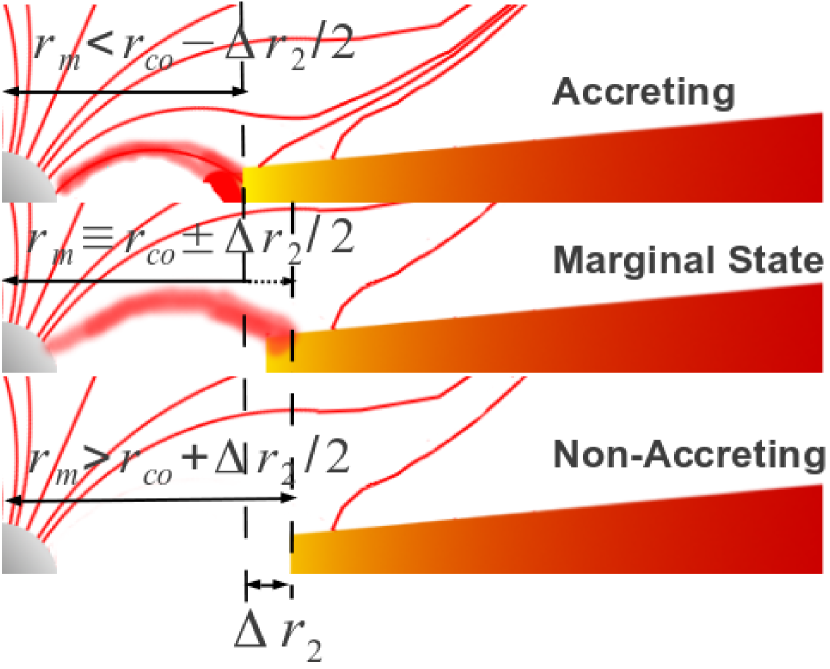
The instability outburst shape and duration also depends quite sensitively on the details of the disk-field interaction, which D’Angelo & Spruit (2010, 2012) parametrized as two length-scales: the width of the coupled region between the field and the disk, , and , the transition length around between the accreting and non-accreting solutions (see Figure 6 and 7). Both of these length scales are assumed to be small: . In the RI instability region, D’Angelo & Spruit (2010, 2012) found that the instability occurs for a broad range of (see Figure 3 and 4 in D’Angelo & Spruit 2012) but only when is very small (of order of 0.01).
However, in D’Angelo & Spruit (2012) the authors identified a second instability region, which they referred to as RII. Here the mean accretion rate is – much higher than RI – and accretion continues throughout the cycle, so that the amplitude of the instability is much smaller. The instability timescale is also much shorter than for RI, with periods around , and has a more sinusoidal, regular shape and a smaller amplitude, although the outburst length is still typically shorter than the build-up time (see e.g., Fig. 5 of D’Angelo & Spruit 2012). The instability also appears for different disk-field interaction parameters: here is very small (), while has a much broader range of instability.
In NGC 6440 X-2 the corotation radius is located at approximately 50 km from the neutron star center, but the surface magnetic field is still unknown, so that it is not possible to estimate the location of the magnetospheric radius from the luminosity alone. However, if we assume a typical AMXP magnetic field strength of G, the observed mass accretion rate is of the same order of magnitude or lower than , suggesting that we are observing the RII instability. In SAX J1808.4–3658 (with G, see Hartman et al. 2008; Patruno et al. 2012), the 1 Hz modulation was seen at fluxes corresponding to , suggesting that source is also unstable in the RII region. In this regime the instability only appears over a relatively narrow range of , offering a plausible explanation for why the instability is only observed in the decay tail of the outburst.
One obvious point of interest is why the 1 Hz modulation central frequency is nearly the same in both SAX J1808.4–3658 and NGC 6440 X-2, given that the system parameters are quite different. Despite the comparable X-ray flux detected in both AMXPs when the 1 Hz modulation is observed, the corresponding mass accretion rate of SAX J1808.4–3658 is about an order of magnitude lower than in NGC 6440 X-2 because the first source lies at about 3.5 kpc (Galloway & Cumming, 2006) whereas the latter is at 8.5 kpc (Ortolani et al., 1994). If we compare the fundamental centroid frequency of the 1 Hz modulation observed in all observations of NGC 6440 X-2 with those of SAX J1808.4–3658 then it is, on average, systematically lower in NGC 6440 X-2 by only a factor of . Without knowing the magnetic field in either source it is not easy to constrain exactly where the disk is truncated (or, to invert the problem, the actual ratio ), but if we assume that the relevant timescale is the viscous timescale at then this will be s for NGC 6440 X-2 vs. s for SAX J1808.4–3658, so the model predicts roughly the same for both sources, as observed. An independent constraint on would allow a much more secure determination of and also and .
The RII instability appears only for very small values of , of order 0.01–0.05 . This suggests a very small coupling region between the field and the disk – of order 1 km – in both SAX J1808.4–3658 and NGC 6440 X-2. Given the uncertainties in determining the system’s physical parameters, cannot be as well-constrained, although at these accretion rates (where is the instability frequency; see Fig. 7 of D’Angelo & Spruit 2012), so a smaller value for (of about 1-10 km) would also seem to be favored.
D’Angelo & Spruit (2012) found that when the instability is triggered in the RII regime, the accretion torques are reduced compared with the standard disk solution. An implication of this is that if an AMXP is observed to show the 1 Hz modulation in a certain mass accretion rate range, then the observed accretion torques must be smaller than the prediction made with the approximation:
| (10) |
It is possible to speculate therefore that the lack of strong positive accretion torque in SAX J1808.4–3658 (Hartman et al., 2008, 2009) might be partially caused by the source being almost always close to this marginally accreting state. The fact that SAX J1808.4–3658 is found with close to was also suggested by Haskell & Patruno (2011) based on coherent timing and quiescent thermal properties of the accreting neutron star.
4.5. Detailed timing properties
The fact that the 1 Hz modulation can be fitted with a Gaussian and not with a Lorentzian suggests some intrinsic difference between the generation of the 1 Hz modulation and the higher frequency QPOs observed in NGC 6440 X-2 and SAX J1808.4–3658. It also suggests some remarkable difference between most of the other QPOs broadly observed in other low mass X-ray binaries and the 1 Hz mechanism.
If a Gaussian stochastic process controls the fluctuations in mass accretion rate around the magnetospheric radius, then the expected profile instability will be a Gaussian. This in turn might explain why the 1 Hz modulation has a Gaussian shape and not a Lorentzian. It is conceivable indeed to think that, once the instability is triggered and the gas is accumulating around , the main timescale of the instability will be strictly periodic if none of the quantities in the system is changing (i.e., , and ). However, if we let fluctuate (in a Gaussian stochastic way) around its mean value, the periodicity of the instability will slightly change, thus broadening the periodicity across adjacent frequencies. It is then possible to understand why the shape of the 1 Hz modulation is Gaussian and why it becomes a broad feature in some observations whereas in others it is a more periodic and narrow feature: the stronger the fluctuations in around the mean value, the broader the 1 Hz modulation will appear in the power spectra.
4.6. Alternative Models
Patruno et al. (2009a) reported an extensive discussion of alternative models to the trapped-disk instability presented in Spruit & Taam (1993) (and later developed in D’Angelo & Spruit 2010, 2012). It was shown that none of the alternative models can explain at the same time the observed features of the 1 Hz modulation in SAX J1808.4–3658. Identical consideration apply also to the 1 Hz modulation in NGC 6440 X-2, as all the observational features closely resemble those in SAX J1808.4–3658 and identical considerations apply. More recently, Romanova et al. (2013) has carried 3D MHD simulations with a dipole magnetic field misaligned from the neutron star’s rotational axis, in which a warped disk appears. Perturbations of the disk in the vertical direction produce low-frequency bending waves, whose frequency is approximately equal to the Keplerian frequency of the gas in the disk. Since the inner disk is truncated at about km, the Keplerian frequency there is of the order of 200 Hz, which is 2-3 orders of magnitude off the observed instability frequency. The warped disk predicts oscillations with frequency down to 0.1-1 Hz, but the region of the disk that oscillates has to be far away from the neutron star, at several thousands kilometers, where no X-ray radiation is produced and the inner accretion flow (at about 50 km) would still be modulated at the much higher Keplerian frequency there.
5. Conclusions
We have studied the 1 Hz modulation in the AMXP NGC 6440 X-2 and suggested that this feature has the same physical origin as seen in the other AMXP SAX J1808.4–3658 . We propose the identification of this feature with a magnetospheric instability triggered in the weak propeller stage. Our study suggests a very small transition region of the order of 0.01–0.05. This region is where the magnetic field lines open and interact with the accretion disk and this has to be small in both AMXPs considered in this work. We are not able to put such strong constraints on transition region , where the nature of the accretion torques changes from spin up to spin down, but suggest it lies in the range 0.01-1. Given that when the instability is observed, the radial extension of the two transition regions for the two AMXPs is: km and km. This is the first time that the width of the magnetosphere-disk interaction region can be constrained with direct observations.
We have also suggested an explanation for the Gaussian shape of the 1 Hz modulation as seen in the power spectra as due to fluctuations in the mean mass accretion rate during the instability. Strong fluctuations can smear the 1 Hz modulation from a rather coherent QPO to a broadband-limited noise. If confirmed, this might be the first clear physical identification of the mechanism behind the generation of a low frequency QPO and broad band noise.
References
- Altamirano et al. (2010) Altamirano, D., Patruno, A., Heinke, C. O., et al. 2010, ApJ, 712, L58
- Aly (1985) Aly, J. J. 1985, A&A, 143, 19
- Cui et al. (1998) Cui, W., Morgan, E. H., & Titarchuk, L. G. 1998, ApJ, 504, L27+
- D’Angelo & Spruit (2010) D’Angelo, C. R., & Spruit, H. C. 2010, MNRAS, 406, 1208
- D’Angelo & Spruit (2011) —. 2011, MNRAS, 416, 893
- D’Angelo & Spruit (2012) —. 2012, MNRAS, 420, 416
- Galloway & Cumming (2006) Galloway, D. K., & Cumming, A. 2006, ApJ, 652, 559
- Gierliński et al. (2002) Gierliński, M., Done, C., & Barret, D. 2002, MNRAS, 331, 141
- Gierliński & Poutanen (2005) Gierliński, M., & Poutanen, J. 2005, MNRAS, 359, 1261
- Haardt & Maraschi (1991) Haardt, F., & Maraschi, L. 1991, ApJ, 380, L51
- Hartman et al. (2011) Hartman, J. M., Galloway, D. K., & Chakrabarty, D. 2011, ApJ, 726, 26
- Hartman et al. (2009) Hartman, J. M., Patruno, A., Chakrabarty, D., et al. 2009, ApJ, 702, 1673
- Hartman et al. (2008) —. 2008, ApJ, 675, 1468
- Haskell & Patruno (2011) Haskell, B., & Patruno, A. 2011, ApJ, 738, L14
- Heinke et al. (2010) Heinke, C. O., Altamirano, D., Cohn, H. N., et al. 2010, ApJ, 714, 894
- Illarionov & Sunyaev (1975) Illarionov, A. F., & Sunyaev, R. A. 1975, A&A, 39, 185
- Jahoda et al. (2006) Jahoda, K., Markwardt, C. B., Radeva, Y., et al. 2006, ApJS, 163, 401
- Kajava et al. (2011) Kajava, J. J. E., Ibragimov, A., Annala, M., Patruno, A., & Poutanen, J. 2011, MNRAS, 417, 1454
- Kuulkers et al. (1994) Kuulkers, E., van der Klis, M., Oosterbroek, T., et al. 1994, A&A, 289, 795
- Lasota (2001) Lasota, J.-P. 2001, New Astronomy Review, 45, 449
- Lovelace et al. (1995) Lovelace, R. V. E., Romanova, M. M., & Bisnovatyi-Kogan, G. S. 1995, MNRAS, 275, 244
- Ortolani et al. (1994) Ortolani, S., Barbuy, B., & Bica, E. 1994, A&AS, 108, 653
- Papitto et al. (2009) Papitto, A., di Salvo, T., D’Aı, A., et al. 2009, A&A, 493, L39
- Patruno (2010) Patruno, A. 2010, ApJ, 722, 909
- Patruno et al. (2012) Patruno, A., Bult, P., Gopakumar, A., et al. 2012, ApJ, 746, L27
- Patruno et al. (2010) Patruno, A., Hartman, J. M., Wijnands, R., Chakrabarty, D., & van der Klis, M. 2010, ApJ, 717, 1253
- Patruno et al. (2009a) Patruno, A., Watts, A., Klein Wolt, M., Wijnands, R., & van der Klis, M. 2009a, ApJ, 707, 1296
- Patruno et al. (2009b) Patruno, A., Rea, N., Altamirano, D., et al. 2009b, MNRAS, 396, L51
- Patruno & Watts (2012) Patruno, A., & Watts, A. L. 2012, ArXiv e-prints (astro-ph/1206.2727); To appear in ”Timing neutron stars: pulsations, oscillations and explosions”, T. Belloni, M. Mendez, C.M. Zhang Eds., ASSL, Springer
- Poutanen & Gierliński (2003) Poutanen, J., & Gierliński, M. 2003, MNRAS, 343, 1301
- Rappaport et al. (2004) Rappaport, S. A., Fregeau, J. M., & Spruit, H. 2004, ApJ, 606, 436
- Romanova et al. (2009) Romanova, M. M., Ustyugova, G. V., Koldoba, A. V., & Lovelace, R. V. E. 2009, MNRAS, 399, 1802
- Romanova et al. (2013) Romanova, M. M., Ustyugova, G. V., Koldoba, A. V., & Lovelace, R. V. E. 2013, MNRAS, 430, 699
- Scaringi et al. (2013) Scaringi, S., Koerding, E., Groot, P. J., et al. 2013, ArXiv e-prints
- Siuniaev & Shakura (1977) Siuniaev, R. A., & Shakura, N. I. 1977, Pisma v Astronomicheskii Zhurnal, 3, 262
- Spruit & Taam (1993) Spruit, H. C., & Taam, R. E. 1993, ApJ, 402, 593
- Swank & Markwardt (2001) Swank, J., & Markwardt, K. 2001, in ASP Conf. Ser. 251, New Century of X-ray Astronomy, eds. H. Inoue & H. Kunieda (San Francisco: ASP), 94
- van der Klis (1995) van der Klis, M. 1995, in The Lives of the Neutron Stars, ed. M. A. Alpar, U. Kiziloglu, & J. van Paradijs, 301–+
- van der Klis et al. (2000) van der Klis, M., Chakrabarty, D., Lee, J. C., et al. 2000, IAU Circ., 7358, 3
- van Straaten et al. (2003) van Straaten, S., van der Klis, M., & Méndez, M. 2003, ApJ, 596, 1155
- Vaughan & Nowak (1997) Vaughan, B. A., & Nowak, M. A. 1997, ApJ, 474, L43