Star Formation in High-Redshift Starburst Galaxies
Abstract
I present a model for the star formation properties of 2 starburst galaxies. Here, I discuss models for the formation of high- Submillimeter Galaxies, as well as the CO-H2 conversion factor for these systems. I then apply these models to literature observations. I show that when using a functional form for that varies smoothly with the physical properties in galaxies, galaxies at both local and high- lie on a unimodal Kennicutt-Schmidt star formation law, with power-law index of . The inferred gas fractions of these galaxies are large (), though a factor lower than most literature estimates that utilize locally-calibrated CO-H2 conversion factors.
1 Introduction
The seminal paper by Brown & Vanden Bout (1991) opened a new frontier for understanding star formation in the Universe. In the two decades since their discovery of CO emission from UltraLuminous Infrared Galaxy (ULIRG) IRAS F10214+4724, the field of detecting and characterizing the star forming interstellar medium (ISM) has seen an explosion of activity. Indeed, great progress has been made. Thanks to pioneering efforts on older facilities, as well as upgrades to cm/mm-wave telescopes, the detection of CO through 6 has now become routine (see, for example, the contribution by Riechers in this volume). Similarly, the development of novel galaxy selection techniques in the optical, infrared and submillimeter has allowed for the discovery of copious numbers of star forming galaxies in the early Universe.
The flood of new data has opened up a variety of questions regarding the nature of star formation in these galaxies, and, at times, presented a somewhat confusing picture. For example, Submillimeter-selected galaxies (SMG; galaxies selected for mJy) are the brightest unlensed galaxies in the Universe; whether or not they have local analogs is unclear. Naively, one might appeal to the argument that, since locally the brightest galaxies are all galaxy mergers, these might be as well. Indeed, some observations have provided clear evidence for this (e.g. Engel et al. 2010; Alaghband-Zadeh et al. 2012). On the other hand, high-resolution CO imaging of some SMGs has shown unambiguous existence of rotating molecular disks (Hodge et al. 2012). It is not at all clear that local starbursts are direct analogs of those seen at high-.
Similarly, open questions remain regarding how to relate the physics of star formation in high- galaxies to what is seen locally. As an example, observations of CO (as a tracer for molecular H2) of both disk-like systems at 2 as well as galaxy mergers has suggested a potential bimodality in the normalization of the Kennicutt-Schmidt (KS) star formation relation. In this picture, mergers at both present epoch and high- form stars in a different “mode” than in normal, quiescent galaxies such that the timescale for star formation is much shorter in mergers. This result is of course sensitive to the applicability of locally-calibrated CO-H2 conversion factors***The CO-H2 conversion factor is typically dubbed , , or the -factor in the literature. These are equivalent definitions, and will be described in § 3. to high- galaxies.
In the same vein, even understanding the baryonic makeup of high- galaxies is not straightforward. It is clear, for example, that galaxies at a given stellar mass form stars at higher rates at 2 than they do at =0 (Noeske et al. 2007a, b). At face value, the likely explanation for this is the observed increased gas fractions (defined as )) at high- relative to local systems (e.g. Daddi et al. 2010b; Tacconi et al. 2010; Geach et al. 2011). On average, however, the measured gas fractions are a factor 2-3 larger at 2 than is predicted by most cosmological galaxy growth models (Lagos et al. 2011; Narayanan et al. 2012a), suggesting a more dramatic increase of gas fraction with redshift than is predicted by models.
In this contribution, I will present the results of modeling efforts by myself and collaborators that aim to address many of these issues. While the space allocations for this proceeding were indeed generous, it is unlikely that I will be able to fully discuss the details of the presented work. I encourage the interested reader to refer to the cited papers in each section for more details, and certainly welcome emails with questions as well.
2 Submillimeter Galaxy Formation
Submillimeter Galaxies were originally detected in blind surveys by the James Clerk Maxwell Telescope (JCMT) at 850 m. Subsequent multi-wavelength followup observations showed that these galaxies reside principally between =2-4, and are among the most luminous, heavily star-forming galaxies in the Universe (for a review, see Shapley 2011). As described in § 1, however, uncovering their physical origin has been difficult.
We can get some intuitive guidance from the seminal review published by Solomon & Vanden Bout (2005). As is clear from their Appendix 2, SMGs at 2 have exceptionally large line widths, with median values ranging from . Converting these line widths to simple dynamical masses results in galaxy stellar masses of order (which is consistent with direct measurements by Michałowski et al. (2012), though may be higher in some cases than measurements by Hainline et al. (2011)).
We can now ask whether SMGs are solely represented by major galaxy mergers (with mass ratios 1:3). The dimensionless merger rate at this mass is approximately 1 per Hubble Time at 2 (Guo & White 2008). Even if the duty cycle for the submillimeter luminous phase is as long as years (which is a substantial time for a merger-driven burst Hopkins et al. 2013a, b), the predicted counts would still be a factor less than their observed space densities (Davé et al. 2010). It is clear that the full population of SMGs cannot be accounted for by major mergers alone. On the other extreme, SMGs cannot be solely represented by isolated disk galaxies at these redshifts. Hayward et al. (2010) and Hayward et al. (2012b) showed that if one combines observed stellar mass functions at 2-3 with the observed Schmidt relation, and numerically calibrated -SFR relation, that disks may make up the faint end of the observed SMG number counts, but will fail catastrophically toward the bright end.
Instead, SMGs must be a mixed bag of sources, including isolated disk galaxies, galaxy mergers, and pairs of galaxies en route to merging that both contribute to the relatively large JCMT beam at 850 m (Hayward et al. 2011, 2012a). In Hayward et al. (2012b), we explicitly examine the contribution of various mechanisms for SMG formation to the observed SMG number counts. To this end, we run a large suite of galaxy merger simulations over a large range of galaxy masses, and merger mass ratios, as well as isolated disk galaxies with a large range of galaxy masses. We combine these with dust radiative transfer calculations (utilizing the publicly available dust radiative transfer code, sunrise, Jonsson et al. 2010) in order to explicitly calculate the synthetic submillimeter-wave flux density from our modeled galaxies. In this way, we can directly compare our models to observations.
Missing from the physical ingredients to the model thusfar, however, is a means to simulate a blank field survey. That is, the simulations are idealized and not cosmological. To infer cosmological statistics from our model (what an observer would measure in a survey that is not limited by cosmic variance), we combine the submillimeter duty cycles and expected fluxes from our galaxy mergers and disk galaxies with measured galaxy stellar mass functions and theoretical galaxy merger rates as a function of redshift (Hopkins et al. 2010). The full details of this procedure can be found in Hayward et al. (2012b). Effectively, what this is doing is to say ’if I look in a field of a given area, how many galaxies of a given mass will I find, and how many galaxy mergers of a given mass and merger mass ratio are there? Then, what is the submillimeter flux from galaxies of this mass and/or merger mass ratio? ’ The advantage of this methodology is that we are able to maintain relatively high spatial resolution (compared to standard cosmological hydrodynamic simulations), while still inferring cosmological statistics. In Narayanan et al. (2009); Narayanan et al. (2010a) and Narayanan et al. (2010b), we show that this model for SMG galaxy formation provides a reasonable match to the observed spectral energy distributions (SEDs), CO line widths, excitation patterns, and connection with 24 m sources.
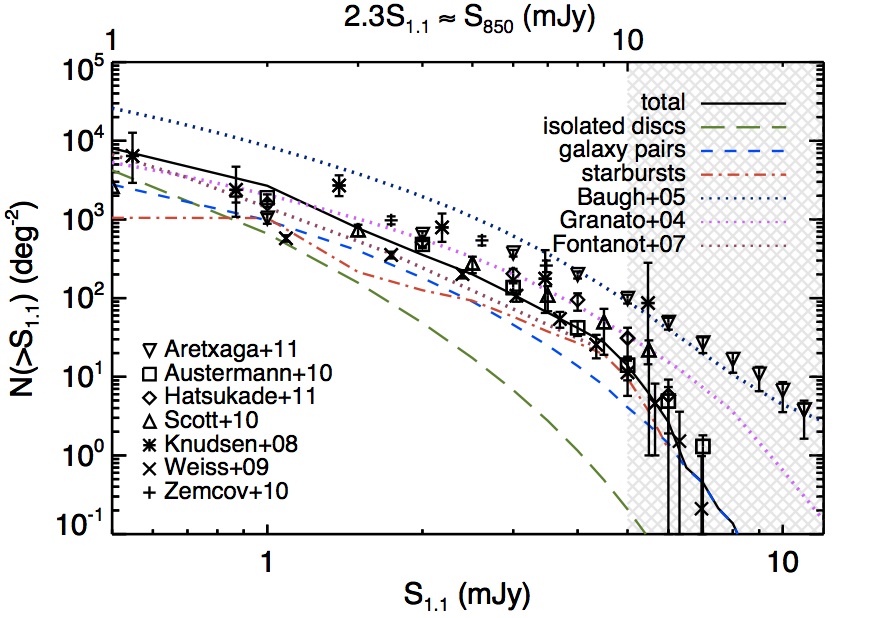
In Figure 1, I present the cumulative synthetic number counts at 1 mm from our model for SMG formation (presented originally in Hayward et al. 2012b), and overlay data from a number of recent surveys. We compare at 1 mm rather than 850 m since, as of the time of writing, the deepest and widest surveys have all been conducted at 1 mm. The solid black line shows the total number counts predicted from our model, while the other lines denote the various contributors to the counts (e.g. isolated disks, major mergers, and galaxy pairs). By and large, at low flux densities, disks tend to dominate, while at the bright end major merger play a significant role. At intermediate flux densities, galaxy pairs can be an important constituent to the observed number counts. At the time of this writing, ALMA cycle 0 and cycle 1 observations are already examining samples of 2 Submillimeter Galaxies, and will provide an important observational test of this model. Already, an attractive aspect to this model is that it is able to provide an explanation for the observed menagerie of sources that appear to comprise SMGs (e.g. Engel et al. 2010; Hodge et al. 2012).
3 The CO-H2 Conversion Factor in Galaxies
We now take a brief diversion for this section to develop a model for the CO-H2 conversion factor in galaxies. This will be important when trying to then interpret the observed star formation law for starburst galaxies, as well as infer their baryonic gas fractions. The full model that I summarize here is developed in Narayanan et al. (2011a, 2012) and Narayanan & Hopkins (2012).
Owing to the relative difficulty in exciting H2, 12CO (as the second-most abundant molecule in the ISM) is typically used as a tracer of molecular gas. Observational calibrations of the conversion factor have come from a variety of methods, and are summarized nicely in Bolatto’s contribution in this volume. The conversion factor can be defined either as , or . The two are equivalent, and are related dimensionally via . We will present the results here in terms of either. Largely, observations have found three main trends: (1) appears to have a remarkably narrow range of observed values in the Galaxy, and nearby galaxies (with the exception of both the Galactic Center and the SMC); (2) increases with decreasing gas phase metallicity; (3) in heavily star-forming systems (such as in nearby ULIRGs), appears to be depressed from the mean Galactic value by an average value of (Narayanan 2011).
For the purposes of starburst galaxies, the community has typically treated the conversion factor as bimodal: a mean Galactic value for disks and quiescent galaxies, and a value times lower for starbursts and mergers. Locally, on average, for some time this has been a fine approximation, and indeed was motivated by observations (Downes & Solomon 1998). However, as evermore sensitive and high-resolution observations began to probe high-redshift galaxies, the applicability of a bimodal -factor has come into question. For example, which of the bimodal values should one use for an early-coalescence merger? What about a minor merger? For high- disks, which can form stars at rates comparable to low- mergers, should one use the locally-calibrated merger value, or mean Milky Way value?
A substantial amount of observational and theoretical work has been invested in this field, and I refer the reader to the forthcoming Bolatto et al. review for a summary. Here, I concentrate principally on our own group’s efforts in this field.
In Narayanan et al. (2011a) and Narayanan et al. (2012), we utilized a large suite of galaxy evolution simulations, similar to those explored in § 2, though with a large fraction of galaxies with virial properties scaled for =0 as well. The primary reason for the galaxy evolution simulations was to develop a large library of models that span a large dynamic range of physical conditions in the ISM. The neutral gas was treated as multiphase, with the H2-HI balance determined by the balance of photodissocation of H2 by Lyman-Werner band photons against the growth rate on dust grains (Krumholz et al. 2008, 2009). The fraction of carbon locked in CO was determined following the model of Wolfire et al. (2010), and the C/H2 abundance was set at , where is the metallicity scaled to solar.
The temperature of the H2 ISM was determined by a balance of the dominant heating processes (grain photoelectric effect, cosmic ray heating), cooling processes (CII or CO line cooling), and energy exchange between gas and dust at high densities (Krumholz et al. 2011). In short, at low densities, the temperature of the gas is typically K owing to cosmic rays and the photoelectric effect dominating the temperature of the ISM. At higher densities (), thermal coupling between gas and dust begins to become quite important, and the temperature of the gas can rise toward the dust tempearture.
is the gas column density divided by , the velocity-integrated line intensity. Because the ground state of CO (the J=1-0 transition) is typically in local thermodynamic equilibrium (LTE), and optically thick, increases with both gas kinetic temperature, as well as the velocity dispersion. In a galaxy merger or starburst environment, typically both increase dramatically. The former owes to increased dust temperatures in the high radiation field typical of a starburst (as well as the efficient energy exchange between gas and dust in dense environments), while the latter simply reflects the increased turbulence in the ISM characteristic of a galaxy merger. The column density of the gas of course increases with the star formation rate, but the combination of the temperature increase and velocity dispersion increase generally overwhelm this, and drive downward in heavily star-forming environments.
is also dependent on the metallicity of the gas. Beyond C and O abundances depending on the metallicity, CO typically requires columns of to survive from photodissociating radiation (whereas H2 can self-shield at much lower columns, Wolfire et al. 2010). As a result, in low metallicity gas, there can be “CO dark” clouds that are abundant in H2, but lacking in CO. In this case, will be elevated from the mean Galactic value (Leroy et al. 2011).
We can utilize the numerical simulations to derive a functional form for the -factor as a function of observable properties of the ISM. As discussed, principally depends on the temperature, velocity dispersion, and gas phase metallicity. The gas column density typically rises with the temperature and velocity dispersion, though more slowly than their product. As an observable, the velocity integrated CO intensity serves as a reasonably good proxy for the gas temperature and velocity dispersion. We perform a 2D Levenberg-Marquardt fit on our library of simulations to arrive at the relation:
| (1) |
Where is the CO intensity, and is the metallicity with respect to solar. Formally, is the luminosity weighted CO intensity from all the GMCs in a given galaxy. In the limit of a relatively large volume filling factor for the ISM, however, this simply reduces to , where is the CO luminosity (K-km s-1-pc2), and is the area. The minimum in the function is in place as a recognition that Equation 1 cannot increase indefinitely with decreasing . Eventually, GMCs tend toward fixed properties, and will plateau so long as the metallicity does not vary.
Equation 1, in principle, can be used to directly determine the CO-H2 conversion factor from a galaxy with two observables: the CO surface brightness and the gas phase metallicity. This suggests that has a continuum of values that varies with the physical properties of the ISM. Intuitively, this makes sense. H2 abundances vary with the physical conditions in a galaxy, as do CO emission line strengths. Only a rather strong conspiracy would allow for constant or bimodal values of . Indeed, some observational constraints have provided some support for this model (blan12; Sandstrom et al. 2012; Ivison et al. 2013). In the subsequent sections, I discuss two potential applications for this functional form of the conversion factor.
4 The Kennicutt-Schmidt Star Formation Law in High- Starbursts
The Kennicutt-Schmidt star formation relation is a natural application for the presented functional form for . Moreover, without having to rely on a bimodal -factor, we can avoid some of the sticky questions related to which conversion factor to use for a given galaxy population, and can begin to understand how high- galaxies compare to local ones in terms of their SFR surface density-gas surface density relation.
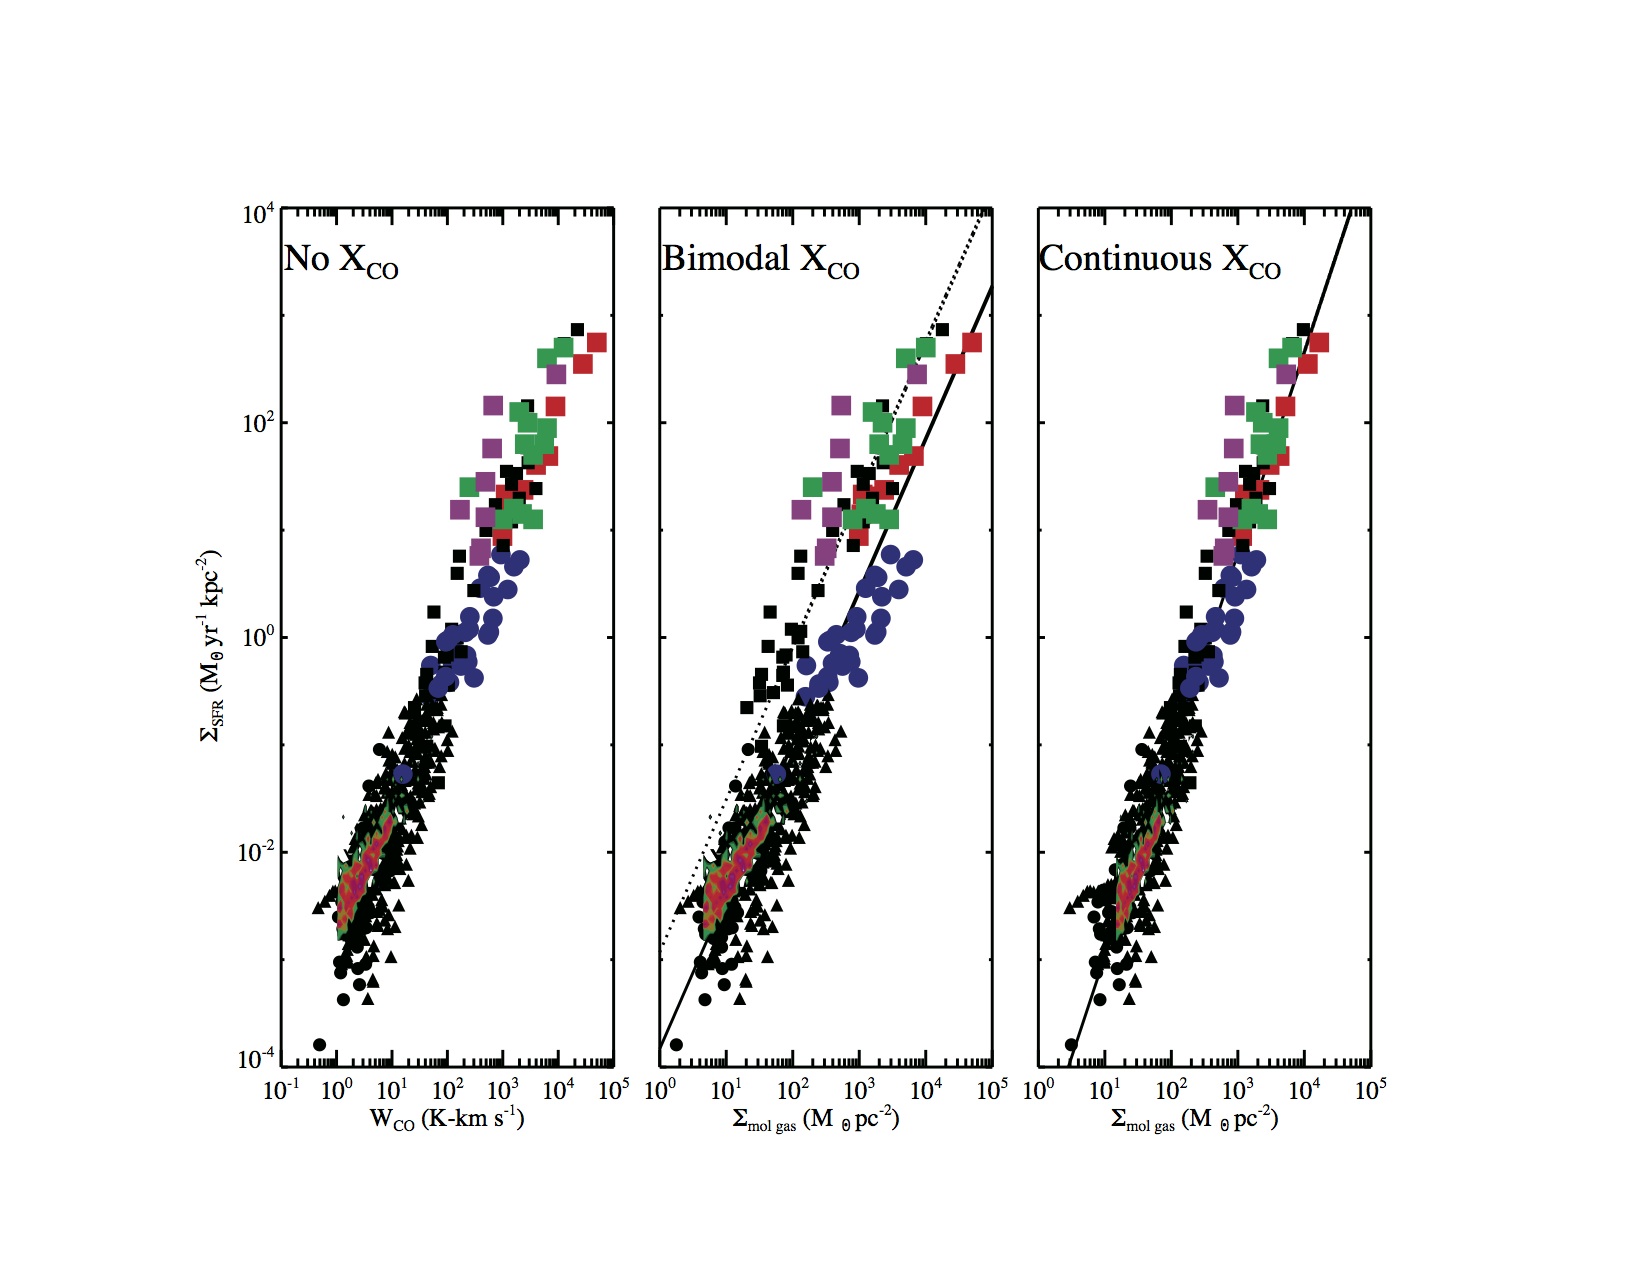
In Figure 2, I plot the Kennicutt-Schmidt star formation relation for resolved-regions in local galaxies, global measurements for local disks and ULIRGs, high- disks and high- starbursts†††In practice, the high- disks are forming stars at rates that would normally qualify a local galaxy as a “starburst”. However, at increasing redshift, galaxies at a fixed stellar mass typically have higher SFRs, to the point that many of the disks selected in by BzK colors have SFRs approaching 100 Myr-1. The high- starbursts are typically SMGs, though a few are selected via alternative methods.. We plot the - relation for these systems on the left, the relation assuming a bimodal‡‡‡For the purposes of this plot, we classify all high- SMGs as mergers, despite the evidence to the contrary presented in § 2. We do this so as to remain consistent with assumptions typically made in the literature, though we note that this further underscores the motivation for deriving a functional form for , rather than relying on identifying galaxies as ’disks’ or ’mergers’.§§§For observations of highly-excited lines, we assume the conversion to the J=1-0 transition as quoted in the original paper, and do not take into account any potential effects of differential excitation (e.g. Narayanan et al. 2008a, b; Bussmann et al. 2008; Juneau et al. 2009; Narayanan et al. 2011c) -factor in the middle, and the same relation utilizing our functional form for (Equation 1) in the right panel. We assume a solar metallicity for each galaxy. This Figure was first presented in Narayanan et al. (2012), and I refer the interested reader there for further details.
As is clear, the application of a smoothly varying functional form for has significant impact on the interpretation of the Kennicutt-Schmidt star formation relation. When utilizing the traditional bimodal -factor (the mean Galactic value for disks at low and high , and a value a factor lower for mergers), a bimodal Schmidt relation results (Daddi et al. 2010a; Genzel et al. 2010). This is shown in the middle panel of Figure 2. The interpretation of this is that mergers and disks have different modes of star formation, with mergers inherently forming stars more efficiently (that is, on a shorter timescale).
When utilizing Equation 1 for instead, we recover a unimodal star formation law (right panel of Figure 2) with best fit relation . This has numerous implications for our understanding of high- star formation. First, in this picture, there is no fundamental difference between disk galaxies and galaxy mergers. This is most telling when comparing the black squares (which represent local ULIRGs) and blue circles (which represent heavily star-forming high- disks). Some moderate low- ULIRGs have values intermediate between the canonical “ULIRG value” and “disk value”, as do some heavily star-forming high- disks.
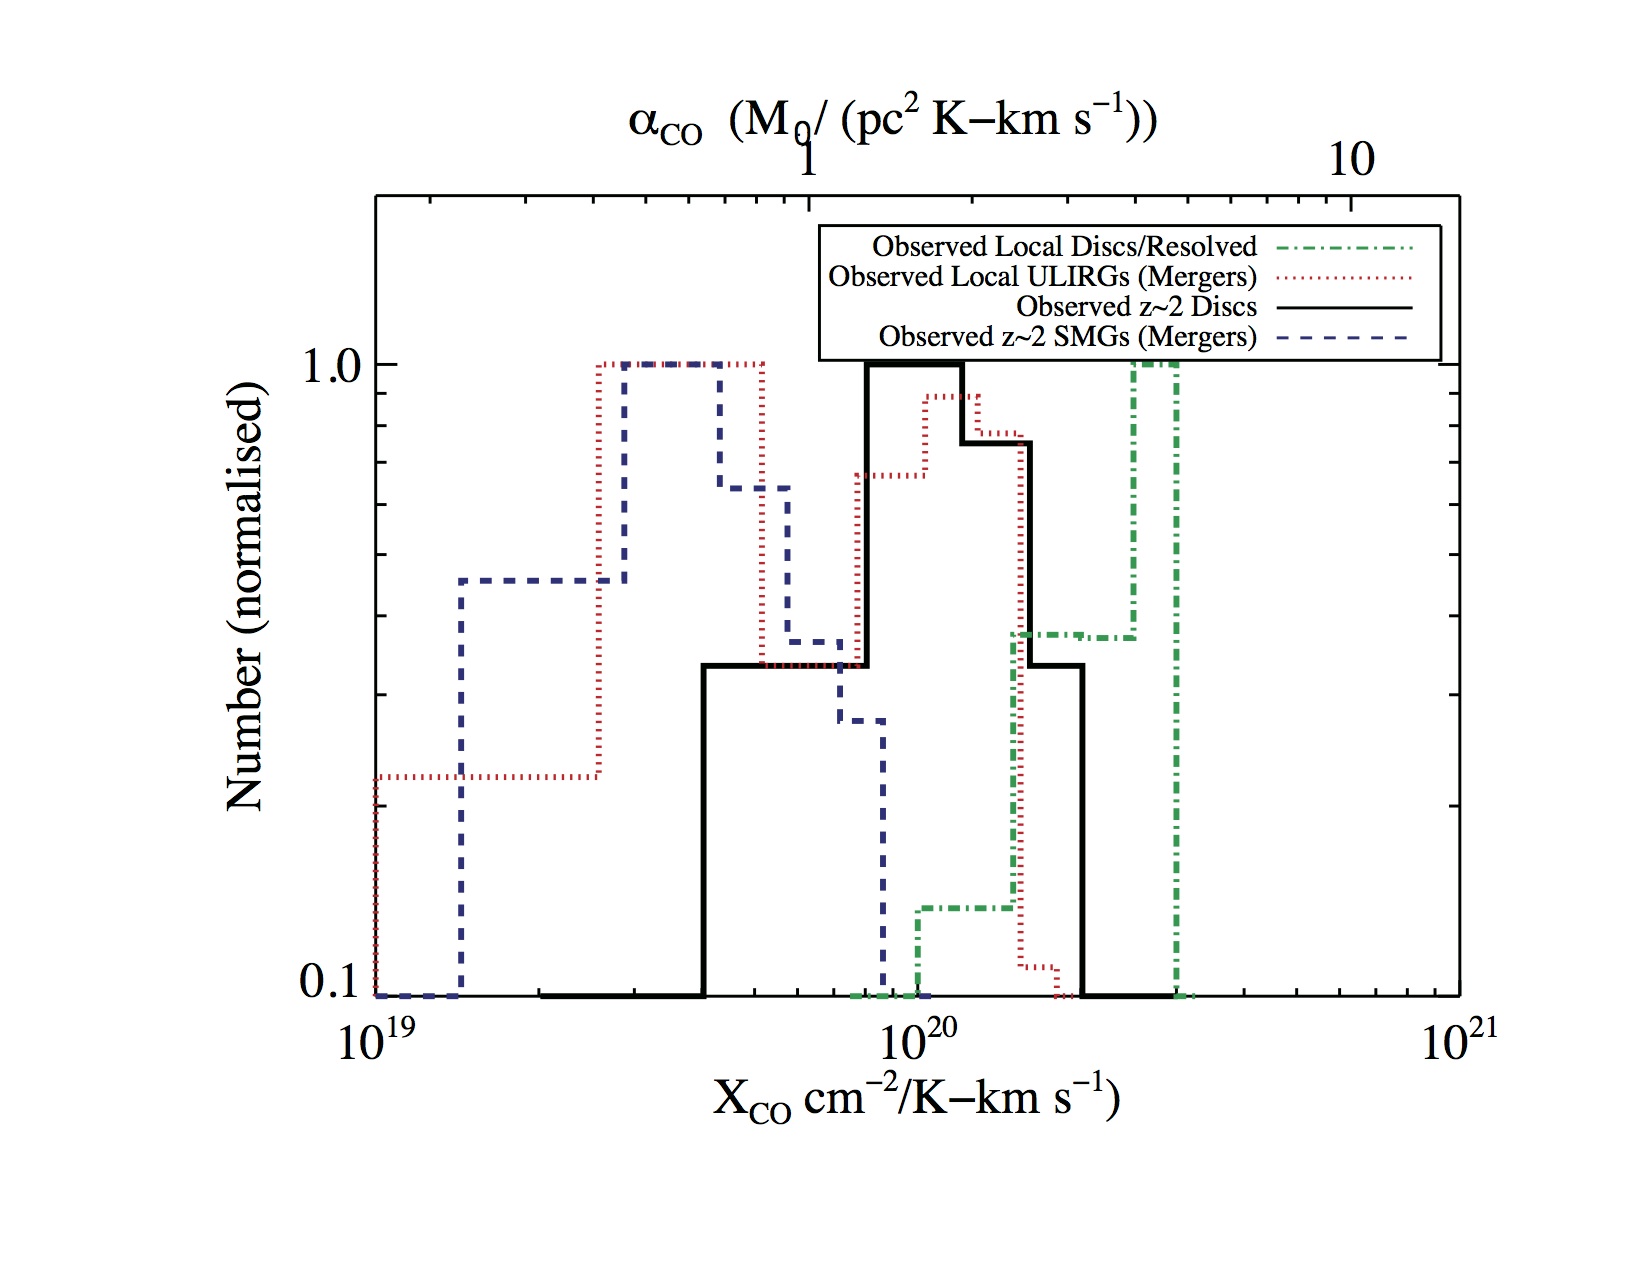
I show this more quantitatively in Figure 3 where I plot the distribution of derived values for all the galaxies in Figure 3. While there are clear trends such that disks have larger values than mergers on average, there is substantial distribution among the more heavily star-forming galaxies. High- disks can have values ranging from the mean Milky Way value to values representative of 0 ULIRGs. Low- ULIRGs on average have lower -factors, though there is a tail toward larger values. There is some tentative observational evidence for all of these trends in surveys of both high- disks, as well as low- ULIRGs (e.g. Magdis et al. 2011; Papadopoulos et al. 2012).
The index of 2 in the inferred power-law when utilizing our derived model for may be telling about the underlying physics that regulates the star formation rate in heavily star-forming systems. Ostriker & Shetty (2011) and Shetty & Ostriker (2012) present a model in which, if supernova-driven turbulence controls the SFR and gas dominates the vertical gravity, the SFR surface density will scale with the gas surface density as a quadratic, similar to the derived relation in the right panel of Figure 2. This sort of scenario is aimed at describing SFRs in starburst systems. I note that a simple fit to the KS relation at a transition molecular gas surface density of pc-2 for the data in the right panel of Figure 2 results in a roughly linear relation for galaxies with pc-2, and exponent for galaxies above this threshold. This is the surface density above which GMCs are potentially no longer regulated by internal processes (Krumholz et al. 2009; Narayanan & Hopkins 2012; Hopkins et al. 2012a), and global galactic processes may be significant in dictating the structure of the ISM.
5 The Baryonic Gas Fractions of High- Galaxies
With a model for the formation of high- starburst galaxies, as well as the CO-H2 conversion factor in galaxies, we are now in a position to understand the baryonic gas fractions of high- galaxies. As shown in recent surveys by Tacconi et al. (2010) and Daddi et al. (2010b), among others, the gas fractions of 2 galaxies (ranging from 2 disks to SMGs) are larger than the seen in the local Universe. Gas fractions ranging from have been observed. Similarly, most cosmological galaxy formation models suggest that galaxies at high redshift should have higher gas fractions than those today. While the SFRs (i.e. gas consumption rates) are on average larger, so is the gas accretion rate from the IGM (e.g. Lagos et al. 2011, as well as the contribution to these proceedings by Lagos). A generic feature of these simulations is that the gas fractions of galaxies should decrease monotonically with increasing galaxy SFR, a trend that has been observed in high- galaxies (Tacconi et al. 2012).
However, there is a tension between observations and simulations such that the observed gas fractions of high- galaxies are all a factor larger at a given stellar mass than those in models. This is difficult to reconcile. The gas accretion rate in simulations is principally determined by gravity. So, unless the star formation rates in simulations were substantially reduced, it would be difficult to bring the gas fractions into agreement¶¶¶One other possibility that we do not explore in this proceeding is the impact of increasing wind energetics. This would, however, impact a host of observations including the mass-metallicity relation in galaxies, as well as IGM metal enrichment. As such, strong increases to feedback strength should be treated with caution.. There is not much wiggle room, however. The SFRs in simulated galaxies already lie below those observed (that is, the simulated “main sequence” of galaxies is lower in normalization than what is observed at 2; Davé 2008; Narayanan & Davé 2012, 2012). So, bringing the gas fractions into agreement via a decrease in the simulated SFRs would only serve to further exacerbate this issue.
One possibility is that the inferred gas masses from high- galaxies are systematically too large based on the usage of locally-calibrated CO-H2 conversion factors. As is clear from Figure 3, the average -factor of star-forming disks at 2 is a factor lower than the mean Milky Way value. Since mean Galactic values of are typically applied to high- disks, this is one potential solution to the discrepancy between observed gas fractions at high- and simulated ones.
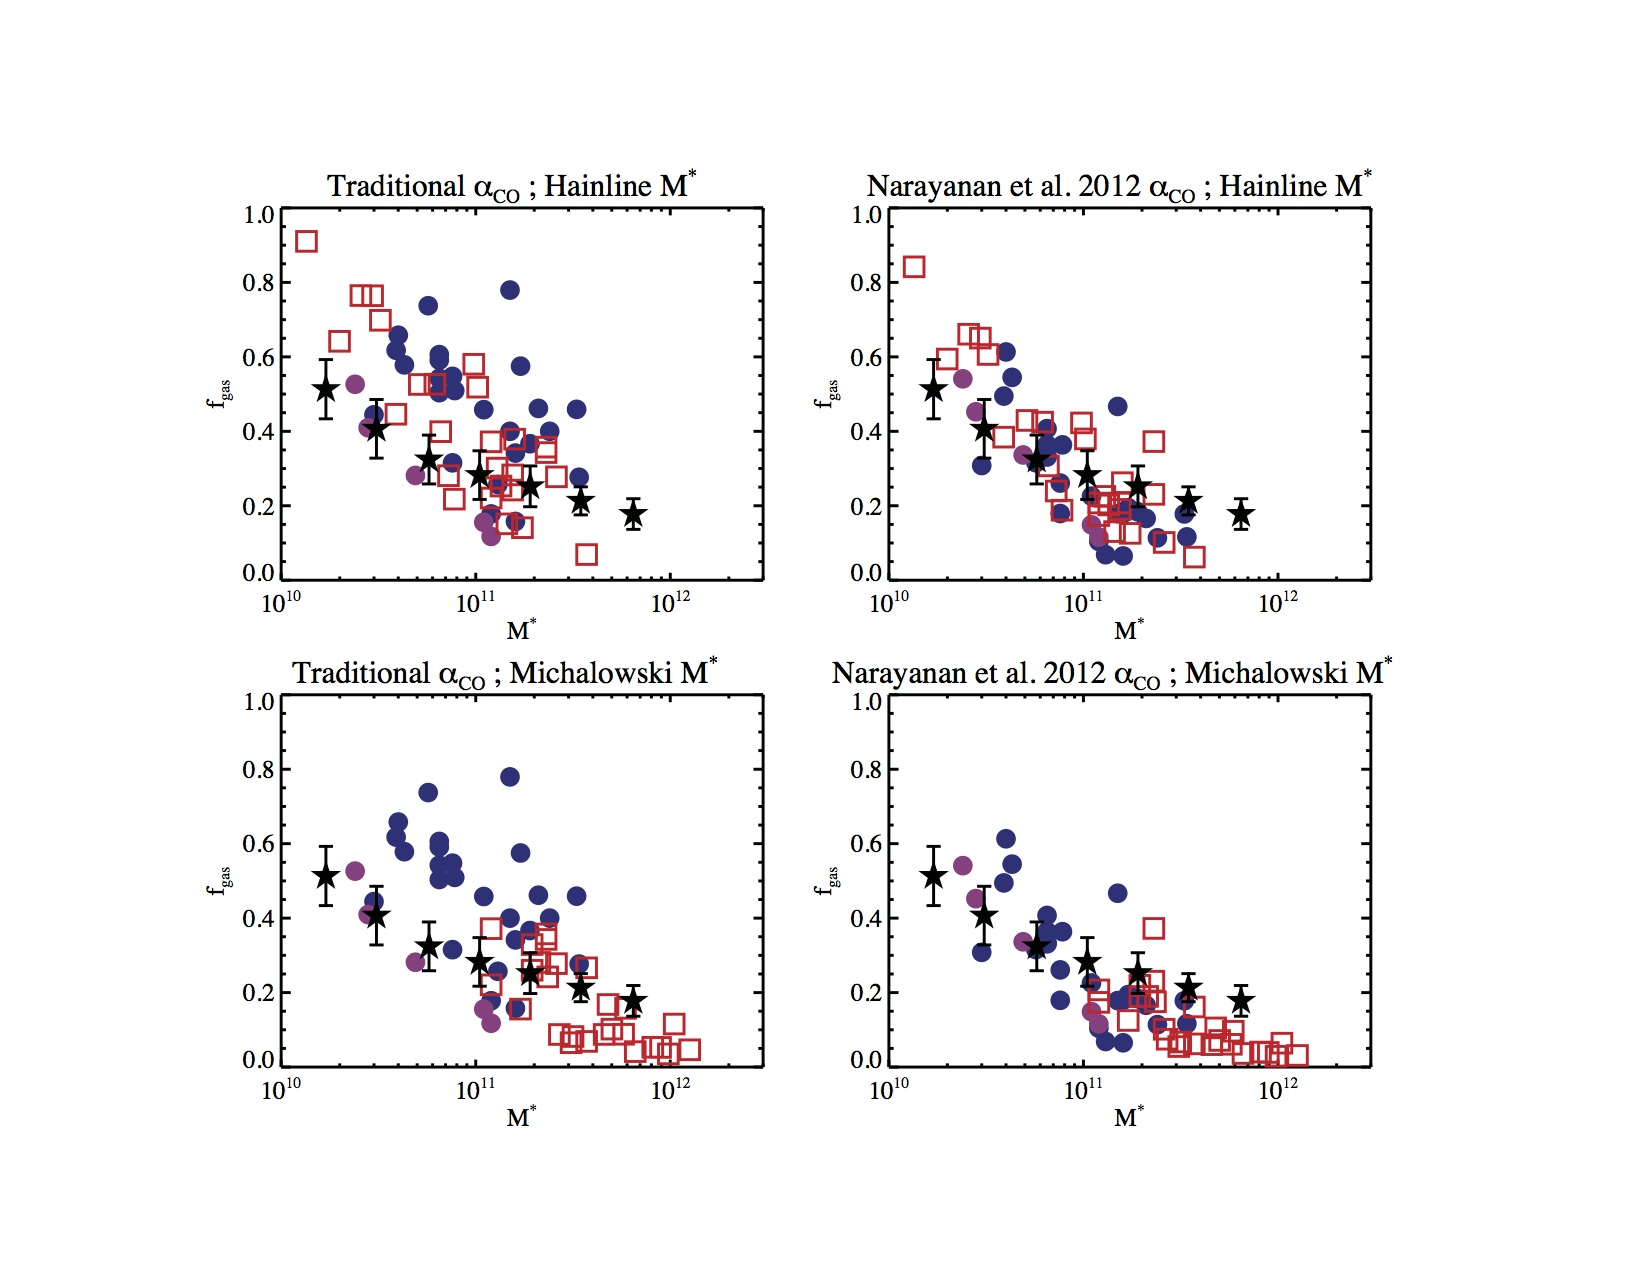
In Figure 4, I show the effect of applying our functional form of (which is a smoothly varying conversion factor that depends on the physical conditions in the galaxy) to the inferred gas fractions of 2 disks and starbursts (as before, denoting disks with circles, and starbursts with squares). I plot in terms of two different stellar mass measurements for the high- SMGs as there is a significant debate in the literature as to the precise values of these masses which can differ by a factor . This figure was first presented in Narayanan et al. (2012a). The top row utilizes the Hainline et al. (2011) stellar masses for high- SMGs (the open red squares), while the bottom row utilizes the Michałowski et al. (2012) masses. The black stars denote the median gas fractions (binned by stellar mass) from the cosmological simulations of Davé et al. (2011). The effect of using our model for is qualitatively the same in both cases. While the inferred gas fractions are systematically larger than what is predicted from cosmological simulations when using the canonical values for -factors, our functional form brings them into significantly better agreement. Moreover, the scatter is reduced by a factor . Again, this owes to lower CO-H2 conversion factors in high-redshift disk galaxies that have warm, high-velocity dispersion molecular gas that is marginally unbound.
6 Conclusions
We have presented a model aimed at understanding the star formation properties of some of the more enigmatic star forming galaxies in the Universe, the high-redshift Submillimeter Galaxy population. One of the principle results of this work is a placement of high-redshift starburst galaxies on the Kennicutt-Schmidt star formation law. To do this required (i) a formation model for high- Submillimeter Galaxies and (ii) a model for the CO-H2 conversion factor in order to convert the observed CO line emission from these galaxies into an H2 gas mass.
We find that Submillimeter galaxies are a mixed bag of sources, comprised of (heavily star-forming) isolated disk galaxies at the faint end, merger-driven starbursts at the bright end, and galaxy pairs contributing heavily to the intermediate flux density regime. This model is able to reasonably reproduce the observed number counts, CO properties, and UV-mm wave SED.
We combine this with a model for the CO-H2 conversion factor in galaxies that describes the smooth evolution of the conversion factor with the physical properties in galaxies. The dominant physical drivers in the -factor in our model are the gas kinetic temperature, velocity dispersion and metallicity. We derive a functional form for the conversion factor in terms of observables: the gas phase metallicity and the CO surface brightness.
We then apply these models to literature observations of both local and high- galaxies. We find that galaxies from =0-2 lie on a unimodal star formation law, with best fit power-law index (over the entire dynamic range of observations) of . Similarly, we find that the usage of our model form for implies large gas fractions for 2 galaxies () though a factor lower than what would be inferred with locally-calibrated CO-H2 conversion factors.
Acknowledgments
I am very much appreciative to the conference organizers for inviting me to this exciting meeting. It was an honor giving a review talk at a meeting dedicated to the work of Paul Vanden Bout, who has contributed so much to this field. Much of this research was done in very fun collaborations with Chris Hayward, Mark Krumholz, Eve Ostriker, Lars Hernquist, and Romeel Davé. Finally, thanks to the NSF for funding this work via grant AST-1009452.
References
- Alaghband-Zadeh et al. (2012) Alaghband-Zadeh, S., et al. 2012, MNRAS, 424, 2232
- Blanc et al. (2012) Blanc, G., et al. 2012, ApJ, 764, 117
- Brown & Vanden Bout (1991) Brown, R. L. & Vanden Bout, P. A. 1991, AJ, 102, 1956
- Bussmann et al. (2008) Bussmann, R. S., Narayanan, D., Shirley, Y. L., Juneau, S., Wu, J., Solomon, P. M., Vanden Bout, P. A., Moustakas, J., & Walker, C. K. 2008, ApJ, 681, L73
- Daddi et al. (2010b) —. 2010b, ApJ, 713, 686
- Daddi et al. (2010a) Daddi, E. et-al.. 2010a, ApJ, 714, L118
- Davé (2008) Davé, R. 2008, MNRAS, 385, 147
- Davé et al. (2010) Davé, R., Finlator, K., Oppenheimer, B. D., et al. 2010, MNRAS, 404, 1355
- Davé et al. (2011) Davé, R., Finlator, K., & Oppenheimer, B. D. 2011, MNRAS, 416, 1354
- Davé et al. (2011) Davé, R., Finlator, K., & Oppenheimer, B. D. 2011, arXiv/1108.0426
- Downes & Solomon (1998) Downes, D. & Solomon, P. M. 1998, ApJ, 507, 615
- Engel et al. (2010) Engel H. et al., 2010, ApJ, 724, 233
- Glover & Mac Low (2011) Glover, S. C. O. & Mac Low, M.-M. 2011, MNRAS, 412, 337
- Hainline et al. (2011) Hainline, L. J., et-al. 2011, ApJ, 740, 96
- Hayward et al. (2011) Hayward C. C., Kereš D., Jonsson P., Narayanan D., Cox T. J., Hernquist L., 2011, ApJ, 743, 159
- Hayward et al. (2010) Hayward C. C., Narayanan D., Jonsson P., Cox T. J., Kereš D., Hopkins P. F., Hernquist L., 2010, Conference Proceedings for UP2010: Have Observations Revealed a Variable Upper End of the Initial Mass Function? Treyer, Lee, Seibert, Wyder, Neil eds. arXiv/1008.4584
- Hayward et al. (2012a) Hayward C. C., Jonsson P., Kereš D., Magnelli B., Hernquist L., Cox T. J., 2012a, MNRAS, 424, 951
- Hayward et al. (2012b) Hayward C. C., Narayanan D., Kereš D., Jonsson P., Hopkins P. F., Cox T. J., Hernquist L., 2012b, arXiv/1209.2413
- Hodge et al. (2012) Hodge, J. A., Carilli, C. L., Walter, F., et al. 2012, ApJ, 760, 11
- Hopkins et al. (2010) Hopkins, P. F., Younger, J. D., Hayward, C. C., Narayanan, D., & Hernquist, L. 2010, MNRAS, 402, 1693
- Hopkins et al. (2012a) Hopkins, P. F., Narayanan, D., Murray, N., & Quataert, E. 2012, arXiv/1209.0459
- Hopkins et al. (2013a) Hopkins, P. F., et al. 2013a, arXiv/1301.0841
- Hopkins et al. (2013b) Hopkins, P. F., et al. 2013b, arXiv/1206.0011
- Geach et al. (2011) Geach, J. E., Smail, I., Moran, S. M., MacArthur, L. A., Lagos, C. d. P., & Edge, A. C. 2011, ApJ, 730, L19
- Genzel et al. (2010) Genzel, R. et al. 2010, MNRAS, 407, 2091
- Guo & White (2008) Guo, Q., & White, S. D. M. 2008, MNRAS, 384, 2
- Ivison et al. (2013) Ivison, R., et al. 2013, arXiv:1302.4436
- Jonsson et al. (2010) Jonsson P., Groves B. A., Cox T. J., 2010, MNRAS, 186
- Juneau et al. (2009) Juneau, S., Narayanan, D. T., Moustakas, J., Shirley, Y. L., Bussmann, R. S., Kennicutt, R. C., & Vanden Bout, P. A. 2009, ApJ, 707, 1217
- Krumholz et al. (2008) Krumholz, M. R., McKee, C. F., & Tumlinson, J. 2008, ApJ, 689, 865
- Krumholz et al. (2009) —. 2009, ApJ, 693, 216
- Krumholz et al. (2009) Krumholz, M. R., McKee, C. F., & Tumlinson, J. 2009, ApJ, 699, 850
- Krumholz et al. (2011) Krumholz, M. R., Leroy, A. K., & McKee, C. F. 2011, ApJ, 731, 25
- Leroy et al. (2011) Leroy, A. K., et al. 2011, ApJ, 737, 12
- Lagos et al. (2011) Lagos, C. D. P., Baugh, C. M., Lacey, C. G., Benson, A. J., Kim, H.-S., & Power, C. 2011, MNRAS, 418, 1649
- Magdis et al. (2011) Magdis, G. E., Daddi, E., Elbaz, D., et al. 2011, ApJ, 740, L15
- Michałowski et al. (2012) Michałowski, M. J., Dunlop, J. S., Cirasuolo, M., Hjorth, J., Hayward, C. C., & Watson, D. 2012, A&A, 541, A85
- Narayanan et al. (2012a) Narayanan D., Bothwell M., Davé R., 2012a, MNRAS, 426, 1178
- Narayanan et al. (2008a) Narayanan, D., Cox, T. J., & Hernquist, L. 2008a, ApJ, 681, L77
- Narayanan et al. (2008b) Narayanan, D., Cox, T. J., Shirley, Y., Davé, R., Hernquist, L., & Walker, C. K. 2008b, ApJ, 684, 996
- Narayanan et al. (2009) Narayanan, D., Cox, T. J., Hayward, C. C., Younger, J. D., & Hernquist, L. 2009, MNRAS, 400, 1919
- Narayanan et al. (2010a) Narayanan D. et al., 2010a, MNRAS, 407, 1701
- Narayanan et al. (2010b) Narayanan D., et-al., 2010b, MNRAS, 401, 1613
- Narayanan et al. (2011a) Narayanan, D., Krumholz, M., Ostriker, E. C., & Hernquist, L. 2011a, MNRAS, 418, 664
- Narayanan (2011) Narayanan, D. 2011b, arXiv/1112.1073
- Narayanan et al. (2011c) Narayanan, D., Cox, T. J., Hayward, C. C., & Hernquist, L. 2011c, MNRAS, 412, 287
- Narayanan et al. (2012) Narayanan, D., Krumholz, M. R., Ostriker, E. C., & Hernquist, L. 2012, MNRAS, 421, 3127
- Narayanan & Hopkins (2012) Narayanan, D., & Hopkins, P. 2012, arXiv:1210.2724
- Narayanan & Davé (2012) Narayanan D., Davé R., 2012a, MNRAS, 423, 3601
- Narayanan & Davé (2012) Narayanan D., Davé R., 2012b, arXiv:1210.6037
- Noeske et al. (2007a) Noeske, K. G. et al. 2007a, ApJ, 660, L47
- Noeske et al. (2007b) —. 2007b, ApJ, 660, L43
- Ostriker & Shetty (2011) Ostriker, E. C., & Shetty, R. 2011, ApJ, 731, 41
- Papadopoulos et al. (2012) Papadopoulos, P. P., van der Werf, P., Xilouris, E., Isaak, K. G., & Gao, Y. 2012, ApJ, 751, 10
- Sandstrom et al. (2012) Sandstrom, K., et al. 2012, arXiv:1212.1208
- Shapley (2011) Shapley, A. E. 2011, ARA&A, 49, 525
- Shetty & Ostriker (2012) Shetty, R., & Ostriker, E. C. 2012, ApJ, 754, 2
- Solomon & Vanden Bout (2005) Solomon, P. M. & Vanden Bout, P. A. 2005, ARA&A, 43, 677
- Tacconi et al. (2010) Tacconi, L. J., Genzel, R., Neri, R., et al. 2010, Nat, 463, 781
- Tacconi et al. (2012) Tacconi, L. J., Neri, R., Genzel, R., et al. 2012, arXiv:1211.5743
- Wolfire et al. (2010) Wolfire, M. G., Hollenbach, D., & McKee, C. F. 2010, ApJ, 716, 1191