Physics at CERN’s Antiproton Decelerator
Abstract
The Antiproton Decelerator (AD) facility of CERN began operation in 1999 to serve experiments for studies of invariance by precision laser and microwave spectroscopy of antihydrogen () and antiprotonic helium () atoms. The first 12 years of AD operation saw cold synthesized by overlapping clouds of positrons () and antiprotons () confined in magnetic Penning traps. Cold was also produced in collisions between Rydberg positronium () atoms and . Ground-state was later trapped for up to s in a magnetic bottle trap, and microwave transitions excited between its hyperfine levels. In the atom, deep ultraviolet transitions were measured to a fractional precision of (2.3–5) by sub-Doppler two-photon laser spectroscopy. From this the antiproton-to-electron mass ratio was determined as 1836.1526736(23), which agrees with the value known to a similar precision. Microwave spectroscopy of yielded a measurement of the magnetic moment with a precision of . More recently, the magnetic moment of a single confined in a Penning trap was measured with a higher precision, as in nuclear magnetons. Other results reviewed here include the first measurements of the energy loss () of 1–100 keV traversing conductor and insulator targets; the cross sections of low-energy ( keV) ionizing atomic and molecular gas targets; and the cross sections of 5-MeV annihilating on various target foils via nuclear collisions. The biological effectiveness of beams destroying cancer cells was measured as a possible method for radiological therapy. New experiments under preparation attempt to measure the gravitational acceleration of or synthesize . Several other future experiments will also be briefly described.
1 Introduction
The Antiproton Decelerator (AD) facility of CERN [1, 2] began operation in 1999 to carry out high-precision laser spectroscopy of antihydrogen () and antiprotonic helium () atoms. It was envisaged that by comparing the characteristic transition frequencies of these atoms with the corresponding ones for hydrogen (H) in the case, or quantum electrodynamics (QED) calculations in the case at the highest possible precision, the consistency of invariance could be tested. This invariance is deeply engrained within the Standard Model of particle physics, and implies that particles and their antiparticle counterparts should have exactly the same mass, and charges and magnetic moments of the same values but opposite signs. Atoms should resonate at exactly the same frequency as ”anti-atoms” made of antiparticles.
Precision laser and microwave spectroscopy of atoms and ions of ordinary matter have been carried out for more than 50 years, and in recent years have achieved such a high level of sophistication that transition frequencies have routinely been measured with an experimental precision of better than . This precision exceeds even the precision by which the international definition of the second can be currently determined. Some experiments are sensitive to minute shifts in the frequencies due to the effects of General Relativity. Progress on the anti-atom side is much more difficult due to the simple fact that cold samples are so difficult to synthesize in large quantities. The constituent antiprotons () and positrons () can only be produced in very small quantities in laboratory nuclear reactions at MeV or GeV energy scales. These particles cannot be directly used to form stationary atoms that can be used for precision spectroscopy, since their kinetic energy exceeds the eV-scale binding energy by orders of magnitude. So first the and must be collected using various experimental techniques, and cooled in some cases by 10 orders of magnitude. In fact for achieving the highest possible experimental precision, one needs the coldest atoms ( K) where the Doppler effect on the measured atomic frequencies caused by thermal motions is minimized.
The AD is currently the world’s only facility where of low ( MeV) energy needed for these experiments can be produced. Important milestones achieved at the AD include the production of [3, 4, 5, 6] in magnetic Penning traps. The were later produced at cryogenic temperatures [7], and confined for s in a magnetic bottle trap [8, 9, 10]. The first microwave excitations between the ground-state hyperfine substates of were recently demonstrated [11].
For [12], the atomic transition frequencies were measured by single [13, 14, 15] and sub-Doppler two-photon [16] laser spectroscopy to a fractional precision of . By comparing the experimental results with QED calculations [17], the antiproton-to-electron mass ratio was determined as [16]. Microwave spectroscopy of allowed the determination of the magnetic moment with a precision of [18]. This agreed with the magnetic moment values derived from previous X-ray spectroscopy experiments on antiprotonic lead atoms with a similar level of precision [19].
The magnetic moment of a single confined in a Penning trap was recently measured with a much higher precision, as [20] in nuclear magnetons. This agreed with the known proton value with a fractional precision of . This experiment employed the continuous Stern-Gerlach effect, where an inhomogeneous magnetic field of a so-called ”magnetic bottle” was superimposed on the Penning trap. Spin-flips of the resonating with an external RF field were then revealed as small shifts in the oscillation frequency of the ’s axial motion in the trap.
Measurements of various atomic [21, 22, 23, 24, 25] and nuclear [26] collision cross sections using low-energy were also carried out. One experiment studied the biological effectiveness of beams destroying cancer cells [27]. In this paper, we review these experimental results obtained during the first 12 years of AD operation.
The AD was conceived as an economical replacement for the previous Low Energy Antiproton Ring (LEAR) facility of CERN, which was shut down in 1996 [1, 2, 28]. LEAR carried out pioneering studies on violation, meson spectroscopy, and nuclear reactions using high-intensity beams of circulating inside the storage ring, or extracted as a continuous beam of up to s-1. The high intensity was often needed because of the small cross sections involved in these particle and nuclear physics experiments. The facility involved, however, a complex chain of four storage rings (Antiproton Collector (AC), Antiproton Accumulator (AA), Proton Synchrotron (PS), and LEAR) which handled the sequence of first producing the , accumulating and decelerating them to lower energies, and delivering them to experiments. The AD on the other hand was optimized for precision atomic-physics experiments that were assumed to require far fewer per unit time. This allowed CERN engineers to devise a simplified all-in-one machine where the same sequence was handled by a single storage ring with a cycle time of only s. The AD now routinely provides pulsed beams containing with an emittance of 2–3 mm mrad and rate of 0.01 Hz.
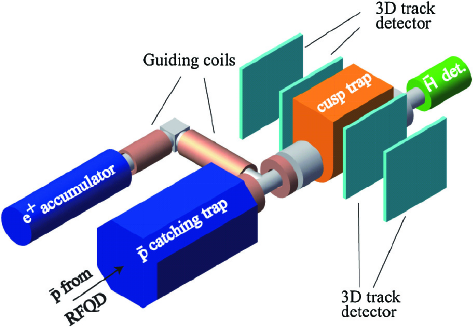
Much of the experimental work at AD has concentrated on developing the techniques to decelerate and cool larger numbers of . The cold were then used as one of the ingredients to synthesize , first by the ATHENA (AnTiHydrogEN Apparatus) [3] collaboration followed by the ATRAP [4] collaboration in 2002. More recently, ALPHA (Antihydrogen Laser Physics Apparatus) and ATRAP have cooled clouds of – confined in magnetic Penning traps to cryogenic temperatures –10 K [29, 30]. A small percentage of the synthesized using such cold were of sufficiently low ( K) temperature that could be subsequently confined in a magnetic trap [8, 9, 10]. The ASACUSA (Antiproton Spectroscopy And Collisions Using Slow Antiprotons) experiment introduced a radiofrequency quadrupole decelerator (RFQD) in collaboration with CERN [31, 32]. This 3-m-long device decelerated the 5.3-MeV arriving from AD to keV with a high () efficiency [14]. The resulting low-energy beam was allowed to come to rest in a helium target, thereby synthesizing atoms which were studied by two-photon laser spectroscopy [16]. The were also confined in a Penning trap [33], and extracted as a continuous beam with an energy of keV and average rate 6000–7000 s-1. The ionization cross sections of colliding with gas targets were measured using this beam [24, 25]. Work is also underway to produce high-intensity spin-polarized beams in the future, which may be used to measure the ground-state hyperfine structure of . Future experiments on the gravitational acceleration of pursued by the AEIS(Antihydrogen Experiment: Gravity, Interferometry, Spectroscopy) [34, 35] and GBAR (Gravitational Behavior of Antihydrogen at Rest) [36] collaborations would require beams of even lower (mK-scale) energies.
Following these developments by the AD collaborations, CERN has recently begun the construction of a new synchrotron ELENA (Extra-Low ENergy Antiproton ring) of 30-m circumference, which would capture the 5.3-MeV provided by AD and decelerate them to keV [37]. Unlike the RFQD described above, ELENA will reduce the momentum spread of the using electron cooling techniques, thereby achieving a transverse beam emittance of mm mrad. The number of captured in Penning traps per unit time can then be increased by a factor for the AEIS, ALPHA, and ATRAP collaborations which now use the 5.3-MeV beam.
This article is organized in the following way. In Sect. 2, we briefly describe past experimental and theoretical work on symmetry pertaining to atomic physics experiments involving . The AD facility is described in Sect. 3. In Sect. 4, progress in production, trapping, and microwave spectroscopy made at the AD are outlined. Sect. 5 summarizes the results of precision laser and microwave spectroscopy of . Measurements of the magnetic moment by inducing spin-flips of a single confined in a Penning trap carried out by ATRAP are described in Sect. 6. Atomic and nuclear collision experiments using low-energy are described in Sect. 7. Experiments to measure the biological effectiveness of destroying cancer cells are also presented in the same section. In Sect. 8, future experiments are outlined including, i): laser spectroscopy of , ii): higher-precision measurements on the ground-state hyperfine structure of , iii): gravitational acceleration of , iv): antiproton-to-electron mass ratio determined by sub-ppb-scale laser spectroscopy of , v): sub-ppm-scale measurements of the magnetic moment in Penning traps pursued by ATRAP and a new collaboration BASE (Baryon Antibaryon Symmetry Experiment), vi): differential cross sections of 100-keV circulating in a new storage ring (ELENA), ionizing atoms and molecules contained in a gas jet target. The new ELENA facility, now under construction at CERN, is also described in the same section.
2 symmetry and low-energy antiproton physics
2.1 Antiparticles and symmetries
The Dirac equation implies that for every variety of fermion observed in nature, there is a corresponding antifermion with the same mass and opposite electric charge. Some MeV of energy is needed to produce an - pair, which is readily available in small accelerators. The can also be produced by radioactive isotopes that undergo decay. When are allowed to come to rest in matter, they annihilate with atomic via the electromagnetic interaction, which results in the emission of 2–3 gamma-rays.
The production of - pairs, on the other hand, requires much higher energies of GeV; this is typically accomplished by colliding beams of GeV protons on metallic targets. Thus there are only a few large-scale synchrotron facilities where can be produced. A annihilation with a or neutron () proceeds via strong interaction, and typically results in the emission of several charged and neutral pions (, , and ) within a picosecond. Low-energy and , on the other hand, can elastically scatter off each other without annihilating, a characteristic which is used to cool confined in storage rings and traps.
The properties of particle and antiparticle are related by discrete symmetries [38] in the Standard Model. The substitution of the wavefunction of a particle with its antiparticle can be carried out using the charge conjugation operator . This changes the signs of all additive quantum numbers (electric and flavor charges, and baryon and lepton numbers), while keeping space-time properties (mass, energy, momentum, and spin) as well as multiplicative quantum numbers (parity) unchanged. Experimental evidence shows that the laws of electromagnetism, gravity, and strong interaction are invariant under this particle-to-antiparticle transformation (-symmetry), and also preserve the , , and combined symmetries. The operator here reverses the space coordinates from right handed to left handed; the time reversal operator inverts the flow of time, so that the direction of motion and the signs of all time derivatives such as momentum and angular momentum are reversed. Violations of the and symmetries in the strong interaction would cause to have a non-zero value of the electric dipole moment (EDM) [39], but no EDM has been detected so far to an upper limit of ecm [40].
As discovered in the 1950’s, however, the and symmetries are maximally violated in weak interactions: no antineutrinos with left-handed (LH) chirality, which results from the application of either the -operator on normal LH neutrinos, or the -operator on right-handed (RH) antineutrinos, have ever been experimentally detected. The Standard Model postulates that, i): the W± bosons which mediate the charged weak force interact only with LH fermions or RH antifermions, and ii): the neutral boson interacts with charged leptons and quarks of both chiralities with different strengths; and only with LH neutrinos or RH antineutrinos, but not their respective RH and LH counterparts.
The weak interaction also violates and symmetries. One of the mass eigenstates of neutral kaons normally decays either semileptonically, or hadronically into combinations of three neutral and charged pions ( or ) which comprise a eigenstate of -1. A small fraction (), however, was found to decay into or pairs [41, 42, 43] with , which violates the symmetry. Asymmetries were also recently observed in the rates of some decay modes of [44, 45] and tentatively [46] and [47] mesons compared to their antiparticle cases. violation is incorporated into the Standard Model in the following way: the three generations of quarks are assumed to change their flavor only through interactions with bosons (e.g., ). Nine such pairings between parent and daughter quark states are then possible. The phenomenological 33 Cabibbo-Kobayashi-Maskawa matrix used to describe the coupling constants of these 9 quark- pairings contains complex components that violate symmetry, giving rise to the asymmetries in the meson decays. The violations measured in the latest experiments, however, are too small to account for the predominance of matter over antimatter in the universe. It is also not understood why the strong interaction between the quarks does not exhibit any observable violation so far.
On the other hand, the laws of physics are believed to be perfectly symmetric under the combined transformations of charge conjugation, parity, and time reversal, i.e., . In fact, symmetry was axiomatically proven [48, 49, 50, 51] to hold for any relativistic quantum field theory under a few basic assumptions, i): Lorentz invariance, ii): unitarity, i.e. the sum of all quantum-mechanical probabilities is conserved, iii): interactions are local, iv): flat space-time without strong gravitational fields. This is called the Schwinger-Lüders-Pauli, or , theorem.
An important consequence of symmetry is that particles and their antiparticles have exactly the same mass and lifetimes, and charges and magnetic moments of opposite sign and same absolute value. A particle propagating in free space can be treated mathematically as if it were an antiparticle of exactly the same mass and opposite charge moving backwards in space and time (Feynman-Stueckelberg interpretation). The operator relates the scattering matrix of a physical process to its inverse process , with all particles replaced by antiparticles and the spin components reversed. So whereas symmetry implies that the lifetimes (i.e., sum of all partial decay rates) of particle and antiparticle should be exactly the same, the partial decay rate of a particle decaying into a certain channel does not necessarily need to be equal to its antiparticle case.
2.2 Theories of possible violation
Although symmetry remains a fundamental property of relativistic quantum field theories, a large number of theoretical and experimental studies have explored its possible breakdown. Violation can be introduced by removing some of the assumptions underlying the theorem. Greenberg [52] showed that in any field theory involving local interactions where unitarity is preserved, violation can only occur if Lorentz invariance is violated as well. The converse is not true: Lorentz violation does not necessarily imply violation. In some theories [53] with nonlocal interactions or noncommutative space-time geometry, violation can occur without Lorentz violation.
Colladay and Kostelecký [54, 55] developed a generalized parameterization of an effective field theory called the Standard Model Extension (SME) that contains operators that break Lorentz and symmetries. This model encompasses the normal Standard Model and general relativity, and retains some of their important characteristics such as renormalizability, causality, and invariance and covariance under translations and rotations in the inertial frame of the observer. SME additionally assumes the existence of a tensor-like ”background field”, i.e., a preferred direction in the vacuum which is frozen and extends over all space and time. Lorentz and symmetries are spontaneously broken when two identical experiments which are sensitive to this background field are rotated or translated relative to each other while being studied by an inertial observer. The model is expressed by adding several Lorentz and -violating terms to the Standard-Model Lagrangian. Limits on the sizes of these coefficients can be experimentally determined by searching for couplings between the background fields and various particle properties such as spin or propagation direction [56]. Annual and sidereal variations should appear when the Earth rotates and revolves around the sun, changing the orientation of the experiment with respect to the field. No such unambiguous signal has been detected so far.
The axiomatic proofs of the theorem are invalid in the highly-curved space-time near black holes. Some quantum gravity theories [57, 58, 59] involve quantum fluctuations of space-time geometry that are singular, such as microscopic black holes with event horizons of Planck-scale ( m) sizes. These backgrounds cause an apparent violation of unitarity, since part of the information such as the quantum numbers of particles can disappear into the event horizon. Pure ground states of quantum gravity thus get mixed and become decoherent as time evolves, since parts of the quantum states are trapped into the event horizons. is obviously violated here since the -matrix of such a process cannot be inverted.
2.3 Cyclotron frequency of antiprotons in Penning traps
Before the construction of LEAR, the mass , charge , and magnetic moment of were relatively poorly known; the most precise experiments involved measuring the characteristic X-rays of various types of antiprotonic atoms [63, 64, 65, 66], and deducing , , and to a typical precision of around 1 part in –.
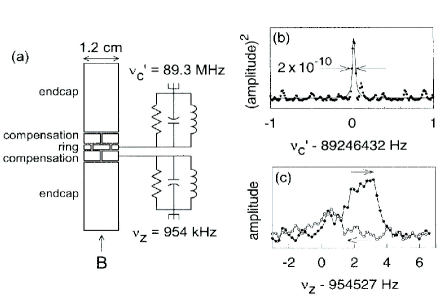
The precision on was greatly improved when the TRAP collaboration [67, 68, 69, 70, 71, 72] confined in a Penning trap (Fig. 1 (a)) for the first time. The cyclotron frequency of the was then determined, which is related to by,
| (1) |
Several types of Penning traps were constructed for these measurements, and they typically consisted of two static fields superimposed on each other: i): an uniform T magnetic field generated by a superconducting solenoidal magnet, and ii): an electrostatic quadrupole field produced by cylindrical ring electrodes of inner diameter cm stacked in series, with voltages of 0.3–20 V applied to them. The with MeV-scale energies entered the trap through a thin metallic window, from which they emerged with keV-scale energies. A small fraction of the were captured in the electrostatic potential well of the trap. They were then cooled to temperatures K by mixing them with confined simultaneously in the trap.
In practice, the cyclotron frequency is not one of the oscillation frequencies of the trapped , and therefore cannot be directly measured. Instead the executed three types of harmonic motion, i): harmonic axial motion along the direction of the magnetic field at frequency MHz, ii): trap modified cyclotron motion, a circular motion in a perpendicular plane at frequency MHz, iii): magnetron motion, a low-frequency kHz circular motion occurring in the same plane as the cyclotron motion. These motions induce image currents in the trap electrodes, which can be detected using tuned inductor-capacitor-resistor () resonance circuits connected to the trap electrodes. The signals were amplified by field effect transistors which were cryogenically cooled. The cyclotron frequency was then deduced from the three measured eigenfrequencies using the so-called “invariance theorem”,
| (2) |
This relationship between the four frequencies has been theoretically shown to be invariant to leading order, regardless of imperfections in the electric and magnetic fields in the trap. This fact allows to be determined to extremely high accuracy.
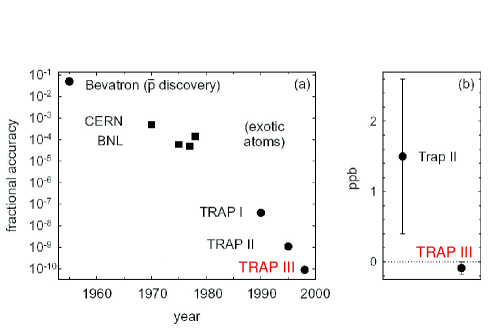
In Fig. 2 (a), the accuracies of experimental comparisons between and are shown as a function of years elapsed, including values from previous X-ray spectroscopy experiments of exotic atoms [63, 64, 65, 66]. The TRAP collaboration initially attained a precision of by measuring with a single trapped antiproton, then reversing the polarity of the electrostatic potential of the trap to confine a single and measure its frequency , using the techniques described above. This proton-antiproton comparison eliminated the necessity of measuring the magnetic field with a high absolute accuracy, but systematic errors associated with the reversal of the electrostatic potential needed to trap particles of opposite electric charge limited the experimental precision.
In later experiments [71], the precision was improved to by simultaneously trapping a and a ion in orbits with different cyclotron radii. The cyclotron frequencies of the two particles and could now be alternately measured without the polarity reversal. The measured value was then converted to the corresponding proton value using the known relationship between the two frequencies, . Later, it was pointed out that due to the fact that the two-body H- ion which undergoes cyclotron motion inside the trap experiences a Lorentz force and becomes slightly polarized, the value is shifted compared to its vacuum value [73]. From these considerations, the charge-to-mass ratios of protons and were experimentally constrained [71] as,
| (3) |
This constitutes one of the most stringent comparisons of particles and antiparticles in the baryon sector.
2.4 Antiproton lifetime
symmetry implies that particle and antiparticle decay with the same lifetimes. The lower limit for the lifetime is currently y. This was obtained by the SNO experiment [74] which searched for rays emitted from the deexcitation of any residual nucleus that would result from the decay of a or in 16O nuclei. The TRAP collaboration confined some for two months [69] in a Penning trap, without detecting any sizable annihilation with residual gases. By comparing the number of remaining after this 2-month period with the initial number loaded into the trap, a lower limit,
| (4) |
was obtained for the lifetime. The lifetime of high-energy circulating in a storage ring was also measured at CERN, first in the Initial Cooling Experiment facility [75, 76] and later at the Antiproton Accumulator [77]. The APEX collaboration used the Fermilab Antiproton Accumulator to search for 13 decay modes of [78]. A lower limit of y was set for one of the decays, .
2.5 Measurements of antiproton magnetic moment prior to AD era
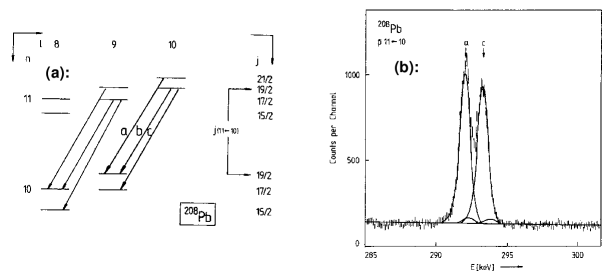
The PS186 collaboration of LEAR measured the magnetic moment of by X-ray spectroscopy of antiprotonic lead () atoms [19]. The experiment involved stopping some of energy –50 MeV in an isotopically pure 208Pb target. The resulting emitted characteristic X-rays as the cascaded radiatively through the atomic levels. X-rays with energies keV were detected by germanium semiconductor detectors surrounding the target. The value was determined by measuring the ”circular” (i.e., those between states with large principal and angular momentum quantum numbers) transitions and with a transition energy keV. The energy level diagram is shown in Fig. 3 (a). Since the spatial overlap between the and Pb nucleus was negligibly small for these states, effects due to the strong interaction could be ignored. The measured spectrum (Fig. 3 (b)) had a two-peak structure separated by an interval eV, which corresponded to the fine structure splitting arising from the interaction between the magnetic moment and its orbital angular momentum . By adjusting the -value used in theoretical QED calculations and perturbative evaluations [79, 80] to reproduce the measured splitting, a value
| (5) |
was obtained in nuclear magnetons. This agreed with the magnetic moment of [81],
| (6) |
with a precision of . The value is currently derived from measurements of the hyperfine splitting of H, using a maser in a variable magnetic field [82, 83].
2.6 Some other tests of symmetry
The neutral meson oscillates with its antiparticle with a frequency of 5 GHz via the weak interaction. The fact that one of the mass eigenstates of this system decays at a similar rate of GHz makes it possible to experimentally study these oscillations with a high precision by detecting the decay products. An analysis [38] combining the results of the CPLEAR, KLOE, KTeV, and NA48 experiments yielded a value,
| (7) |
at a confidence level of 95. This is commonly considered to be the most precise test of invariance involving mesons, although this evaluation critically depends on some assumptions [84] on the -violating parameters.
The relative mass difference between and have been constrained to a precision,
| (8) |
with a confidence level of 90. This result was obtained by employing laser spectroscopy to measure the 1-2 interval of positronium () with a precision of [85]. The measured atomic transition frequency was then compared with QED calculations to derive the above limit.
The Liquid Scintillator Neutrino Detector (LSND) collaboration reported an excess of found in a beam with a statistical significance of [86]. The data suggested flavor oscillations involving a mass-squared difference of the antineutrino mass eigenstates –10 eV2. This appeared to conflict with observations of atmospheric and solar neutrino experiments which imply much smaller values of eV2. The Booster Neutrino Experiment (MiniBooNE) also searched for the same oscillations, and recently reported results [87] consistent with LSND, i.e. eV2. This result had a confidence level when the data was analyzed in the context of a model involving the mixing of two neutrinos, but the excess events was also consistent with a null hypothesis at a 3 confidence level. Many theoretical groups have attempted to explain these anomalies by suggesting either the existence of a fourth sterile neutrino that does not weakly interact, or violation (e.g., that neutrinos and antineutrinos have different masses). The Main Injector Neutrino Oscillation Search (MINOS) collaboration measured the disappearance of using an accelerator beam. They initially reported and mixing angle values that differed by from the corresponding values [88]. This difference was reduced [89] to negligible levels after more statistics was recently collected.
3 Production of low-energy antiprotons
3.1 Antiproton Decelerator
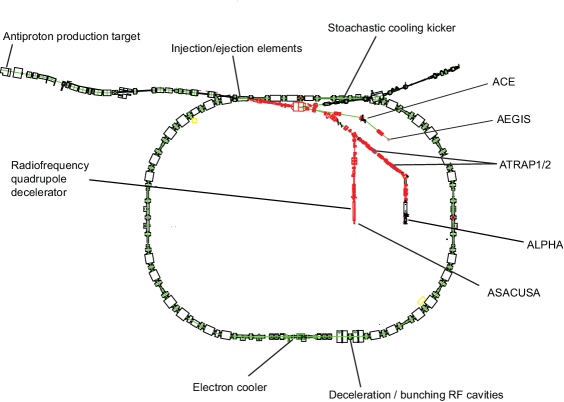
The Antiproton Decelerator (AD) [1, 2] is currently the world’s only source of low energy ( MeV) (Fig. 4). The are produced by colliding beams on an Ir target. In a small fraction of the collisions, the following reaction (or a similar one involving target ) occurs under the conservation requirements of energy, momentum, and nucleon number,
| (9) |
The minimum kinetic energy of the incoming needed for this is around GeV, whereas the and three emerge with laboratory energies GeV. The PS-AD combination uses higher energies ( GeV) to increase the production yield of , so that the emerge with a correspondingly higher energy GeV. This energy must be reduced by eight orders of magnitude before the can be used for the trap and atomic spectroscopy experiments described in this paper. A simple deceleration of a cloud containing number of , however, would lead to an adiabatic increase in its phase-space density defined as,
| (10) |
where and denote the horizontal and vertical emittances of the cloud, its longitudinal length, and the spread of the momentum distribution [90].
The AD (Fig. 4) is an oval-shaped, 188-m circumference synchrotron. It consists of four straight sections where the instruments needed for cooling (i.e., reduce the phase-space and increase the -value) of the beam, the RF cavities which decelerates the , and diagnostics equipment are placed. A series of dipole and quadrupole magnets in the four bending sections compensates the dispersion and chromaticity in the beam. Chromaticity here refers to the momentum dependence of the frequency of the transverse (e.g. betatron) oscillations in the circulating . These oscillations may cause the beam to increase in size and strike the inner walls of the synchrotron, unless they are compensated.
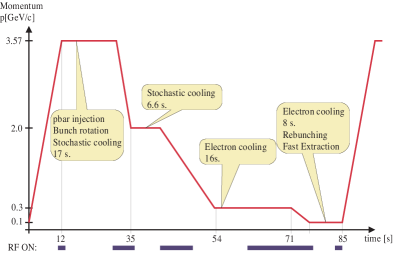
The AD decelerates and cools the [1, 2] over a 100-s cycle in the following way (Fig. 5), i): production and capture, a pulsed beam containing protons provided by the CERN Proton Synchrotron (PS) is allowed to strike a 50-mm-long Ir target, thereby producing a shower of that are focused into a parallel beam by a magnetic horn-type lens. This beam containing of momentum GeV/c, transverse emittance mm mrad, and momentum spread are injected into the AD, ii): RF bunch rotation, RF fields stretch the pulse lengths of these bunches of from m (corresponding to ns) to 190 m (150 ns). This stretching in the longitudinal direction conversely reduces the -value of the ensemble to , since the longitudinal emittance is typically conserved during such a procedure, iii): stochastic cooling and deceleration, so-called “pickup” electrodes located along the circumference of AD detects deviations and in the momenta and transverse positions of small subgroups of , relative to the mean values of all the orbiting . These signals are used to correct the orbits of the corresponding subgroups of , by applying electric pulses to steering electrodes located in the opposite side of the AD. Repeated corrections cause the beam to converge to an orbit with an emittance 3–4 mm mrad and . The are then decelerated to GeV/c and similarly cooled, iv): electron cooling, the are decelerated to another intermediate momentum MeV/c, and allowed to merge with a 20-mm-diameter beam of current A in a collinear configuration over a 2-m-long section of the AD. The and velocities are matched so that in the center-of-mass frame, the are bathed in a stationary cloud of low temperature. Coulomb collisions transfer the ”heat” of the to the . The are finally decelerated to MeV/c and electron-cooled to obtain a final emittance of mm mrad and momentum spread . At the end of the above 100-s cycle, a 100–200-ns-long beam containing of energy 5.3 MeV are ejected from AD. Magnetic beamlines transport the to one of four experimental zones located inside the AD (Fig. 4).
3.2 Radiofrequency quadrupole decelerator
CERN and the ASACUSA collaboration [32] developed a radiofrequency quadrupole decelerator (RFQD) which further reduced the 5.3-MeV energy of the arriving from the AD to even lower energies 10–120 keV needed for atomic physics experiments. As implied by Eq. 10, when particle beams are decelerated their physical emittance increases until they can be lost by, e.g., hitting the inner walls of the accelerator. To avoid this, the RFQD strongly focuses the beam in the transverse direction during deceleration. The RFQD consists of four 3.4-m-long rod electrodes arranged in a quadrupole configuration, which are excited by a quadrupole RF field of MHz (Fig. 6). The high field (corresponding to a voltage on the rod electrodes of kV) is achieved by placing the rods in a ladder-shaped cavity which resonates in the transverse electric quadrupole (TE210) mode. The injected axially into the -cm-diam aperture between the rods is thus alternately focused and defocused in the two transverse planes with a maximum electric field MV/m. This ”alternate gradient” focusing provides a net confining effect, which ensures that the follows orbits of small diameter that oscillate around the RFQD axis.
A series of peaks and troughs are machined on the surfaces of the electrode rods. The axial positions of the peaks are the same for opposing pairs of rod electrodes, but shifted by half a period between neighboring electrodes. This structure deviates a fraction of the transverse electric field into the longitudinal direction, and gives rise to a standing wave along the RFQD axis. This longitudinal component with a strength of a few MV/m decelerates the . The wavelength of this undulating electrode structure is adjusted to correspond to the flight distance of a during a single 202.5-MHz RF cycle. The -value gradually decreases along the length of the electrode as the beam is decelerated from MeV to keV along the RFQD.
The RFQD is operated in the following way. The 5.3-MeV extracted from AD first enters a so-called RF ”bunching” cavity excited at MHz which is located some 3 m upstream of the RFQD. This shapes the beam into a train of 30 micropulses with a pulse length of ps. This bunching of the beam is needed to move the into the longitudinal acceptance of the RFQD defined by the RF phase. Of the that entered the RFQD, some are decelerated to an energy keV. This energy can be varied between and 120 keV by biasing the electrodes of the RFQD with a DC potential. An additional energy-correcting RF cavity at the input of the RFQD is used to compensate for the changes in the energy of the incident beam resulting from this DC biasing, and variations in the energy of the extracted from the AD. The majority of the () misses the longitudinal acceptance and emerges with little or no deceleration. Measurements show that the decelerated beam has a typical emittance of up to 100 mm mrad.
4 Antihydrogen
The atom is a pure antimatter system which is stable and electrically neutral. Narrow electromagnetic resonances can be readily excited between its internal energy levels by laser or microwave irradiation. These characteristics should in principle allow tests of symmetry (Sect. 2) to be carried out with unprecedented experimental precision. Perhaps even more fascinating is the prospect of investigating antimatter gravity using . Both types of future experiments will be discussed in Sect. 8.
4.1 Production of fast antihydrogen atoms
In the first generation of experiments, beams circulating in storage rings were allowed to repeatedly traverse internal supersonic gas or cluster targets positioned in straight sections of the rings. Some of the scattered off the strong Coulomb field of the target nucleus , which induced the creation of a - pair via the space-like production process,
| (11) |
In rare cases, the outgoing and had similar velocities so that the two particles combined and formed a fast-moving atom [91, 92]. The cross section for this process is extremely small, in the order of 2 pb for a target nucleus of charge and depending on the energy of the incoming .
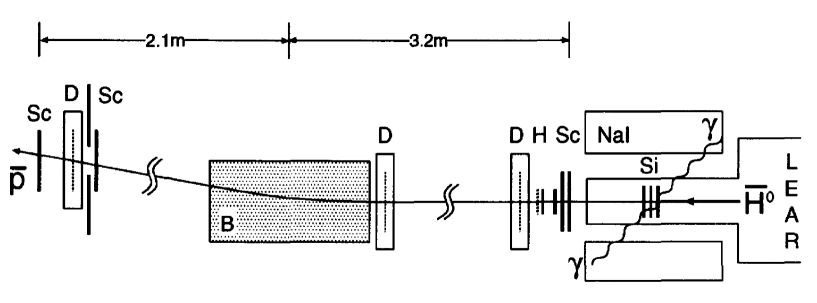
In 1995, the PS 210 collaboration produced by circulating a beam of in LEAR at a momentum of 1.94 GeV/c, and allowing it to traverse a Xe cluster target of density cm2. At these experimental conditions, the production cross section was expected to be around 6000 pb. Once neutral was formed, it was no longer confined by the magnetic fields of the storage ring, and left LEAR through a gap in one of the dipole magnets. A sophisticated set of particle detectors (Fig. 7) was set up to identify the escaping , and distinguish them from any background due to, e.g., antineutron () production. The were directed towards a stack of silicon detectors (indicated by Si in the figure), where the was stripped away from the and allowed to stop in one of the detectors. Pairs of 511-keV photons emerging from the resulting annihilation were identified using NaI scintillation counters. The emerging from the ionization of continued through a set of scintillation counters, and a magnetic dipole spectrometer containing three position-sensitive drift chambers. The was thus identified by its time-of-flight and magnetic rigidity. A good event consisted of a coincidence between the and signals, together with additional timing, energy, and directional cuts. Eleven atoms were detected during 15 hours of beamtime [93]. The Fermilab E 862 experiment later reported the detection of 57 atoms [94] in a similar experiment.
The velocity of the produced in this way can reach % of the speed of light, whereas reducing the momentum of the circulating beam in the experiment leads to a rapid reduction of the production cross section. Proposals have been put forward to measure the energy-level splittings and Lamb shifts of these fast in flight [95, 96, 97]. It is quite natural, however, to expect that even higher precision can be achieved using slow beams or stationary atoms confined in a trap. A second generation of experiments with the goal of producing and investigating cold atoms was initiated in 1999 at the AD.
4.2 Trapping and cooling of antiprotons
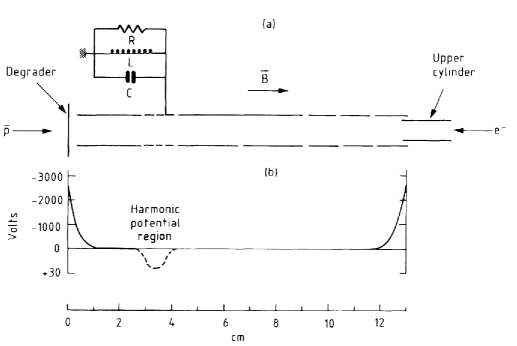
Before the AD experiments could synthesize , the ingredient had to be trapped and cooled in Penning traps [68, 72, 98]. As described in Sect. 2.3, these traps consist of a stack of cylindrical electrodes placed in a magnetic solenoid. The open geometry of the electrodes allows particles to enter along the trap axis. Similar devices have been used for many years in the Malmberg variant of the Penning trap to confine non-neutral plasmas [99]. The highest kinetic energy of that can be captured by these traps are roughly equivalent to the electrostatic voltage applied to the electrodes located at its two ends (Fig. 8). In practice, to avoid electrical discharge in the confined space of the superconducting magnetic solenoid, this voltage is typically limited to a few kV. This is much smaller than the kinetic energy of (5.3 MeV) arriving from AD, so that two alternative methods are currently employed to first slow down the to keV energies, prior to injection into the trap.
The first deceleration method involves passing the through a so-called ”degrader” foil or a gas cell filled with, e.g., a SF6/He mixture [101] in which they are slowed down by atomic collisions. Due to the range-straggling effects associated with this energy loss, however, a significant (typically ) fraction of the either annihilates in the degrader or emerges with too high energy ( keV) to be trapped. It is therefore crucial to adjust the degrader thickness to maximize the capture efficiency. This can be accomplished by either rotating the degrader foil [100] or by changing the gas density in the degrader cell. The decelerated travel along the axis of the trap, before encountering a negative potential applied to a cylindrical electrode located at the downstream end of the trap. This reflects the at a 180-degree angle back towards the trap entrance. Before the can exit the trap, a negative potential is rapidly pulsed on to a second electrode located near the trap entrance. This results in the being confined between the two electrodes comprising a longitudinal potential well of typical length mm.
The trapped keV are then cooled by the so-called ”sympathetic cooling” technique in the following way: clouds of or are first loaded into the trap, where they undergo cyclotron motion in the strong magnetic field (Fig. 8). They cool down to the temperature (–10 K) of the cryogenic environment by emitting synchrotron radiation [72], provided that possible heating due to space-charge and plasma effects, or induced noise on the electrodes can be neglected. The time constant for this synchrotron cooling is proportional to , and corresponds to around 2.6 s in a 1-T field at an environmental temperature of K. The cold plasmas are placed in short (10–30 mm) harmonic potential wells, which are superimposed on the long ( mm) well holding the . As the elastically scatter off the , they cool down and collect in the short potential wells containing the . The long potential well, now empty, is ready to accept another pulse. For a review on the early development of these trapping, cooling, and stacking techniques, see Ref. [101].
The radiofrequency quadrupole decelerator (Sect. 3.2) provides an alternate way to slow down to keV with a higher efficiency compared to the simple degrader technique. The ASACUSA collaboration allowed the 100-keV to traverse a thin ( ) plastic degrader foil, before injecting them into a multiring Penning trap called MUSASHI. In this way, 1 107 were trapped out of seven pulses provided by the AD. This constitutes a record in overall trapping efficiency of about 5 % [102]. The have subsequently been radially compressed in this trap [103] and extracted as a slow beam [104].
4.3 Trapping and cooling of positrons
The current generation of experiments utilize radioactive 22Na sources to harvest . The kinetic energy of emerging from the decay in these sources has a wide distribution with a maximum value of around keV. These fast must be decelerated and cooled via a so-called ”moderation” process before they can be accumulated. This moderation is typically accomplished by first allowing the to pass through thin foils of solid Ne [105] or W. Solid Ne grown on the surface of a cooled 22Na source has been experimentally found to be a particularly efficient moderator; indeed, some of the that traverse these moderators typically emerge with a kinetic energy of a few eV. This high efficiency is primarily due to the fact that solid Ne is an insulator with a large band gap energy eV. High-energy traveling through the Ne foil initially lose energy by ionization process. When the is slowed down below , however, further energy loss can only proceed via the excitation of low-energy phonons with a relatively small cross section. The can therefore travel greater distances ( m) in the Ne foil and emerge from the other side, compared to other metallic moderators. In addition, can reflect off the surface of the Ne foil with a high re-emission probability . By utilizing a conical-shaped Ne foil of carefully adjusted thickness, a moderated beam containing several per second can be routinely produced from a 75 mCi (i.e., decays per second) source.
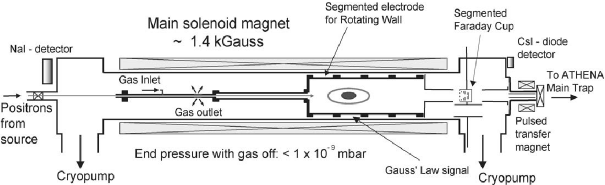
The moderated are then allowed to enter a Penning trap (Fig. 9) filled with gas at pressures between and Pa [106, 107, 108]. An colliding with a molecule loses around eV of kinetic energy via the excitation transition, . Since the cross section for this reaction is large, the are rapidly slowed down by successive collisions in the trap. Only a small fraction of is lost by forming positronium () atoms via the reaction, and subsequently annihilates. Differential pumping is used to establish a pressure gradient along the axis of the trap, so that the initially passes through a region of high gas pressure Pa where they are rapidly decelerated, before reaching a low ( Pa) pressure region where they are accumulated. In this way, the trapped typically retain lifetimes of s against annihilation.
The description provided in Sect. 2.3 of particles undergoing three types of characteristic oscillations in the harmonic electrostatic potential of a Penning trap is valid only when the number of confined particles is very low. When large numbers of are trapped, the space charge of the cloud distorts the electrostatic potential, which no longer appears harmonic. At thermal equilibrium, the density of in a plasma becomes uniform and the begins to rotate around the symmetry axis of the magnetic field at a constant angular velocity in a manner resembling a rigid rotor. Numerous collective modes can be excited in the plasma, which induces changes in its shape. The radial size for example can be compressed by applying a torque in the form of a rotating electric field on the plasma surface, and thereby increasing the angular momentum. This is normally carried out by segmenting some of the cylindrical electrodes of the trap in the azimuthal direction, and applying oscillating electric potentials of the correct relative phases. The frequency of this “rotating wall” is typically tuned slightly higher than the rotation frequency of the plasma, such that it excites the so-called Trivelpiece-Gould plasma modes [109]. This important technique increases both the density, number, and confinement lifetime of in the accumulation trap. The maximum density of particles of mass that can be stably confined in the magnetic field of the trap, however, is ultimately defined by the Brillouin limit, , where the vacuum permeability is denoted by and the speed of light by .
More than have been accumulated within several minutes in a Penning trap developed by the ATHENA and ALPHA collaborations [110, 111]. ATRAP and ASACUSA use accumulators of similar design [112, 113]. The emerging from all these accumulation traps are then typically injected into “nested” Penning traps (see below) to synthesize . Other methods to accumulate (see [114] for a review) are not presently used at the AD. The future GBAR collaboration plans to produce even larger numbers of by colliding electrons accelerated by an linac on a production target, as described in Sect. 8.4.2.
4.4 Formation of cold antihydrogen
4.4.1 Antihydrogen production methods
When trapped clouds of and are brought together in a trap, they can recombine and form in several possible ways that are enumerated below,
Spontaneous radiative recombination: In this process,
| (12) |
forms in binary collisions between and which is accompanied by the emission of a photon that carries away the excess energy and momentum. This reaction resembles the time-reversal of the photoionization process, and tends to produce occupying states of small principal quantum numbers [115]. The cross section of this process is small because of the slow rate of photon emission compared to the typical time scales involved in thermal collisions between and . The corresponding process, however, occurs readily in the interstellar medium and has been thoroughly investigated in astrophysics [116]. In the laboratory, this process has been studied by accelerating beams of protons in storage rings, and allowing them to pass through a co-propagating beam of an electron cooler [117, 118].
Stimulated radiative recombination: In this process, a radiation field is applied to stimulate the radiative recombination,
| (13) |
The corresponding reaction for H has been experimentally observed both in a storage ring [119] and with merged beams of and [120]. For a detailed and careful discussion of possible enhancement factors, see Refs. [121, 122].
Pulsed-field recombination: This process resembles the time-reversal of ionization by the application of a pulsed field. An external electric field is applied to a pair of and , so that the sum of the Coulomb field of the and the external field constitutes a saddle potential. At the instant when the arrives at the saddle point, the external electric field is turned off, thereby forming the atom. Pulsed field recombination has been demonstrated using Rb+ ion and pairs produced by laser-induced photoionization. High recombination rates of 0.3 % have been observed [123, 124]. Another experiment observed an enhancement in the recombination rate of Ca+ ions and using THz half-cycle laser pulses in the presence of a static electric field [125].
Three-body recombination: In simplified form this process can be denoted as,
| (14) |
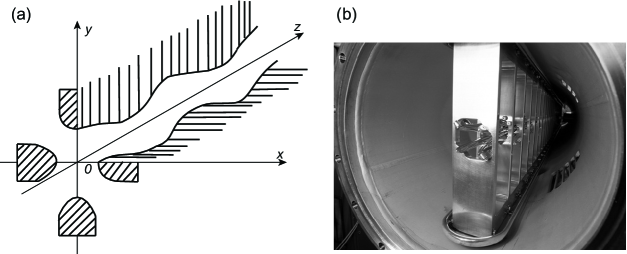
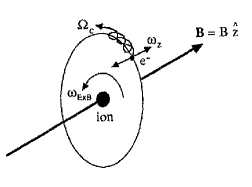
Here a collides with two simultaneously, is formed, and the outgoing carries away excess energy and momentum [126]. Actually this three-body recombination does not occur in a single step, but involves a complex cascade through intermediate excited states that arise during the collision. The rate of recombination is determined by a kinetic bottleneck which lies at a binding energy of a few below the ionization threshold, where the temperature of the is denoted by [128] . Since is four orders of magnitude smaller than the Rydberg energy, the collisional dynamics which governs the system is expected to be classical. The recombination rate increases with the square of the density, and is proportional to [127]. Although theoretical calculations indicate that the strong magnetic fields of Penning traps reduces this recombination rate, it is nevertheless expected to be the dominant production process at low temperatures of the and clouds [128, 129, 130, 131]. The weakly-bound formed in the magnetic field of the trap is theoretically characterized as a so-called “guiding-center atom”. Here the radius of the cyclotron motion of in the magnetic field at frequency is much smaller than the scale length in which the interatomic interaction potential varies, and so the atom resembles a classical object. The guiding center of the orbit (Fig. 10) simultaneously oscillates in two ways, i): rapidly along the magnetic field line in the Coulomb potential of at frequency , and ii): more slowly executing a drift around the at frequency .
Resonant charge-exchange: The can form in collisions between and excited atoms [132],
| (15) |
The corresponding reaction of H formed in collisions of with has been experimentally observed [133]. The cross section for this should increase with for a occupying excited states with principal quantum number [134]. An elegant method for preparing the excited [135] involves first irradiating a thermal beam of alkali atoms with lasers. The resulting Rydberg alkaline atoms are next allowed to traverse a cloud of confined in a Penning trap. This in turn results in the formation of Rydberg by charge-exchange process. The cross section for this formation reaches a maximum at the energy-matching condition where the total binding energies of the initial alkali and final states are similar. The process was experimentally demonstrated using laser-excited Cs atoms [136]. The neutral atoms are then allowed to traverse a cloud of confined in an adjacent Penning trap, thereby producing Rydberg via a second charge-exchange step.
Among these formation processes, three-body recombination and resonant charge-exchange have been experimentally demonstrated, as described in Sects. 4.4.3 and 4.4.4. Two other methods have been attempted so far without success: pulsed-field recombination could not be made to work by the ATRAP collaboration for unknown reasons (see Ref. [114], p. 161). Laser-stimulated radiative recombination was attempted by ATHENA [137], but no such event was observed so far. Given the fact that the enhancement to the recombination rate induced by laser irradiation is understood both theoretically and in experiments involving in storage rings, the negative result suggests that spontaneous radiative recombination does not contribute appreciably to formation at the experimental conditions now used by the AD collaborations.
4.4.2 Interaction of trapped antiprotons and positrons
Except for resonant charge-exchange, all of the above production methods involve the spatial overlapping of and clouds. To confine these oppositely-charged particles in close proximity to each other [126, 138], so-called “nested” Penning traps are employed in which a stack of cylindrical electrodes generate electrostatic potential wells of alternate polarity. In the example of Fig. 11, a positive potential which axially confines is superimposed on a longer negative potential which confines . One disadvantage of this method is that in thermal equilibrium at low temperatures, the and confined in this type of trap collect in their respective potential wells, i.e., they decouple and separate into two spatially-separated clouds so that may no longer be produced [139]. Overlap between the two clouds can therefore only be achieved in a non-equilibrium condition, e.g., by accelerating the into the plasma [4] or by exciting them using RF fields applied to the trap electrodes [140, 141]. One milestone on the way to production was the observation of sympathetic cooling of with in a nested Penning trap [142], which demonstrated their mutual interactions at even low relative energies.
Alternate schemes for simultaneous trapping of and involve Paul (RF) traps combined with Penning traps [143, 144] or two-frequency Paul-traps [145, 146]. The advantage of these methods is that overlap can be achieved in thermal equilibrium, but the drawback of Paul traps is that within clouds of particles, nonlinear dynamics can couple energy from the trap-driving RF field into the motion of particles [147]. This so-called RF-heating process makes it difficult to achieve very low temperatures in the particle clouds. So far, Paul traps have not been used for production, although the ASACUSA collaboration is attempting to develop particle cooling techniques to try and alleviate the above problems.
4.4.3 Antihydrogen production by three-body recombination
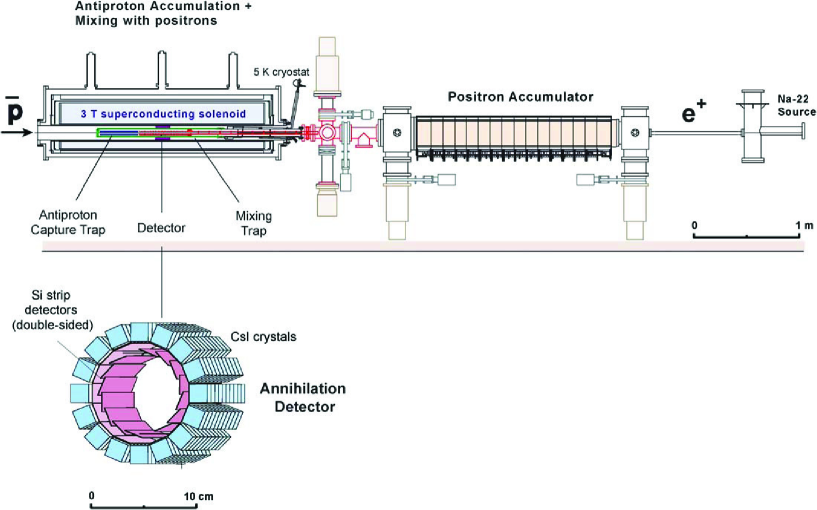
The first formation of cold by overlapping clouds of and in nested Penning traps was reported in 2002, first by the ATHENA collaboration [3] and then by the ATRAP collaboration [4]. ATHENA detected escaping from their trap by identifying its annihilation on the electrode walls (Fig. 12), as revealed by a coincidence in space and time of and annihilation vertices [110]. The tracks of and emerging from the annihilations were measured by two layers of double-sided Si microstrip detectors surrounding the cylindrical electrodes of the Penning trap, with a solid angle of 80. The apparatus included 8192 detector channels, the signals of which were amplified by application-specific integrated circuits (ASICs) and recorded by flash analog-to-digital converters at a trigger rate of Hz. Pairs of 511-keV photons emerging from annihilations were detected by 192 CsI scintillation counters of size mm3. These were read out by avalanche photodiodes (APD’s). The signal is characterized in Fig. 13 by a clear back-to-back peak of the two 511-keV photons. This method is insensitive to the internal quantum states of .
![[Uncaptioned image]](/html/1304.3721/assets/x13.png)
![[Uncaptioned image]](/html/1304.3721/assets/x14.png)
Figure 13: Left panel: Schematic illustration of detection in the ATHENA experiment using imaging annihilation detectors. The stacked cylindrical electrodes of the nested Penning traps are shown in the center. Neutral atoms were not confined by the traps and annihilated on the electrodes. The dashed lines show tracks of and emerging from the annihilation vertex, which were detected by two layers of double-sided Si-strip detectors. The wavy lines represent 511 keV gamma rays emerging from the annihilation vertex, which were detected by CsI crystals. The coincidence of both annihilation vertices signaled annihilation. Right panel: The signal. The grayed area shows the distribution of events as a function of the cosine of the opening angle of the tracks of gamma-ray pairs that coincide with a annihilation. The peak at arises from back-to-back gamma rays emerging from annihilation on the electrode surface. The triangles indicate the result from a control experiment “hot mixing,” in which the plasma was heated using a RF voltage on one of the trap electrodes, thereby suppressing formation. No back-to-back peak appears here. Figures from Ref. [3].
![[Uncaptioned image]](/html/1304.3721/assets/x15.png)
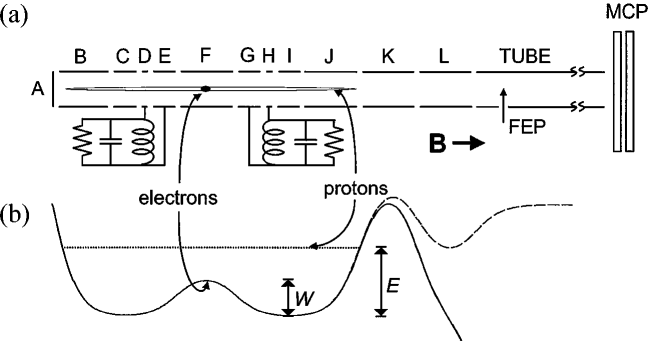
Figure 14: (a) Field-ionization method for detecting used by the ATRAP collaboration. The electrodes of a nested Penning trap used for mixing clouds of and to produce , together with a color-coded representation of the magnitude of the electric field. (b) The electrical potential along the trap axis used for producing indicated by solid lines. The dashed line indicates the potential used to launch into the cloud. (c) Annihilation signals corresponding to that first emerged from the field-ionization of , before being confined in the detection well and then ejected from it. (d) No signals were detected in a control-experiment that was carried out without introducing in the nested Penning trap. Figures from [4].
A quite different method for detection was used by the ATRAP collaboration, based on the fact that both three-body and charge-exchange recombinations produce that initially occupy Rydberg states [4]. Some of these weakly-bound were ionized by an external electric field which constituted part of an auxiliary (or “detection”) potential well in the trap (Fig. 14). The emerging from the ionization were recaptured and stored in the auxiliary well, thereby providing a signal of production. These signal were detected by opening this well at a later time and counting the annihilations on the trap electrodes. A sharp ms-long signal (Fig. 14) emerged, which could be clearly distinguished from the continuous background caused by cosmic rays. To isolate the signal from the background caused by any other that was not involved in the ionization, a positive electric potential was applied between the formation and detection regions. This allowed the passage of neutral between the two regions, whereas the background were reflected. Any other background caused by the loss of or from the nested Penning trap during the mixing of the two particle clouds was rejected, by delaying the opening of the auxiliary well until after the mixing phase.
The parameters of the and clouds during production were systematically studied [148, 149, 150]. By using the vertex reconstruction and imaging techniques described above, ATHENA found that escaping from the Penning trap preferentially annihilate on localized “hot spots” along the surface of the trap electrodes, possibly due to small off-axis displacements of adjacent electrodes in the trap. By contrast, the spatial distribution of annihilations on the electrodes were found to be radially symmetric [151]. It was also discovered that production initiates only after the has been cooled close to thermal equilibrium, which occurs on a time scale of [152].
The efficiency of production in these experiments is remarkable: some [153] and [4] of the trapped were found to form in respectively ATHENA and ATRAP. Such a large production rate is incompatible with the expected values for spontaneous radiative recombination, and strongly suggests that three-body recombination plays an important role. The rate of three-body recombination in the equilibrium state, however, is theoretically expected to have a steep dependence on temperature, whereas the experiments have measured a less pronounced scaling [154, 155]. Although many insights into formation have been gained from simulations as discussed in a recent review [156], there is no clear explanation for the apparent discrepancy in this temperature scaling [157].
The state distributions of the Rydberg atoms was studied by measuring the annihilation originating from the ionization of , as a function of the strength of an analysis field located between the nested trap and the ionization well of Fig. 14 [140, 159]. The velocity distribution of was also studied, by allowing the to pass through an oscillating electric field generated by one of the trap electrodes, before reaching the ionization well. The fraction of that passed through this field without ionizing was measured as a function of the frequency of the oscillating field [158, 159]. These initial experiments detected weakly-bound traveling along the magnetic field direction in the trap with relatively high velocities, corresponding to an energy meV and temperature K. The interpretation of the results is complicated [159] due to the complex way in which guiding-center atoms can interact with the magnetic field and with other confined in the trap. It has been suggested that although with initial energies of 1–10 meV may be produced in the experiment, they are converted into higher-energy by undergoing charge-exchange collisions with fast in the trap.
An interesting byproduct of these experiments was the observation of evidence by the ATHENA collaboration of cold protonium (-) atoms of temperature 400-700 meV being produced in the trap. The data was inferred from the observed axial and radial distributions of annihilation vertices occurring in the trap. This atom is believed to be formed when H ions confined in the nested Penning trap collide with via the reaction [160],
| (16) |
4.4.4 Antihydrogen production using resonant charge exchange
![[Uncaptioned image]](/html/1304.3721/assets/x16.png)
Figure 15: Schematic layout of the experiment which produced by resonant charge-exchange. Laser beams of wavelengths 852.2 nm and 510.7 nm excited Cs into Rydberg states with principal quantum number . These Cs∗ traversed a cloud of confined in a Penning trap, thereby forming Rydberg via the reaction, . Some of these atoms traveled through a cloud of in an adjacent Penning trap and formed in a second charge-exchange step, . These Rydberg atoms traversed a detection region that contained an ionizing electric field. Figure from Ref. [5].
![[Uncaptioned image]](/html/1304.3721/assets/x17.png)
Figure 16: (a) Annihilation signal corresponding to emerging from field-ionized and being captured by a so-called “detection well” constituting an auxiliary Penning trap. The peak corresponding to the ionized was detected by allowing the electrostatic potential of the detection well to be ramped down. Under the assumption that the velocity of these formed by resonant charge-exchange is isotropic, this signal corresponds to 100–200 atoms produced in 6 trials. (b) Signal for calibrating the efficiency of the annihilation detector. Figure from Ref. [5].
The resonant charge-exchange method for production (Fig. 15) is quite complex to implement, as a thermal alkali beam and multiple laser beams must be incorporated into the experimental apparatus together with the nested Penning traps, which are at cryogenic temperatures and in a strong magnetic field. The ATRAP collaboration excited a thermal beam of Cs atoms to states of using a continuous-wave (cw) diode laser of wavelength 852 nm, and a pulsed copper vapor laser of wavelength 511 nm. The resulting Rydberg Cs∗ atoms then entered the electrode stack comprising the Penning trap through a 0.3-mm diameter hole. They were allowed to interact with a cloud of cooled to temperature K, thereby producing Rydberg . These then passed through a second potential well containing . In the initial demonstration experiment, ATRAP detected 144 events produced in this way (Fig. 16).
An important advantage of this method is that the -value of the formed can be selected by simply tuning the wavelength of the lasers used to excite the alkali atoms to a Rydberg state, prior to the first charge-exchange collision that produces Rydberg (see Sect. 4.4.1). Moreover the is expected to be formed at significantly lower temperature than those produced by, e.g., three-body recombination in nested Penning traps. This is related to the fact that the velocity of most likely corresponds to the velocity of the ingredient prior to recombination. Whereas in nested Penning traps the and clouds must be accelerated towards each other to overlap which can potentially increase the temperature, in the resonant charge-exchange case the target can be kept static and cold in the Penning trap, waiting to collide with the cold and form of the same temperature. These features may be important for future experiments on antimatter gravity (see Sec. 8.4).
4.5 Antihydrogen trapping
4.5.1 Magnetic traps
Experiments with have important advantages compared to the corresponding ones for H, since even a few can be detected with high sensitivity by measuring their annihilation in the experimental apparatus. The very low numbers of now available to experimentalists, however, also represents a challenge. Whereas precision laser spectroscopy experiments of H [161] typically employ cold beams with a flux of 1017 s-1 [162], the corresponding flux in the case is in principle limited among many things by the production rate of at the AD of every 90–100 s. Trapping of thus suggests itself as an obvious means to make efficient use of the rare atoms.
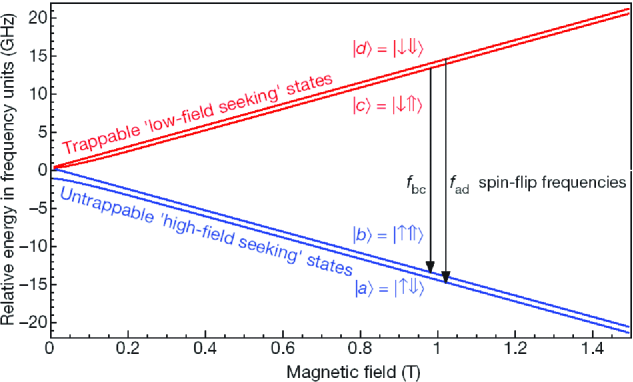
Neutral atom traps confine using the fact that those atoms whose magnetic moments are aligned opposite an external magnetic field will have lower energies in a lower field. The Breit-Rabi diagram of Fig. 17 schematically shows the binding energies of the hyperfine sublevels of the ground state, as a function of . Since the energies of the so-called “low-field-seeking” states and increase with , that populate these states, when placed in the inhomogeneous magnetic field of the trap, tend to drift towards and collect at the center where the field is minimum. Conversely, the “high-field-seeking” states and are repelled from the field minimum and can be ejected from the trap.
In practice there are several possible field configurations: Ioffe traps [163] employ a quadrupole or octupole magnetic field for confinement of atoms in the radial direction, and “pinch” coils for axial confinement. These traps have been used to confine H atoms [164, 165] and achieve Bose-Einstein condensation [166]. An alternative geometry involves the use of anti-Helmholtz coils which create a quadrupole trap with an axial symmetry [163, 167].
Typical values of the magnetic field gradients in Ioffe traps that can be achieved by current technology is T between the center and walls of the trap. This corresponds to a potential well depth expressed in temperature units of , implying that only with mK-scale temperatures can be trapped. This is much smaller than the typical well depths (few kV) that can be achieved for charged particles in Penning traps.
4.5.2 Compatibility of traps for neutral atoms and charged particles
Neutral H are normally loaded into atom traps by either decelerating them via atomic collisions, or by allowing them to interact with cryogenic surfaces within the trap which are covered with liquid He. So far there are no corresponding techniques to load such a trap with arriving from the outside (a possible exception is the coil gun technique [168]). The atoms must instead be produced directly within the magnetic fields of the trap, before they can be successfully captured. This implies the use of an atom trap which is superimposed on some Penning traps, for simultaneous confinement of , , and . One such design employs a Ioffe-trap with a non-zero magnetic field at the center. This so-called “bias field” serves as the magnetic confinement field of a nested Penning trap for charged particles.
There were previous concerns, however, with the feasibility of this design, since the Ioffe trap includes a radial magnetic multipole field which breaks the cylindrical symmetry. This seemed to be at odds with the confinement theorem for stably trapping non-neutral plasmas in Penning or Penning-Malmberg traps, which imposes a strong requirement for preferring a cylindrical symmetry [169]. In fact, experiments have shown that when magnetic quadrupole fields are superimposed on Penning traps, the radial diffusion of the trapped plasmas is significantly increased [170], and the confinement properties can even be destroyed [171]. Atom traps with higher-order radial multipole [172] and other field configurations [173] have been suggested to alleviate this problem. On the other hand, it has been shown that single charged particles confined in Penning-Ioffe traps with a radial quadrupole field [174] can follow stable trajectories. This may imply that relatively low-density clouds of charged particles can still be stably trapped, even if high-density non-neutral plasmas cannot.
It was to later great relief that further experiments demonstrated and confinement in nested Penning traps superimposed on Ioffe traps, with either radial octupole [175] or quadrupole [176] magnetic fields. Two additional intermediate goals were soon achieved on the path towards trapping, i): production of in a Penning trap of comparably low (1 T) magnetic field [177] compatible with the magnetic bias field of an Ioffe trap, and ii): production in a Penning-Ioffe trap with a quadrupole magnetic field [178].
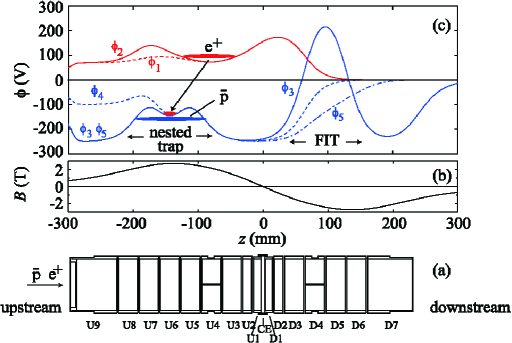
Right panel: Schematic drawings of the (a) trap electrodes, (b) magnetic field along the trap axis, and (c) electrostatic potential on the axis. The and were mixed in a nested Penning trap located in the upstream part of the apparatus. The formed here traversed the magnetic cusp field (note the zero-crossing of the magnetic field in (b) at ) and were field-ionized downstream in the field-ionization trap (FIT). Figures from Ref. [6].
A different proposal for superimposing neutral atom and charged particle traps is the so-called “cusp trap” 18, which attempts to employ a magnetic quadrupole field with cylindrical symmetry [167]. Here charged particles can escape along the magnetic field lines which constitutes a “loss cone” of plasma confinement in a magnetic mirror. This loss, however, can be prevented by overlapping an electric octupole field with a cylindrical symmetry [167]. This so-called “magnetic cusp and electric octupole (MCEO)” idea can be seen as a higher-order multipole generalization of the Penning trap principle. Confinement of non-neutral plasmas in such a MECO trap has been demonstrated. The density profile, however, shows a crater near the trap center [179]. Simulations show that one distinct feature of the cusp trap is the possibility to extract a polarized beam of [167], which may be important for carrying out future measurements of hyperfine splitting using such a beam (Sect. 8.3). Other simulations show that the cusp trap may have advantages in a cooling process which occurs as Rydberg spontaneously decay inside a magnetic trapping field [180]. Some have recently been produced using conventional nested Penning traps in the cusp trap apparatus, and detected on the other side of the magnetic cusp field [6].
4.5.3 Magnetic trapping of antihydrogen
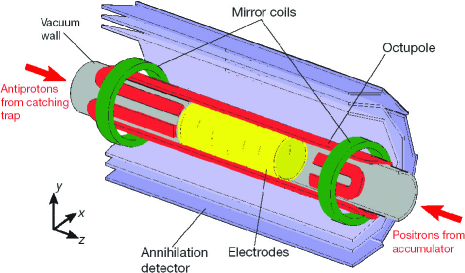
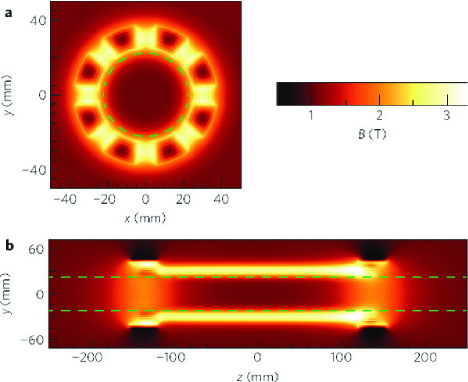
In 2010, the ALPHA collaboration demonstrated a major breakthrough of magnetically trapping cold [8]. A superconducting Ioffe trap with a radial octupole field having a potential depth of about 0.5 K was used in this experiment, the magnetic field distribution of which is shown in Fig. 19. By mixing and in nested Penning traps located within the bias field of the Ioffe trap, several thousand were produced. On average a single in several such trials was cold enough to remain trapped. The magnetic trapping field was then ramped down, releasing the within a well-defined time window. An imaging silicon detector recorded the vertices of the resulting annihilation events.
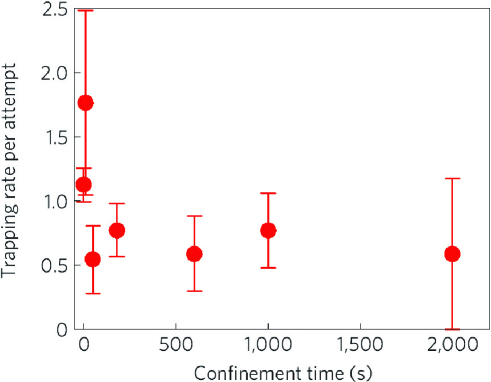
Shortly after this initial demonstration, ALPHA extended the trapping time to s. Fig. 20 shows the observed rate of trapping as a function of confinement time. Whereas three-body recombination initially produced Rydberg , the long confinement times ensured that they cascade down to the ground state. Theoretical calculations indicate that the time scale for this to occur is in the ms regime, for initial states near [181].
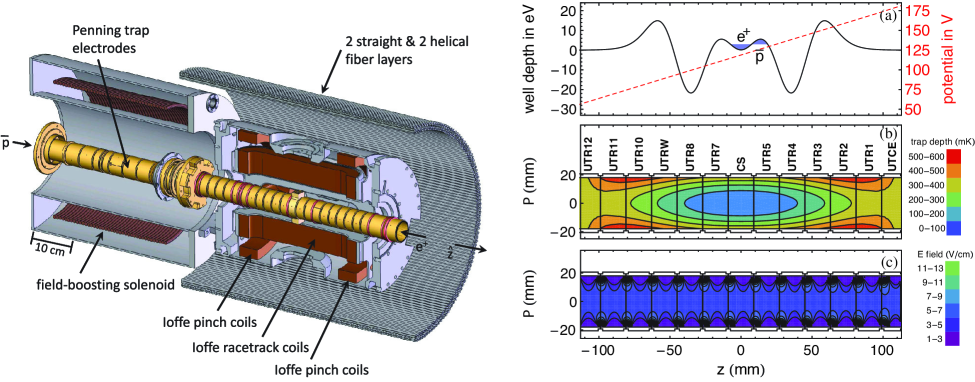
The ATRAP collaboration also observed confined for 15–1000 s in a slightly different type of Ioffe trap (Fig. 21) with a radial quadrupole field [10]. More () were used in this experiment, and a high trapping rate of per trial was observed. The trapping of ground-state constituted another crucial step towards spectroscopy. High precision experiments will presumably require a large number of trapped , and so both collaborations are working towards this goal.
4.6 Microwave spectroscopy of the ground-state hyperfine structure of antihydrogen
The -ground state of contains four magnetic substates characterized by the total angular momentum and magnetic quantum numbers , , and (Fig. 17). The ground-state hyperfine splittings between the (singlet) and (triplet) states of H has been measured [182, 183] to a precision of using a H maser,
| (17) |
This value is to leading order determined by the Fermi contact interaction and is proportional to the magnetic moment ,
| (18) |
The term contains QED and other corrections of relative size . Since the value has recently been measured by a separate Penning trap experiment [20] with a precision of (see Sect. 6), a measurement of of to a precision of would provide information on the magnetic form factors of [184, 185] i.e., the non-relativistic magnetic size (Zemach) radius which contributes to a -ppm shift in . The proton polarizability contributes a further shift of ppm.
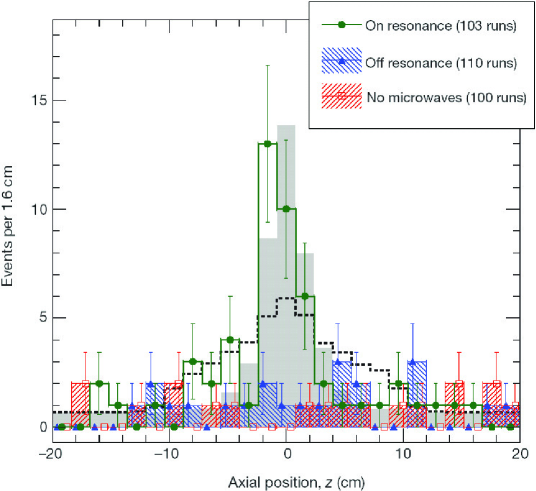
The ALPHA collaboration recently succeeded in inducing microwave transitions between these hyperfine levels in trapped . In the energy level diagram of Fig. 17, the proton spin resonance (PSR) transitions and were measured. For this, microwave radiation at a frequency of GHz was injected along the trap axis using a horn antenna. The spin-flip transitions excited states and of trapped atoms into high-field seeking states, which led to expulsion from the trap. When the magnetic field of the neutral atom trap was ramped down after exposing the to resonant microwaves, those atoms which were expelled from the trap were missing; this constituted the so-called “disappearance mode” signal. Another method of observing resonant transitions was to detect annihilation events during the injection of microwaves, which constituted an “appearance mode” signal. Both types of signals have been clearly observed in the experiment, as shown in Fig. 22. This observation of induced spin-flip transitions in ground-state atoms marks the advent of spectroscopy.
5 Antiprotonic helium
5.1 Metastable antiprotonic helium atoms

Antiprotonic helium atoms () [12, 186, 187] are three-body Coulomb systems composed of a helium nucleus, an in the 1s-ground state, and a populating a Rydberg state with principal and angular momentum quantum numbers of . The energy level diagram of the isotope in the region and –39 is shown in Fig. 23. Precise measurements on the transition frequencies of can be used to determine the antiproton-to-electron mass ratio [15, 16], and constrain the equality of the and charges and masses [13, 14, 16].
Antiprotonic atoms (denoted ) can be readily synthesized for a given element by replacing one or more atomic with a negatively-charged [188, 189, 190, 191, 192, 193, 194, 195]. The substitution takes place spontaneously, when are brought to rest in the substance concerned. These exotic atoms, however, are usually destroyed within picoseconds by electromagnetic cascade mechanisms that result in the rapid deexcitation of the and its annihilation in the nucleus of via strong interaction.
The atom alone retains -scale lifetimes against annihilation in the nucleus, even in dense helium targets [187]. The extreme longevity is due to the fact that the trapped in the Rydberg states have almost no overlap with the nucleus, and furthermore cannot easily deexcite by Auger emission [196, 197, 198, 199, 200] of the remaining owing to its large ( eV) binding energy and the large multipolarity () of the necessary transition. This protects the against Stark mixing with low- states which overlap with the nucleus, during collisions [201, 202] with other helium atoms. The atoms can be synthesized via the reaction,
| (19) |
Some of the are then captured [203, 204, 205] into states with -values of around,
| (20) |
where denotes the reduced mass of the atom, and the mass. This corresponds to the orbital with the same radius and binding energy as that of the displaced in Eq. 19. The values for the and isotopes are respectively and . The relative ease in synthesizing large numbers of and its long lifetime make this atom amenable to high precision laser spectroscopy.
5.2 Theoretical calculations
The energy levels have been calculated by three-body QED calculations to relative precision of 1 part in [17]. This involved first solving [206, 207, 208, 209, 210, 211, 212, 213, 214, 215, 216, 217, 218, 219] the non-relativistic Hamiltonian expressed in natural units of ,
| (21) |
using numerical variational methods. Here the indices 1, 2, and 3 correspond respectively to the He nucleus, , and . In fact, in the case of the ground state of normal He atoms, the non-relativistic binding energy a.u. has been calculated to 19–22 digits of precision by several theoretical groups [217, 220, 221] using a variety of trial functions containing a few thousand basis sets. The case of is in principle more difficult since the states are resonances that can decay by Auger emission of the . Nevertheless for some states with -scale lifetimes against Auger and radiative decay, the values were calculated with a claimed precision of digits using the Feshbach formalism [217]. The Hamiltonian was projected onto the subspace of closed channels which provided a sufficiently accurate approximation of the wave function. States with ns-scale Auger lifetimes, on the other hand, were calculated to digits of precision [17, 218] using the complex-coordinate rotation (CCR) method [216], which takes into account the resonance nature of .
In addition to , perturbative calculations [17] were carried out to determine the relativistic corrections of the (), the nucleus and (), and the anomalous magnetic moment of the (). Also calculated were QED corrections due to the one-transverse-photon exchange (); the one-loop self-energy () and vacuum polarization (); the recoil correction () of order ; and one- and two-loop corrections (, ) of orders and . The charge radii of the 3He and 4He nuclei give corrections of MHz, whereas that of the is much smaller ( MHz) owing to the large -value of the states. The values for the transition are shown in Table 1 (Ref. [222]).
The latest calculation [17] uses fundamental constants compiled in CODATA 2002 [223], including the 3He- and 4He-to-electron mass ratios, the Bohr radius, and Rydberg constant. To preserve independence the more recent CODATA 2010 values [81] were not used, which include results from previous experiments [15] and three-body QED calculations on . Similar calculations have been carried out on HD+ and H molecular ions [224, 225, 226], and the results agree with laser spectroscopy experiments to a fractional precision of .
| = | 1 522 150 208.3 | ||
|---|---|---|---|
| = | 50 800.9 | ||
| = | 454.9 | ||
| = | 84.9 | ||
| = | 105.7 | ||
| = | 4.7 | ||
| = | 7 311.0 | ||
| = | 243.0 | ||
| = | 1.4 | ||
| = | 113.1 | ||
| = | 11.5 | ||
| = | 1 522 107 058.9 | (2.1)(0.3) |
5.3 Single-photon laser spectroscopy
Initially, all laser spectroscopy experiments of were carried out by inducing single-photon laser transitions [227, 228] from metastable states (indicated by solid lines in Fig. 23) to states with ns-scale lifetimes (wavy lines) against Auger emission of the . The transitions were excited using simple, ns pulsed dye lasers [229]. Two-body ions [230] remained after Auger decay. Since the -substates of the ion are highly degenerate, collisions with other He atoms in the experimental target caused Stark mixing with S, P, and D states at high that have a large overlap with the He nucleus. The was absorbed in the He nucleus within picoseconds, resulting in annihilation and the emission of several and . The resonance condition between the laser and the atom was detected by measuring the count rate of these and as a function of laser frequency, using acrylic Cherenkov counters [231] surrounding the experimental target.
Twelve transition frequencies in the and isotopes were measured [14, 15] by single photon laser spectroscopy in this way, with a fractional precision of . In Fig. 24, the values (indicated by filled circles with error bars) are compared with three-body QED calculations (squares) of Ref. [17]. The four highest-precision measurements in , and in agreed with within . Four frequencies for were 2 above the values.
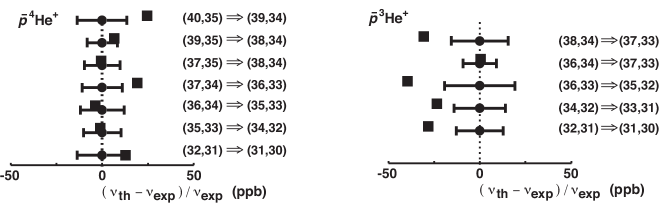
5.4 Sub-Doppler two-photon laser spectroscopy
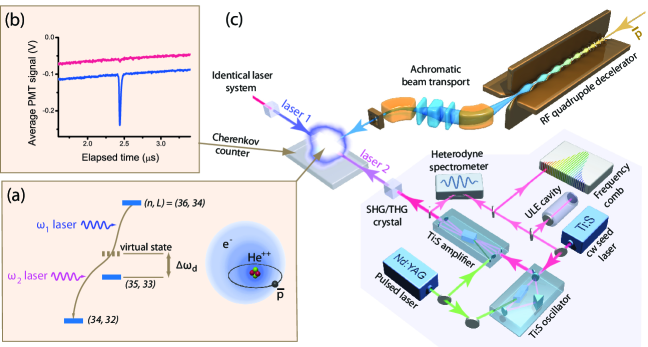
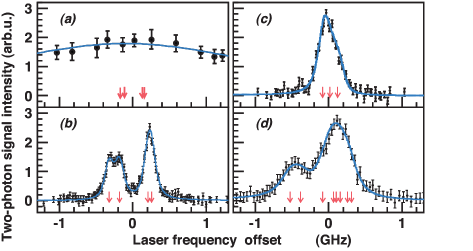
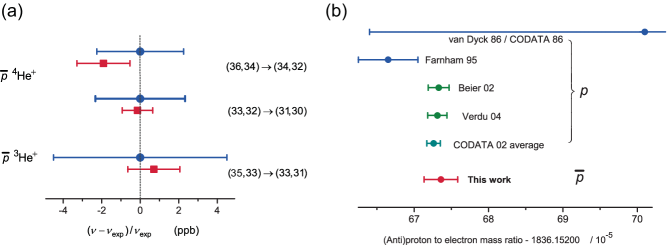
The precision of the single-photon spectroscopy experiments above was limited to – due to the Doppler broadening effect. As in normal atoms, the thermal motion of at temperature strongly broadens the measured widths of the laser resonances by , wherein denotes the transition frequency, the Boltzmann constant, the atom’s mass, and the speed of light. One way to reach an experimental precision beyond this Doppler limit is provided by nonlinear two-photon spectroscopy. As described in Sect. 8, the transition frequency in atomic H has been measured to a precision of by irradiating the atom with two counterpropagating laser beams, each with a frequency corresponding to half the value. This arrangement cancels the Doppler broadening to first order because the red shift in the frequency of one of the lasers seen by the is exactly canceled by a corresponding blue shift in the other laser. It is normally difficult, however, to apply this to the case, because of the small probabilities involved in the nonlinear transitions of the massive antiproton.
Two-photon transitions of the type however, were successfully induced (Fig. 25(a)) by exciting between the parent and daughter states through a so-called ”virtual” intermediate state. This is a dressed-atom state that temporarily arises due to the interaction of the with the laser field. If the frequencies and of the counterpropagating laser beams are tuned so that the virtual state lies near (e.g., within GHz) to a real state , the overlap of their wavefunctions becomes large and so the probability of the two-photon transition is enhanced by a factor of [232]. Note that the population in the state is unaffected by this; the state only serves to enhance the transition probability. The first-order Doppler width is then reduced by a factor .
Even under these conditions of enhanced transition probability, MW-scale laser pulses are needed to excite the two-photon transitions. Lasers with high spectral purity and low phase noise are needed to avoid rapid dephasing in the amplitude of the two-photon transition. For this (Fig. 25 (c)) two sets of Ti:Sapphire lasers of pulse length 30-100 ns and linewidth MHz were developed [233]. They were based on continuous-wave (cw) lasers of wavelengths 728–940 nm whose frequencies were measured to a precision of using a femtosecond optical comb [234] locked to a global-positioning-system disciplined, quartz oscillator. This seed beam was pulse-amplified to the 1-MW peak power needed to excite the two-photon transitions, using a Ti:Sapphire pulsed oscillator and amplifier. Spurious modulations in the pulsed laser frequency or ”chirp” induced during this amplification are an important source of systematic error, and were measured using a heterodyne spectrometer [235, 236]. The precision of this laser system of was verified [233] by measuring some two-photon transition frequencies in Rb and Cs [237] at wavelengths of nm and 822 nm.
It was essential to use cryogenic He targets of low enough density for the relaxations caused by collisions between and other He atoms that could inhibit the two-photon transition to remain small. This implied the use of beams of low enough energy ( keV) to be stopped in such targets within the volume irradiated by the 20-mm-diameter laser beams. Pulsed beams containing were provided by the RFQD (Fig. 25 (c)). The beam was transported [238, 239] by an achromatic magnetic beamline to the target chamber filled with 4He or 3He gas at temperature K and pressure mbar. At a time after the formation of , horizontally-polarized laser beams of energy density mJ/cm2 were simultaneously fired through the target in a perpendicular direction to the beam. Fig. 25 (b) shows the Cherenkov signal (indicated in blue solid line) as a function of time elapsed since the arrival of pulses at the target. Lasers of wavelengths and nm were tuned to the two-photon transition so that the virtual intermediate state lay 6 GHz away from the real state . The above-mentioned annihilation spike corresponding to the two-photon transition can be seen at . When the 417-nm laser alone was tuned slightly (by 0.5 GHz) off the two-photon resonance condition (red line), the signal abruptly disappeared, which indicated that the background from any Doppler-broadened, single-photon transitions is very small.
Fig. 26 (b) shows the resonance profile measured by detuning the laser to GHz, whereas was scanned between -1 and 1 GHz around the two-photon resonance defined by . The measured linewidth ( MHz) is more than an order of magnitude smaller than the profile of the corresponding single-photon resonance (Fig. 26 (a)). This sharp line allowed the determination of the atomic transition frequency with a correspondingly higher precision. The two-peak structure with a frequency interval of 500 MHz arises from the dominant interaction between the spin and the orbital angular momentum of the (Sect. 5.5). Each peak is a superposition of two hyperfine lines caused by a further interaction between the and spins. The asymmetric structure is reproduced by lineshape calculations and is due to asymmetric spacings between the hyperfine components.
Fig. 26 (c) shows the resonance at wavelength nm with the lowest n-values among the two-photon transitions. All hyperfine lines are much closer together (at intervals of MHz). The resonance (Fig. 26 (d)) contains eight partially-overlapping hyperfine lines arising from the spin-spin interactions of the nucleus, , and . The spin-independent transition frequencies were obtained by fitting each profile with a theoretical lineshape (indicated by solid lines) which was determined by numerically solving the nonlinear rate equations of the two-photon process. Various sources of statistical and systematic errors such as the AC Stark shifts [232, 240], Zeeman shifts, and frequency chirp were evaluated.
The values (indicated by filled circles with error bars in Fig. 27 (a)) agree with theoretical values (squares) within . This agreement is a factor 5–10 times better than in the single-photon experiments described in the previous section.
When the antiproton-to-electron mass ratio in these calculations was changed by , the -value changed by 2.3–2.8 MHz. The best agreement between the experimental and calculated frequencies were obtained with a mass ratio,
| (22) |
The uncertainty of includes the statistical and systematic experimental, and theoretical contributions of , , and .
This is in good agreement with the three previous measurements [241, 242, 243] of the proton-to-electron mass ratio (Fig. 27(b)) with a similar experimental precision. The most precise value for is currently obtained by comparing the g-factors of hydrogen-like 12C5+ and 16O7+ ions measured by the GSI-Mainz collaboration with high-field QED calculations. The CODATA recommended value [81, 223] for is taken as the average of these experiments. By assuming invariance and using the CODATA recommended value for the mass, u, one can further derive a value for the mass,
| (23) |
from the result.
Hughes and Deutch [244] constrained the equality between the and charges and masses and to better than . For this they combined X-ray spectroscopic data of antiprotonic atoms (which is proportional to ) and the cyclotron frequency () of confined in Penning traps measured to a higher precision. One can improve this limit by factor using the linear dependence of and on the -values of , i.e., . For the three transitions, the constants were estimated as –2.8 and –3.4, whereas the right side of this equation was evaluated by averaging over the three transitions as, . Meanwhile the constraint of Eq. 3 from the TRAP experiment implies that . From this it was concluded that any deviation between the charges and masses are at 90 confidence level [16].
5.5 Laser-microwave-laser triple resonance spectroscopy
The microwave transition frequencies between the hyperfine sublevels of was measured by laser-microwave-laser triple resonance spectroscopy [186, 245, 246, 247]. The spin-spin and spin-orbit interactions between the and in cause each metastable state to split into four magnetic substates, denoted by , , , and as shown in Fig. 28 (a). The dominant splitting corresponding to a frequency interval –15 GHz arises from the interaction between the spin and the orbital angular momentum of the . The size of is primarily sensitive to the magnetic moment of the , rather than the . A smaller spitting of –300 MHz is caused by the interaction between the spin and its orbital angular momentum. This frequency is in principle more interesting for consistency tests since it is roughly proportional to the magnetic moment [248], but the short lifetime of and other experimental limitations makes it unfortunately difficult to directly measure this with a high precision. All measurements therefore concentrated on the microwave transitions.
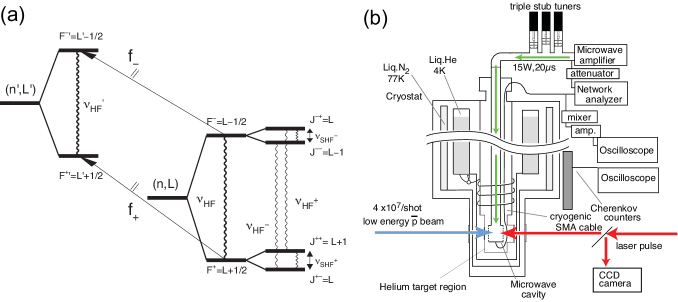
In the experiment (Fig. 28 (b)), were first synthesized by allowing a beam of 5.3-MeV to come to rest in a microwave cavity filled with cryogenic helium gas of typical atomic density cm-3. The stainless-steel cavity [246] was cylindrical with a loaded quality factor (i.e., the ratio between the cavity bandwidth and resonance frequency) of and a central frequency of GHz. The atoms were first irradiated with a laser pulse tuned to the transition at wavelength nm, which stimulated the transition denoted by in Fig. 28 (a). This selectively depopulated the occupying the two states and , while those in the states and were unaffected by the laser beam.
A microwave pulse of frequency GHz and typical power W was admitted into the cavity through a waveguide, thus generating a standing wave in the cavity. A triple-stub-tuner was inserted into the waveguide circuit outside the cryostat, which allowed the impedance of the transmission line to be matched to the cavity and the central frequency chosen. By this method the cavity was tunable across a frequency range of 100 MHz, while achieving at each frequency point a resonance condition with a quality factor close to . The microwave stimulated electron spin-flip transitions between the state and at frequency , and between and at . The resulting change in the populations in and were detected by a second laser pulse, again tuned to the transition.
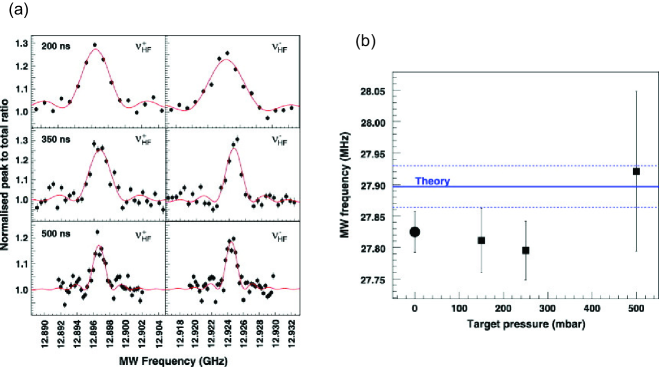
In Fig. 29 (a), the resonance signals detected in this way are shown as a function of microwave frequency. The expected resonances at and were clearly observed. By increasing the timing delay between the two lasers between 200 and 500 ns, the resolution was increased. The frequency difference MHz (Fig. 29 (b)) is especially sensitive to the magnetic moment. By averaging the results measured at four target pressures, a value (33) MHz was obtained [18, 247]. By comparing this with the results of three-body QED calculations [248, 249, 250, 251, 252], the magnetic moment was obtained as . This determination with a precision of is in good agreement with the value measured by X-ray spectroscopy of Pb atoms to a similar precision. The precision on was later improved by the Penning trap experiment described in Sect. 6. Two microwave transitions between the hyperfine sublevels of state in were similarly detected [253] at frequencies of GHz and GHz.
5.6 Chemical physics
A variety of systematic studies was also carried out on the chemical-physics properties of . The numbers of populating the metastable states were studied by measuring the intensity of the laser resonance involved in each state [205]. Nearly all the were found to lie in the region –40 immediately after the formation of the atom, with the and 37 states having the largest population. This appears to support the estimation given in Eq. 20. On the other hand, theoretical calculations predicted sizable populations in the states, but experiments detected very few in them. This may be due to collisions between and other helium atoms in the target which destroy the populations in these states.
The Auger rates of many and states were measured in Refs. [199, 200]. Most of the results agreed with theoretical calculations, but state in revealed decay rates which were orders of magnitude larger than the theoretical values. Calculations [198] indicated that such a short lifetime is caused by a strong coupling to an electronically excited state, where the electron occupies the orbital, and the the state [13].
The radiative lifetimes of states were measured [202, 201] as a function of the atomic density of the helium target. One state retained a lifetime at even liquid helium densities [201], whereas other states became dramatically short-lived. For example, the lifetime of decreased from to ns, as was increased from to . Theoretical calculations [254, 255] have been unable to qualitatively explain the reason for this.
The antiprotonic helium ion () is a singly-charged, two-body system composed of an antiproton and helium nucleus. Cold (temperature K) and ions with lifetimes ns against annihilation were produced [230]. These states had principal and angular momentum quantum numbers –32 and , and constituted ideal semiclassical Bohr systems. Their spin-independent parts of the energy levels (left side of Fig. 23) can be calculated to very high precision () using the simple Bohr formula,
| (24) |
Owing to this simple structure, the ion may be a candidate for future precision laser spectroscopy experiments.
When small (10–100 ppm) admixtures of H2 and D2 impurity gases were mixed in the target He, the resulting chemical reactions with caused the state lifetimes to shorten to ns scales [256, 257, 258]. The cross section for this reaction involving state at target temperatures –60 K was measured to be around cm2. This roughly corresponds to the geometrical cross section. The cross section for on the other hand was much smaller, and decreased from to cm2 as the temperature was reduced from 300 K to 30 K, then leveled off below 30 K. This behavior was interpreted to indicate the presence of a quantum-tunneling effect with a small activation barrier at low temperature [258].
6 Antiproton magnetic moment measured in a Penning trap
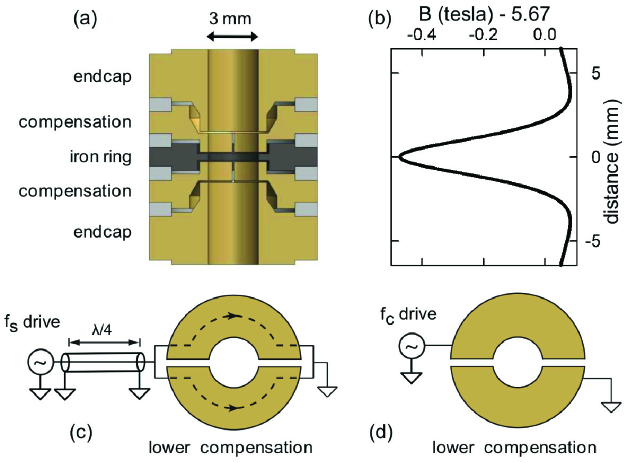
Part of the ATRAP collaboration recently measured the magnetic moment of a single confined in a Penning trap as [20],
| (25) |
A comparison to the proton value,
| (26) |
which was measured [259] using the same method and trap electrodes resulted in the determination of the constraint,
| (27) |
to a precision of . In this experiment, the spin of the confined in the static magnetic field of a Penning trap (Fig. 30) was flipped by applying an oscillating magnetic RF field close to the Larmor frequency,
| (28) |
By measuring the rate of observed spin-flips as a function of the applied drive frequency, a resonance curve emerged from which the Larmor frequency was extracted. The value of the field was then determined from the cyclotron frequency of the trapped using Eqs. 1 and 2. The magnetic moment was derived from the ratio of the two measured frequencies,
| (29) |
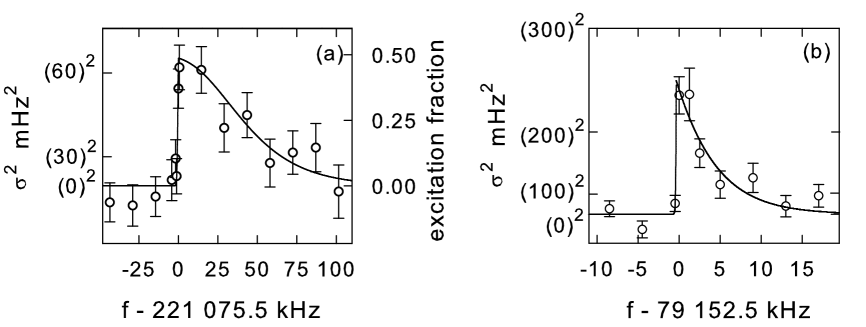
The experimental challenge lay in the detection of this spin flip (Fig. 47). This was carried out by applying the continuous Stern-Gerlach effect, where an inhomogeneous magnetic field of a so-called “magnetic bottle” was superimposed on the Penning trap. This inhomogeneous field caused a small shift in the axial oscillation frequency of the trapped depending on its spin orientation (Fig. 31). The continuous Stern-Gerlach effect was also used in the famous experiments which measured the of the and [260]. The latest incarnation of this experiment [261, 262] determined the of as,
| (30) |
by detecting the individual quantum jumps associated with a single flipping its spin in a Penning trap. The sensitivity of this effect for , however, scales proportionally to , the size of which is of the and cases. At the experimental conditions of the work of Ref. [263] for example, a spin-flip shifted the eigenfrequency 674 kHz of the axial motion by 190 mHz. In addition to this coupling to the spin magnetic moment, the magnetic bottle also couples to the magnetic moment arising from the orbital angular moment of the particle motion to the axial frequency. This second coupling causes background baseline shifts and fluctuations in the axial frequency which are difficult to control, presenting a considerable experimental challenge. Single spin-flip events have not been detected so far due to insufficient signal-to-noise ratios. Nevertheless, the time-averaged spin-flips of a single [20] as well as a [259, 263, 264] have been detected using a statistical method, where the signals from several spin-flips were added together to enhance the signal-to-noise ratio.
7 Atomic and nuclear collisions, and applications
7.1 Stopping powers
The stopping powers of with kinetic energies 1–100 keV in various conductor (C, Al, Ni, Au) and insulator (LiF) targets were systematically measured using the decelerated beam emerging from the RFQD [21, 22, 23]. The at such low velocities lose their energy predominantly by inducing some electronic excitations in the target material, whereas the contribution from collisions with the atomic nuclei is negligible. Fermi and Teller [265] predicted that would then be roughly proportional to using the following simple argument: the conduction in metals can be treated as a free degenerate gas with a thermal distribution of velocities having a maximum value which is larger than . Only the fast classes of having velocities close to can then collide with the , since the Pauli principle prevents slower from scattering into the final states that are already occupied in the conductor. The number of such high-speed per unit volume in the material is of order , whereas the collision cross section is around and the energy transfer per collision . The stopping power can then be estimated as, , which implies its proportionality against the velocity.
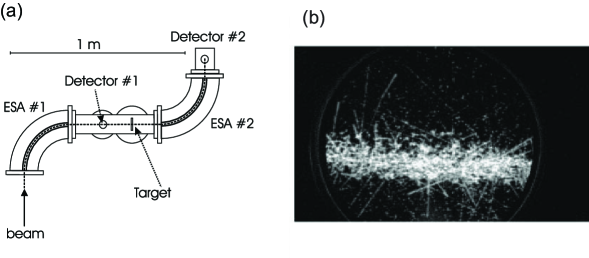
Stopping powers linear to the projectile velocity have indeed been observed in most experiments involving positive ion beams. Deviations from this proportionality have only been observed in He [266] and Ne [267] targets. The theoretical interpretation of these results was greatly complicated by charge-exchange effects in which the projectile ions can capture from the target atom. No such capture is possible in the case, and so the velocity-proportional can be directly studied.
The measurements were carried out by allowing beams of energy 18–63 keV to enter a pair of 90-degree electrostatic spherical analyzers (Fig. 32 (a)). The first analyzer [268] selected with energy . The beam then traversed a target foil of thickness –40 , and a second analyzer which measured the energy of the emerging beam centered around . The stopping power at an average energy was then determined as . By suitably biasing the foil with a DC potential, the values at various energies could be rapidly measured. The that traversed the two analyzers struck a micro-channel plate (MCP) read out by a charged-coupled device (CCD) detector located at the end of the experiment. The position resolution of mm on the MCP yielded an energy resolution of as shown in Fig. 32 (b). The tracks seen here are produced by heavy ions recoiling from annihilations on the surface of the MCP [268].
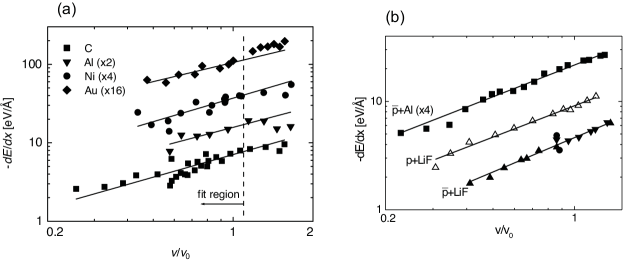
Fig 33 (a) shows the measured values for C, Al, Ni, and Au targets as a function of velocity normalized to the Bohr velocity . As expected, a linear dependence was observed below . The experimental results agreed for some targets and velocity ranges with theoretical calculations based on the free electron gas [269, 270], quantum mechanical harmonic oscillator [271], and classical binary scattering models [272]. The stopping powers were of the ones due to the Barkas effect, in which the polarization of the target induced by the passage of causes a reduction in [273].
In the case of wide-band gap insulators, it was theoretically predicted that the values would strongly deviate from a linear dependence and possibly exhibit a threshold effect [267]. This is because when the projectiles ions are very slow, the in the target cannot easily excite over the band gap. Surprisingly however, the measured stopping powers for both [274] and were found [22] to have a linear dependence between energies of 2 and 50 keV (Fig. 33 (b)). The reason for this is not understood.
7.2 Atomic and molecular ionization cross sections
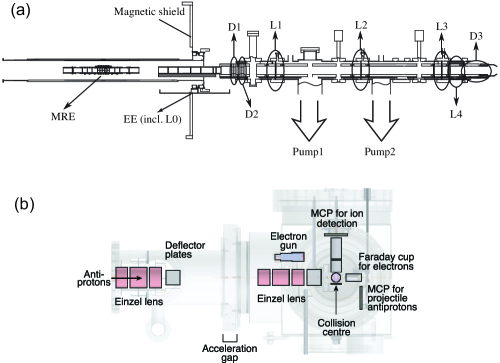
The total cross sections for of kinetic energy –25 keV ionizing He and Ar targets were also measured [24, 275]. The ionization processes of atoms by slow charged particles are not fully understood [276], because the correlations between the many in the system make it difficult to theoretically treat this dynamic problem. As in the measurements described in Sect. 7.1, the is an ideal projectile to study this since there is no complication from charge transfer.
This experiment involved first trapping some in a Penning trap (Fig. 34 (a)), and cooling them to sub-eV energies by mixing the with a cloud of also confined in the same trap [33]. The diameter of the cloud was compressed to a few millimeters by applying a rotating electric field on it [277, 103, 102]. The were then extracted from the trap as a continuous beam, and transported through an electrostatic beam transport line [278] to the experimental target. The beam passed through three apertures (indicated by L1–L3 in Fig. 34 (a)) which separated the ultrahigh vacuum in the trap from contamination gases originating from the target. The beam was accelerated to energy 2–25 keV and steered through a gas jet target (Fig. 34 (b)) consisting of a mixture of helium and argon. The emerging from the target were detected by a MCP detector, whereas the ions were extracted by a 333 Vcm-1 electric field in a perpendicular direction to the beam, and focused onto a second MCP.
The He and Ar ionization events were isolated using time-of-flight methods, by recording the timing difference between the arrivals of the and ion. The cross sections were obtained using the relation, , where and denote the number of ions and events, the integral of the gas density along the projectile path, and the efficiency of detecting the ions. The value was calibrated in a separate experiment involving the ionization of the gas by a 3-keV beam.
The single-ionization cross sections for He measured at energies –30 keV are plotted in Fig. 35 (indicted by filled triangles [24]), together with past experimental results measured at the higher beam energies of LEAR (squares [279] and circles [280]). They are compared with the results of numerous theoretical calculations [281, 282, 283, 284, 285, 286, 287, 288, 289, 290, 291, 292]. The results of a time-dependent density functional theory with an optimized effective potential and self-interaction correction [291] showed the best overall agreement with the experimental data, including the region around the maximum of the cross section.
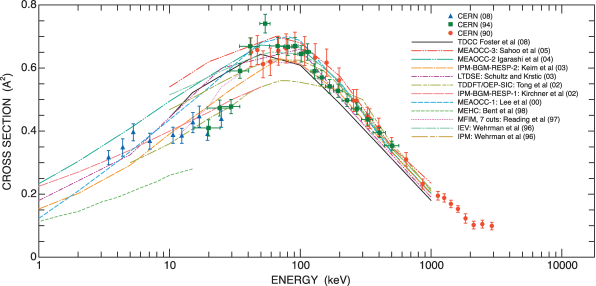
Ionization measurements were also carried out for molecular D2 targets, by detecting the D ions emerging from single, nondissociative ionizing collisions with [25]. In Fig. 36, the measured cross sections for D2 [25] and He [24] targets are compared for atomic Bohr velocities of the between 0.3 and 1.5 a.u. The -value for He is roughly constant between 0.4–1 a.u., with a slightly decreasing tendency towards lower velocities. The cross sections for atomic H for this velocity region has never been measured, but a similar behavior is predicted by two theoretical calculations, the results of which are indicated by green [293], brown [294], and black [286] dashed-dotted lines. Surprisingly, the values for molecular D2 were roughly linear to in the region 0.3–1.0 a.u., in contrast to the behavior of atomic targets. The experimental data also disagrees with the results of two-center atomic orbital close coupling calculations [295]. Intensive theoretical studies are now underway to understand these issues.
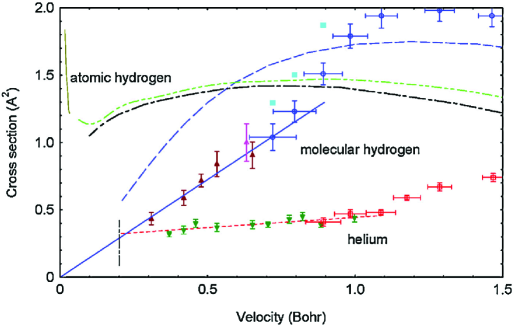
7.3 Nuclear annihilation cross sections
Numerous experimental groups have used the LEAR facility to measure the cross sections of with kinetic energy MeV colliding with various target nuclei, and undergoing annihilation. In the semiclassical regime at relatively high energy, where the de-Broglie wavelength of the is small compared to the radius of the target nucleus of mass number , is naïvely assumed to be independent of and roughly equal to the geometric cross section, . In such a model the target nucleus resembles a simple black disk. Measurements with antineutron () beams [296] of energy MeV annihilating on various targets have indeed shown a behavior.
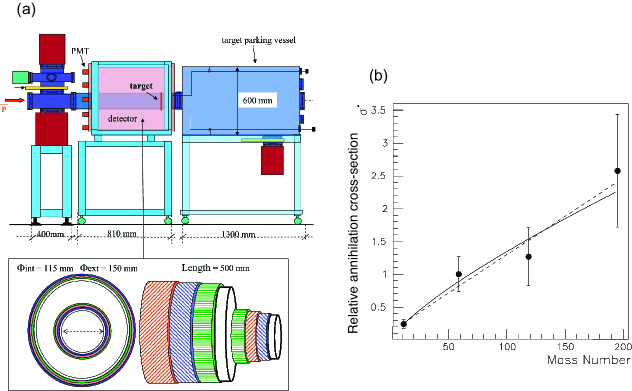
The annihilation cross sections of negatively-charged at kinetic energies MeV are theoretically assumed to be enhanced by the Coulomb force, which attracts the trajectory of the towards the nucleus of charge and mass . The sum of this Coulomb focusing and the black disk [297] then yields,
| (31) |
where denotes the dielectric constant of vacuum. Eq. 31 implies that at very low energies the dependence on the mass number scales as . This has never been experimentally verified due to the fact that such low energy, high intensity beams needed to measure were not available at LEAR. In fact, past LEAR experiments in the region MeV [298, 299, 300, 301, 302, 303, 304, 305, 306] have been generally limited to gas (e.g., H2, D2, 3He, 4He, and Ne) targets, whereas solid targets have not been studied.
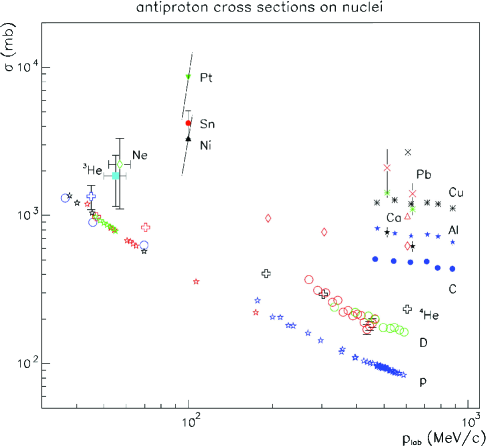
The values at MeV were recently measured [26] using Mylar, Ni, Sn, and Pt targets. The pulsed beam arriving from the AD normally resulted in such a high instantaneous rate of annihilations on the experimental target, that it would be difficult to resolve and count the individual events needed to determine . This problem was solved by using annihilation detectors of high spatial granularity [307] to isolate the individual annihilations, and by changing the time structure of the beam to reduce the instantaneous rate. The circulating in the AD were divided into six pulses which were distributed equidistantly around its 190-m-circumference. Each pulse of length 40–50 ns was then sequentially extracted to the experiment at intervals of s. The experimental apparatus (Fig. 37 (a)) consisted of a 1-m-long, 150-mm-diameter vacuum chamber that contained 0.9--thick Mylar target foils. Ni, Sn, and Pt layers were sputtered on the Mylar surface, their thicknesses calibrated to a precision of 5–40 nm by separate Rutherford backscattering measurements using an source. The target was surrounded by three layers of scintillating fibers that reconstructed the tracks of the and emerging from the annihilations with a spatial resolution of 3–5 mm.
For each target, the number of reconstructed vertices representing antiproton annihilations in the foil were counted. The annihilation cross section was determined from this data using the formula, , where , , and denote the atomic weight, density, and thickness of the target, the Avogadro’s number, and the efficiency of detecting an annihilation vertex. It was difficult to precisely determine the number of contained in the pulsed beam, but approximate values were estimated by counting the small fraction of undergoing Rutherford backscattering in the target, and annihilating in the lateral walls of the chamber. This introduced a relatively large uncertainty on the absolute normalization of . Experimental values of , , and b were obtained for the Ni, Sn, and Pt targets. This was consistent with the theoretical value 4.9 b for Sn, obtained from a black-disk model with Coulomb corrections [297]. In Fig. 37 (b), the relative cross sections are shown as a function of . The results were consistent with the expected dependence within the relatively large error bars. In Fig. 38, the results are compared with past cross sections measured for traversing various gas and solid foil targets [298, 299, 300, 301, 302, 303, 304, 305, 306, 308, 309, 310, 311, 312].
Recently, beams of energy 130 keV decelerated by the RFQD were directed [313] through 70-nm-thick foils of C, and other targets with 5–19 nm of Pd and Pt evaporated on the C foil surface [314]. Whereas the majority () of the passed through the thin foils, a small amount annihilated by undergoing in-flight reactions with the target nuclei, or underwent Rutherford scattering. These foil annihilations were measured by plastic scintillation counters surrounding the target. This may lead to quantitative measurements of at energies keV.
7.4 Cancer therapy using antiproton beams
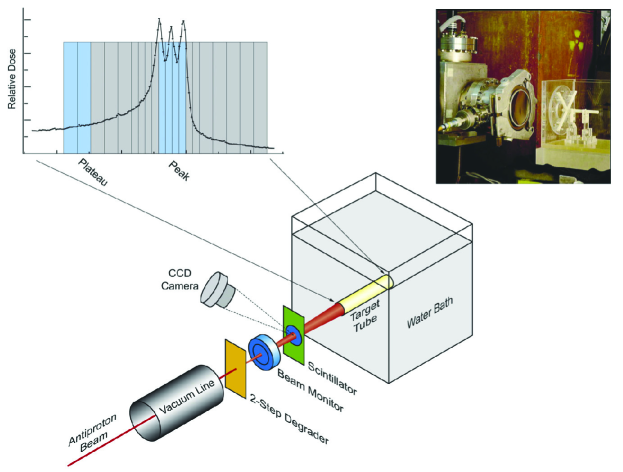
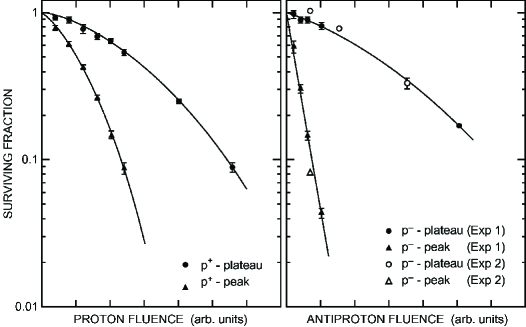
The Antiproton Cancer Experiment (ACE) measured the biological effectiveness of beams destroying cancer cells [27, 315]. In conventional radiation therapy involving accelerators, patients are irradiated by , , or heavy ion beams [316, 317] that reach tumors located at typical depths of –200 mm. During the passage of these projectiles through cancer cells, free radicals and are created which can interact with the biomolecules and destroy them. While single-strand breaks of DNA can be efficiently repaired by the cell, double-strand breaks are more permanent and lead to the deactivation of the cell. Ideally, the beam should deactivate the cancer cells that lie within a small volume relative to the total size of the tumor, while sparing the outside healthy cells. Thus the shape of the energy loss or Bragg curve along the trajectory of the penetrating particle is important. Gray and Kalogeropoulos [318] suggested that may be superior to other particles in this respect, since in addition to the energy loss of the , its subsequent annihilation in a cancer cell deposits some additional 20–30 MeV of energy close to the annihilation point [319]. Ions with MeV-energies are created either by nuclear recoil or fission following the annihilation, and since the range of these are short (), biological damage is expected to stay within the proximity of the annihilation.
The ACE collaboration irradiated samples of V79-WNRE Chinese hamster cancer cells with pulsed beams of energy MeV provided by the AD (Fig. 39). The cells were suspended in a gel placed in a plastic tube, and the tube in turn was positioned in a bath of glycol-water mixture which mimicked a patient’s body. After irradiation, the gel was cut in 0.5-mm-thick slices, and the clonogenic survival of the cells in each slice was measured. Comparative measurements were made with 50-MeV protons and 60Co gamma rays.
In Fig. 40, the clonogenic survival fractions of cancer cells measured near the plateau of the Bragg peak, and the plateau near the target surface, are compared as a function of the fluence of and beams in arbitrary units. The biological effective dose ratio (BEDR) is defined as the ratio of beam fluences which create a certain clonogenic cell survival (for example 20) in the peak versus the plateau of this energy deposition curve. This corresponds to cell survival in respectively the cancer tumor versus the healthy tissue along the incoming path. ACE found that the BEDR for is times larger than for protons. The authors claim this stems from two contributions: the increase in dose deposition in the Bragg peak due to the annihilation, and the fact that the dose is deposited mainly by heavy fragment ions. They also pointed out that the BEDR improvement is substantial; Levegrün et al. [320] showed that an increase of dose administered to a prostate cancer from 60 to 90 Gy increases the tumor control probability from 15 to .
The authors also found that the cell deactivation outside the Bragg peak is small. For example, for a induced dose which resulted in a cell survival of around 15 in the Bragg peak, the cell survival was better than 95 only 2 mm downstream of the position where the stopped. This is due to the fact that the secondary radiation caused by antiproton annihilation that penetrates over long distances ( mm) consists mostly of minimum-ionizing particles.
8 Future experiments and facilities
8.1 Extra Low ENergy Antiproton (ELENA) ring
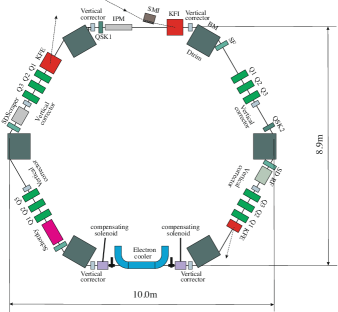
CERN and the AD user community are now constructing the Extra-Low Energy Antiproton (ELENA) facility (Fig. 41), which is a magnetic storage ring of circumference m located inside the AD ring [37, 321]. The 5.3-MeV provided by AD will be injected into ELENA, where they will be decelerated over a 20-s cycle to keV. The magnetic fields of the six dipole magnets in the hexagonal ring (Fig. 41) will be decreased from 3000 to 500 Gauss during this deceleration. Electron cooling will reduce the emittance and momentum spread of the beam to mm mrad and . For this the circulating beam at momenta 35 and 13.7 MeV/c are merged with an beam of respective energies 355 and 55 eV, and currents 15 and 2 mA over a 1-m-long interaction region. The beam must have small transverse (0.1 eV) and longitudinal energy spreads, to avoid heating the beam. To prevent the rapid increase in the diameter of the beam due to collisions with residual gases, the vacuum inside ELENA must be maintained better than mbar. Four 300-ns-long pulses, each containing , will be extracted using two electrostatic ejection kickers located inside ELENA. This beam will be delivered to several experiments simultaneously. For this m of beamlines containing electrostatic quadrupoles and dipoles will be installed.
The low energy and small emittance of the ELENA beam is expected to allow the existing ATRAP, ALPHA, and AEIS experiments to capture and accumulate times more in Penning traps per unit time, compared to directly using the 5.3-MeV AD beam. Significant improvements in the atomic spectroscopy and collision experiments of ASACUSA are expected as well. Additional beamlines will be constructed for new collaborations, e.g. GBAR. The building and commissioning of ELENA will take place between 2013–2017.
8.2 Towards antihydrogen laser spectroscopy
Much of the fascination which drives the present trapping experiments arise from the prospect to test symmetry at unprecedented levels of precision, by carrying out ultrahigh-precision laser spectroscopy of .
8.2.1 Ultrahigh-resolution laser spectroscopy of hydrogen
The metastable state of H has a long lifetime (122 ms) because the electric-dipole transition to the ground state is forbidden by the parity selection rule. The transition can be excited by two counterpropagating ultraviolet laser photons at wavelength nm, which cancel the linear Doppler shift in the resulting resonance profile [322]. These excitations to the state can be readily detected by applying a weak electric field (several V/cm is enough, see [323], Sect. 67) which mixes the state with the short-lived state by Stark effects. The state has a lifetime of 1.6 ns and decays by emitting a Lyman- photon of wavelength 122 nm.
Over the last four decades since the pioneering experiment of Ref. [322] which employed a cold atomic H beam, the spectral resolution of the Doppler-free two-photon laser spectroscopy has been improved by a factor of . The observed linewidth of the resonance now reaches levels of kHz [161, 324, 325]. The results have been used to determine the Lamb shift in the ground state [326], the Rydberg constant [327], the H–D isotope shift [328, 329], the deuteron structure radius [328], and a constraint on the variation of the fundamental constants [324]. For a review which includes a discussion of the development of the theory, see Ref. [330].
The transition of H atoms confined in a neutral magnetic trap have also been studied by laser spectroscopy [331]. These experiments are the culminations of a long effort at MIT and Amsterdam to observe Bose-Einstein condensation (BEC) in H, which date much before the introduction of magnetic trapping techniques of neutral atoms [332], see Ref. [333] for an account of the early history. The techniques of magnetic trapping and evaporative cooling of H [334, 335] eventually enabled BEC in H, which was detected by measuring the accompanying collisional frequency shifts in the transition [336, 166].
8.2.2 Laser cooling of trapped antihydrogen
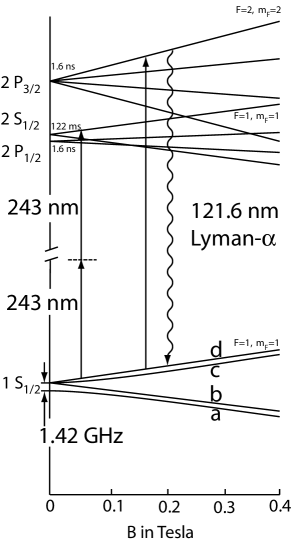
Future experiments on high-resolution laser spectroscopy of will likely utilize trapped atoms [339]. One problem is that external magnetic fields shift the () transition frequency by an amount 186 kHz T-1. To reduce the magnetically-induced broadening [339, 340] of the spectral line, it is important to cool atoms and minimize their spatial distribution in the inhomogeneous magnetic field of the trap. Although evaporative cooling has been used with great success in the case of ordinary H and has enabled BEC, it is unlikely to be of much use in the case of due to the small number of atoms that can be trapped [341].
Laser cooling of , on the other hand, does not require having high atom densities or numbers, and can be carried out by utilizing the strong electric dipole transition at wavelength 122 nm. Laser cooling with Lyman- radiation has been discussed by several authors [342, 343, 344], while alternative laser-cooling methods have also been proposed for H [345, 346]. Most encouragingly, laser cooling of H confined in a magnetic trap to temperatures of a few millikelvin has been demonstrated by using a pulsed Lyman- source [347].
Generating coherent Lyman- radiation is a challenge, since there are no tunable lasers or nonlinear frequency-doubling crystals available for that spectral region. Sum-frequency generation of several incident laser beams that utilize the nonlinear susceptibility of atomic vapors and gases is commonly used. Four-wave sum-frequency mixing produces the sum-frequency of three fundamental beams [348] and has been employed to generate pulsed laser radiation at Lyman-, typically using Kr gas [349, 350, 351, 352, 353]. Continuous-wave (cw) coherent radiation at Lyman- can have distinct advantages for laser-cooling of , compared to typical pulsed sources that have ns-scale pulse lengths. Since the pulse length is comparable to the lifetime of the states of 1.6 ns, only a few excitations can be induced per per laser pulse, and moreover the rate of laser cooling is limited by the pulse repetition rate. A cw source on the other hand can provide a larger rate for laser cooling. Its smaller spectral bandwidth provides higher selectivity for magnetic substates of in the trap, thereby reducing losses due to spurious optical pumping to the untrapped magnetic sublevels and in Fig. 42.
The cross section for Lyman- light being resonantly absorbed by can be as high as [354]. This implies that the excitation rate for illuminated with a 1 nW Lyman- laser beam with diameter of 1 mm is 5 s-1. Suppose that we would like to cool confined in a magnetic trap starting with an initial temperature of 1 K which corresponds to an average velocity of 150 m s-1. The average velocity change per excitation is 3.3 m s-1, and so cooling to temperatures close to the Doppler- and recoil-limits could be completed in less than a minute using only 1 nW of laser power.
An important difference between pulsed and cw Lyman- generation is that the power levels of cw fundamental beams are many orders of magnitude lower than the peak powers typically used in pulsed Lyman- generation. The cw Lyman- generation therefore requires the use of resonances and near-resonances in the nonlinear optical medium. In the case of pulsed sum-frequency mixing, close resonances are usually avoided as they can cause premature saturation of the VUV yield due to step-wise excitation and multi-photon ionization.
Currently, cw Lyman- laser light can be generated at power levels of up to 20 nW using mercury vapor as a nonlinear optical medium and three fundamental laser beams. The first laser is tuned to the longer wavelength side of the transition in mercury at a wavelength 253.7 nm. The second fundamental beam at 408 nm establishes an exact two-photon resonance with the state. The wavelength of the third fundamental light field at 545 nm is chosen such that the sum-frequency is at Lyman-. Bound states in mercury such as and contribute significantly to the nonlinear susceptibility [355]. The first cw coherent Lyman- source [356, 357, 358] employed up to three large-frame argon-ion lasers, which limited the reliability of Lyman- generation. A new cw Lyman- source has therefore been set up based on solid-state laser systems [359, 360, 361]. It is hoped that this source will be a reliable basis for laser-cooling of in a magnetic trap. The limits for laser-cooling with Lyman- are in the millikelvin range [342] which is cold enough to enable spectroscopy at a precision in the kHz range and below. This corresponds to a test of symmetry at a precision better than a few parts in .
8.3 Higher-precision microwave spectroscopy of the antihydrogen hyperfine structure
As described in Sect. 4.6, the ALPHA collaboration has recently measured the ground-state hyperfine structure of confined in a magnetic bottle trap with a relative precision of [11]. The authors note that this was a first proof-of-principle measurement, and no attempt was made to accurately determine the spectroscopic lineshape. Further improvements in the experimental precision can be expected in the nearest future. One source of systematic error is caused by the Zeeman shift in the microwave transition frequencies induced by the inhomogeneous magnetic field in the atom trap. ALPHA intends to reduce this error by constructing a trap with an extended area near the center with a relatively homogeneous field where the spectroscopy can be carried out. They also intend [11, 362] to measure the nuclear magnetic resonance (NMR) transition between the two energetically lowest hyperfine levels (denoted in Fig. 17). Since this transition frequency has a minimum value 765483207.7(3) Hz at a magnetic field of T [363], experiments carried out using traps with this field strength will be relatively free from the effects of inhomogenities in the magnetic fields shifting or broadening the resonance. In this way, the collaboration expects to achieve an experimental precision of .
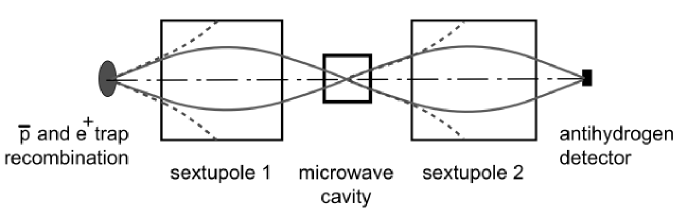
An alternative method to measure the microwave transition is pursued by the ASACUSA collaboration [146] (Fig. 43). Here a beam of emerging from the trap is allowed to pass through a sextupole magnet, which focuses the occupying the low-field-seeking states towards the beam axis, whereas the high-field seekers are defocused. The beam which is spin-polarized in this way then traverses a microwave cavity where a spin-flip transition (e.g., from a low-field-seeking to a high-field seeking state) is induced. The transition is probed by allowing the to traverse a second analyzing magnet, which focuses atoms occupying the low-field-seeking states onto a detector. The experimental precision is here determined by the velocity, temperature, and emittance of the beam, and may achieve a precision similar to the ALPHA experiment described above. Simulations indicate that the beam emerging along the axis of the anti-Helmholtz field of the cusp trap may be spin polarized, thereby avoiding the necessity of the first sextupole magnet [167]. Efforts are currently underway to obtain a cold, high-intensity beam.
8.4 Antihydrogen experiments to measure antimatter gravity
The inertial mass of has been measured with a precision of [16] by combining the results of cyclotron frequency measurements in Penning traps [71] with laser spectroscopy of (see Sect. 5). The gravitational mass of (or antiparticles in general), however, has never been measured; the equivalence principle, which is at the heart of general relativity, has never been tested with antimatter. Interest in such questions is enhanced by the unknown origin of the acceleration of the expansion of the universe and by the hypothesis of dark matter, which both suggest that our understanding of gravitation may be incomplete. For possible scenarios of anomalous gravitational behavior and a general overview, see Refs. [364, 365, 366, 367].
Previous attempts to measure the gravitational acceleration of and have been unsuccessful, due to the fact that the trajectory of the charged particles were deflected by stray electric fields in the experimental apparatus [368]. Two collaborations, AEIS and GBAR, are now attempting to measure instead the antimatter gravity of neutral for the first time using novel methods. Gravitational experiments using ordinary atoms have produced impressive results for quite some time (see e. g. [369, 370]), although none of them have involved H, since this atom is difficult to manipulate.
8.4.1 The AEIS antimatter gravity experiment
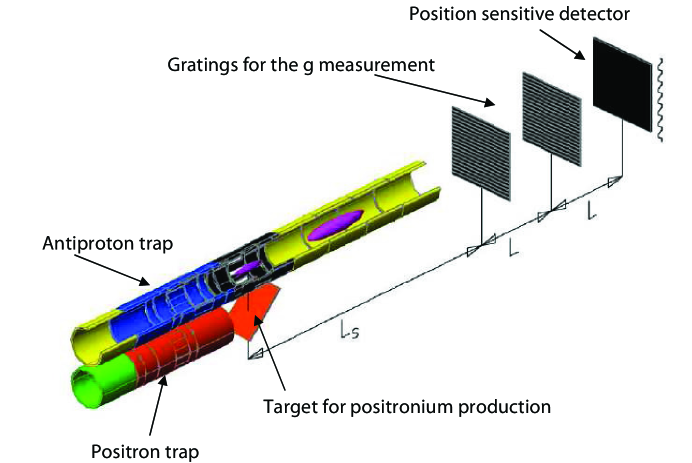
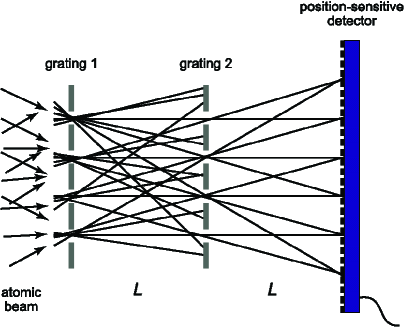
The proposed AEIS antimatter gravity experiment (Fig. 44) [371, 372, 373] will produce cold in resonant charge-exchange collisions of Rydberg and . The will be produced in ultrahigh vacuum by allowing to collide with a porous SiO2 converter. The resulting will then be excited using two laser beams, the first at wavelength 205 nm which induces the transition , and the second one at wavelength 1650–1700 nm which excites the transition from to the final Rydberg state. The laser pulses needed for this will be produced by parametric generation and amplification [374]. The Rydberg will thus be produced as a pulsed beam. The population distribution of among the Rydberg states will be controlled by adjusting the wavelength of the second laser beam. The Rydberg will then be accelerated along the axis of the trap by electric fields, so that a beam of temperature 100 mK emerges from the trap.
The free fall of cannot be directly measured using this beam, because the radial beam divergence and the distribution of vertical starting positions will be too large. These problems can be solved by utilizing a Moiré deflectometer, which consists of two gratings and a position-sensitive detector (Fig. 45). The diffraction effect of in this device due to the de-Broglie wavelength is negligible, since the grating period is relatively large. The gratings instead select the propagation direction of the incoming beam. The atoms that traverse the two gratings then strike a position-sensitive silicon detector, producing a shadow image comprising a set of fringes. The free fall of the atoms induces a shift in the fringe positions, which can be used to determine the gravitational acceleration of antimatter. Here denotes the time-of-flight of traversing the distance between the two gratings. It can be experimentally determined by measuring the time interval between the arrival of the laser pulse which induces recombination, and the detection of at the position-sensitive silicon detector. Simulations have shown that a measurement of to 1 % relative precision requires about 105 atoms with a temperature of 100 mK in AEIS [371].
8.4.2 The GBAR antimatter gravity experiment
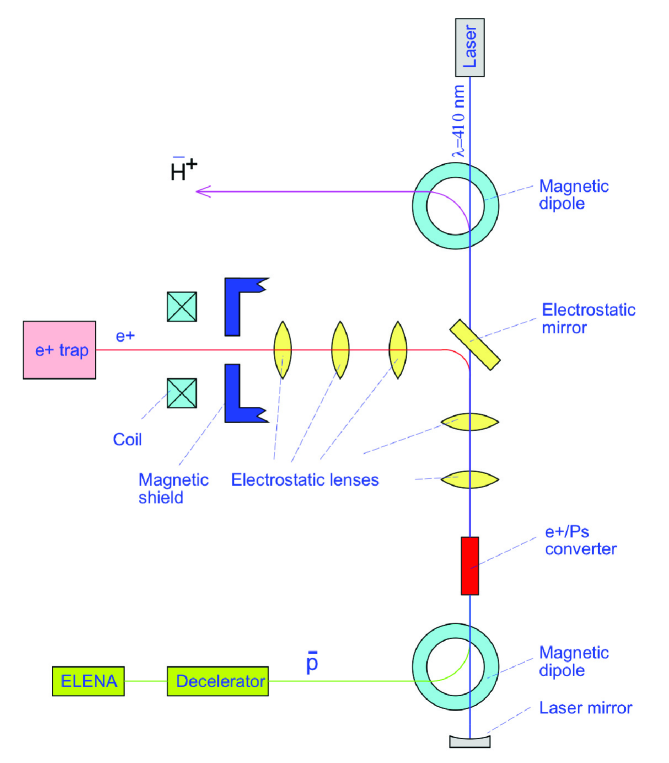
The GBAR collaboration plans to produce ultracold of even lower () temperatures, and directly measure antimatter gravity in a time-of-flight experiment [375, 36]. Laser-cooling with Lyman- radiation cannot be used to achieve such ultracold temperatures, because both the Doppler- and recoil-limits for are in the mK range. Instead GBAR will first produce positive antihydrogen ions (), confine them in an ion trap together with ultracold laser-cooled ions (such as Be+), and utilize sympathetic cooling [376]. The ultracold can then be irradiated with a laser pulse to photodetach and neutralize it. This laser pulse can also define the start timing for a measurement of the time-of-flight of falling to an annihilation detector located some 100 mm below the trap. From this time-of-flight, the gravitational acceleration can be determined. Some 500 000 at a temperature of 20 may be sufficient to determine with a relative precision of .
This scheme involves ions, which have not been produced yet. Whereas negative ions are commonly produced by asymmetric dissociation of H2 molecules, this formation method is excluded in the case as there are no molecules available so far. The GBAR experiment proposes to use an alternative method involving charge-exchange with as shown in Fig. 46,
| (32) |
This requires high densities of atoms [377]. For this an intense source of slow based on pair production with a beam of electrons from an industrial linac is being developed [378, 379].
8.5 Sub-ppb-scale determination of the antiproton-to-electron mass ratio by laser spectroscopy of antiprotonic helium
The experimental precision on the antiproton-to-electron mass ratio determined by laser spectroscopy of is currently around a factor of worse than the proton-to-electron value recommended by CODATA, obtained by statistically averaging several experimental results having a lower precision [223]. Some states have lifetimes of 1–2 against annihilation, corresponding to a natural width of kHz. This implies that a laser transition frequency of 1–2 PHz between two such states can in principle be measured to a fractional precision of better than .
One of the factors which limited the experimental precision to in Ref. [16] was the relatively small number of that could be stopped in the experimental helium target to synthesize the atoms. The AD provided a pulsed beam containing every 100 s, but after deceleration in the RFQD, the beam emittance and energy spread became so large (100 mm mrad and keV) that most of the were not stopped in the He target but rather annihilated in the inner walls of the RFQD and beamlines, or the walls of the experimental apparatus. The and emerging from all these annihilations caused a large background in the experimental data. Monte-Carlo estimations indicate that the higher intensity and lower emittance of the electron-cooled beam available from ELENA would increase the number of synthesized by a factor of , whereas the background annihilations would be suppressed by an order of magnitude. This would improve both the statistical error and signal-to-noise ratio in the experimental data.
The theoretical uncertainty on the transition frequencies is currently limited [17] to around by the uncalculated radiative QED corrections with orders higher than . Recent advances in the techniques of calculating higher-order terms in the H and He cases is expected to allow the transition frequencies to soon be calculated to a precision of .
8.6 Higher-precision determination of the antiproton magnetic moment
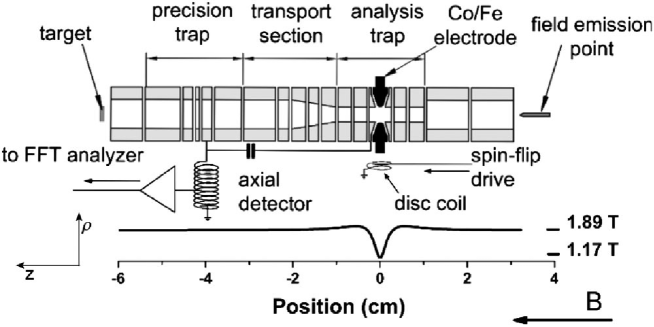
The ATRAP collaboration is continuing efforts to improve the experimental precision on the magnetic moment, beyond their current limit of by attempting to detect individual spin-flips of a single confined in a Penning trap. The or will first be confined in a “precision” Penning trap with a pure solenoidal field, where a spin-flip is induced by an oscillating field applied to one of the electrodes. This spin-flip is detected by transferring the particle to an adjunct analysis trap which has a quadrupole magnetic field superimposed on the solenoid field, and using the continuous Stern-Gerlach effect described in Sect. 6. An additional improvement of 103 on the experimental precision of is believed to be possible. Another collaboration (Baryon Symmetry Experiment, BASE) has recently proposed a similar measurement (Fig. 47). These direct comparisons of and would provide an important test of the consistency of symmetry. When combined with the hyperfine structure experiments on , they may also help to derive constraints on the internal structure of .
8.7 Reaction MIcroscope (ReMI) in ELENA
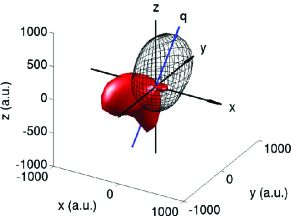
The total ionization cross sections of on atomic and molecular gas targets that were recently measured (Fig. 35) are in good agreement with several theoretical models. Future measurements will instead concentrate on the differential cross sections which will impose far stronger constraints on the models. For example in Fig. 48, two sets of differential cross sections for single ionization of He by 3 keV are shown, calculated by using first Born approximation (indicated by the transparent meshed area) and a more advanced coupled pseudostate approximation (filled red area). Whereas the total cross sections calculated by the two methods give similar values, the differential cross sections differ substantially [380].
One possible way to carry out this experiment involves placing a reaction microscope [381] within the ELENA ring. The circulating of energy keV are allowed to make multiple passes through a gas jet target. The angular distributions of the recoiling and ion pairs are analyzed using a magnetic Helmholtz field and a parallel electrostatic acceleration field superimposed around the gas jet. This setup will allow a kinematically complete experiment to be carried out, providing a measurement of the differential cross section similar to the ones shown in Fig. 48 over a solid angle of .
9 Conclusions and discussions
The first twelve years of AD operation have seen the first trapping of neutral atoms, and microwave excitations of magnetic transitions between the ground-state hyperfine sublevels. Ppb-scale laser spectroscopy of atoms has yielded a new value for the antiproton-to-electron mass ratio. The magnetic moment of a single confined in a Penning trap was measured with a fractional precision of , and further improvements in the experimental precision may be possible in the near future. Several atomic and nuclear collision experiments were carried out for the first time at kinetic energy ranges of 2–5000 keV, while the biological effectiveness of beams deactivating cancer cells were measured.
Higher-precision spectroscopy experiments on and appear to be possible in the near future. The magnetic moment of confined in Penning traps may be measured with times higher precision. The first two-photon laser spectroscopy experiments on the interval of are anticipated. Meanwhile, experiments to measure the gravitational acceleration of have begun. The new ELENA facility of CERN will allow experiments to confine 10–100 times more in traps than before. On the other hand, a new reaction microscope installed in ELENA may allow kinematically complete experiments to be carried out on 100-keV ionizing atomic or molecular gasses.
10 Acknowledgments
We thank the AD user community, the CERN AD operations group, and ELENA construction team for the many years of dedicated efforts described in this review article. We are indebted to H. Higaki, V.I. Korobov, S. Maury, W. Oelert, and S. Ulmer for discussions. This work was supported by the Bundesministerium für Bildung und Forschung, the Deutsche Forschungsgemeinschaft (DFG), the European Science Foundation (EURYI), and the European Research Council (ERC-Stg).
References
- [1] S. Maury, Hyperfine Interact. 109 (1997) 43.
- [2] P. Belochitskii, T. Eriksson, and S. Maury, Nucl. Instrum. Meth. Phys. Res. A 214 (2004) 176.
- [3] M. Amoretti et al., Nature 419 (2002) 456.
- [4] G. Gabrielse et al., Phys. Rev. Lett. 89 (2002) 213401.
- [5] C.H. Storry et al., Phys. Rev. Lett. 93 (2004) 263401.
- [6] Y. Enomoto et al. Phys. Rev. Lett. 105 (2010) 243401.
- [7] G.B. Andresen et al,, Phys. Rev. Lett. 105 (2010) 013003.
- [8] G.B. Andresen et al., Nature 468 (2010) 673.
- [9] G.B. Andresen et al., Nature Physics 7 (2011) 558.
- [10] G. Gabrielse et al., Phys. Rev. Lett. 108 (2012) 113002.
- [11] C. Amole et al., Nature 483 (2012) 439.
- [12] R.S. Hayano, M. Hori, D. Horváth, E. Widmann, Rep. Prog. Phys. 70 (2007) 1995.
- [13] M. Hori et al., Phys. Rev. Lett. 87 (2001) 093401.
- [14] M. Hori et al., Phys. Rev. Lett. 91 (2003) 123401.
- [15] M. Hori et al., Phys. Rev. Lett. 96 (2006) 243401.
- [16] M. Hori et al., Nature 475 (2011) 484.
- [17] V.I. Korobov et al., Phys. Rev. A 77 (2008) 042506.
- [18] T. Pask et al., Phys. Lett. B 678 (2009) 55.
- [19] A. Kreissl et al., Z. Phys. C 37 (1988) 557.
- [20] J. DiSciacca et al., Phys. Rev. Lett. 110, 130801 (2013).
- [21] S.P. Møller et al. Phys. Rev. Lett. 88 (2002) 193201.
- [22] S.P. Møller et al. Phys. Rev. Lett. 93 (2004) 042502.
- [23] S.P. Møller et al. Eur. Phys. J. D 46 (2008) 89.
- [24] H. Knudsen et al. Phys. Rev. Lett. 101 (2008) 043201.
- [25] H. Knudsen et al. Phys. Rev. Lett. 105 (2010) 213201.
- [26] A. Bianconi et al. Phys. Lett. B 704 (2011) 461.
- [27] M.H. Holzscheiter et al. Radiotherapy and Oncology 81 (2006) 233.
- [28] J. Eades, F.J. Hartmann, Rev. Mod. Phys. 71 (1999) 373.
- [29] G.B. Andresen et al. Phys. Rev. Lett. 105 (2010) 013003.
- [30] G. Gabrielse et al. Phys. Rev. Lett. 106 (2011) 073002.
- [31] Y. Bylinsky, A. M. Lombardi, and W. Pirkl, Proceedings XXth International Linac Conference, 21-25 August 2000, Monterey, California, USA.
- [32] A. M. Lombardi, W. Pirkl, and Y. Bylinsky, Proceedings of the 2001 Particle Accelerator Conference (Chicago, Illinois, 2001).
- [33] N. Kuroda et al. Phys. Rev. Lett. 94 (2005) 023401.
- [34] G. Bonomi et al., Hyperfine Interact. 193 (2009) 297.
- [35] M. Doser, J. Phys.: Conf. Ser. 264 (2011) 012006.
- [36] P. Debu et al., Hyperfine Interact. 212 (2012) 51.
- [37] M.-E. Angoletta et al., ELENA - an updated cost and feasibility study, CERN-BE-2010-029 OP, CERN, Geneva (2010).
- [38] J. Beringer and Particle Data Group, Phys. Rev. D 86 (2012) 010001.
- [39] D. Dubbers and M.G. Schmidt, Rev. Mod. Phys. 83 (2011) 1111.
- [40] C.A. Baker et al. Phys. Rev. Lett. 97 (2006) 131801.
- [41] J.H. Christenson et al. Phys. Rev. Lett. 13 (1964) 138.
- [42] E. Abouzaid et al. Phys. Rev. D 83 (2011) 092001.
- [43] A. Lai et al. Phys. Lett. B 645 (2007) 26.
- [44] B. Aubert et al. Phys. Rev. Lett. 87 (2001) 091801.
- [45] K. Abe et al. Phys. Rev. Lett. 87 (2001) 091802.
- [46] R. Aaij et al. Phys. Rev. Lett. 108 (2012) 201601
- [47] R. Aaij et al. Phys. Rev. Lett. 108 (2012) 111602.
- [48] W. Pauli, L. Rosenfeld, and V. Weisskopf, Niels Bohr and the Development of Physics, Pergamon (1955).
- [49] G. Lüders, Ann. Phys. 2 (1957) 1.
- [50] R. Jost, Helv. Phys. Acta 30 (1957) 409.
- [51] R.F. Streater and A.S. Wightman, PCT, Spin, Statistics and All That (Benjamin, New York, 1964) and references therein.
- [52] O.W. Greenberg, Phys. Rev. Lett. 89 (2002) 231602.
- [53] M. Chaichian, A.D. Dolgov, V.A. Novikov, and A. Tureanu, Phys. Lett. B 699 (2011) 177.
- [54] D. Colladay and V.A. Kosteleckỳ, Phys. Rev. D 55 (1997) 6760.
- [55] D. Colladay and V.A. Kosteleckỳ, Phys. Rev. D 58 (1998) 116002.
- [56] V.A. Kosteleckỳ and N. Russell, Rev. Mod. Phys. 83 (2011) 11.
- [57] N.E. Mavromatos, Lecture Notes in Physics 669 (2005) 245.
- [58] N.E. Mavromatos, Found. Phys. 40 (2010) 917.
- [59] F.R. Klinkhamer and C. Rupp, Phys. Rev. D 70 (2004) 045020.
- [60] H. Murayama and T. Yanagida, Phys. Lett. B 520 (2001) 263.
- [61] G. Barenboim, L. Borissov, J. Lykken, and A.Y. Smirnov, J. High Energy Phys. 10 (2002) 1.
- [62] M. Chaichian, K. Fujikawa, and A. Tureanu, Phys. Lett. B 718 (2013) 1500.
- [63] A. Bamberger et al., Phys. Lett. 33B (1970) 233.
- [64] E. Hu et al., Nucl. Phys. A 254 (1975) 403.
- [65] P. Roberson et al., Phys. Rev. C 16 (1977) 1945.
- [66] B.L. Roberts et al., Phys. Rev. D 17 (1978) 358.
- [67] G. Gabrielse et al., Phys. Rev. Lett. 57 (1986) 2504.
- [68] G. Gabrielse et al., Phys. Rev. Lett. 63 (1989) 1360.
- [69] G. Gabrielse et al., Phys. Rev. Lett. 65 (1990) 1317.
- [70] G. Gabrielse et al., Phys. Rev. Lett. 74 (1995) 3544.
- [71] G. Gabrielse et al., Phys. Rev. Lett. 82 (1999) 3198.
- [72] L.S. Brown, G. Gabrielse, Rev. Mod. Phys. 58 (1986) 233.
- [73] J.K. Thompson, S. Rainville, and D.E. Pritchard, Nature 430 (2004) 58.
- [74] S.N. Ahmed et al., Phys. Rev. Lett. 92 (2004) 102004.
- [75] M. Bregman et al., Phys. Lett. 78B (1978) 174.
- [76] M. Bell et al., Phys. Lett. 86B (1979) 215.
- [77] B. Autin et al., Proceedings of the European Particle Accelerator Conference, 1990.
- [78] S. Geer et al., Phys. Rev. D 62 (2000) 052004.
- [79] E. Borie, Phys. Rev. A 28 (1983) 555.
- [80] G. Bohnert et al., Phys. Lett. B 174 (1986) 15.
- [81] P.J. Mohr, B.N. Taylor, and D.B. Newell, Rev. Mod. Phys. 84 (2012) 1527.
- [82] P.F. Winkler, D. Kleppner, T. Myint, and F.G. Walther, Phys. Rev. A 5 (1972) 83.
- [83] S.G. Karshenboim and V.G. Ivanov, Phys. Lett. B 566 (2003) 27.
- [84] M. Kobayashi and A.I. Sanda, Phys. Rev. Lett. 69 (1992) 3139.
- [85] M.S. Fee et al., Phys. Rev. A 48 (1993) 192.
- [86] A. Aguilar et al., Phys. Rev. D 64 (2001) 112007.
- [87] A.A. Aguilar-Arevalo et al., Phys. Rev. Lett. 105 (2010) 181801.
- [88] P. Adamson et al., Phys. Rev. Lett. 107 (2011) 021801.
- [89] P. Adamson et al., Phys. Rev. Lett. 108 (2012) 191801.
- [90] D. Möhl, Hyperfine Interact. 109 (1997) 33.
- [91] C.T. Munger, S.J. Brodsky, and I. Schmidt, Phys. Rev. D 49 (1994) 3228.
- [92] C. A. Bertulani and G. Baur, Phys. Rev. D 58 (1998) 034005.
- [93] G. Baur et al., Phys. Lett. B 368 (1996) 251.
- [94] G. Blanford et al., Phys. Rev. Lett. 80 (1998) 3037.
- [95] I. N. Meshkov, Phys. At. Nuclei 61 (1998) 1679.
- [96] G. Blanford et al., Phys. Rev. D 57 (1998) 6649.
- [97] M. P. Westig et al., Eur. Phys. J. D 57 (2010) 27.
- [98] G. Gabrielse, L. Haarsma, and S. L. Rolston, Int. J. Mass Spectrom. Ion Processes 88 (1989) 319.
- [99] T. M. O’Neil and D.H.E. Dubin, Phys. Plasmas 5 (1998) 2163.
- [100] C. Amsler et al., in S. G. Karshenboim et al., editors, The Hydrogen Atom. Precision Physics of Simple Atomic Systems (Springer, Berlin, 2001)
- [101] G. Gabrielse, Adv. At. Mol. Opt. Phys. 45 (2001) 1.
- [102] N. Kuroda et al., Phys. Rev. ST Accel. Beams 15 (2012) 024702.
- [103] N. Kuroda et al. Phys. Rev. Lett. 100 (2008) 203402.
- [104] H A. Torii et al., AIP Conf. Proc. 796 (2005) 413.
- [105] A. P. Mills and E. M. Gullikson, Appl. Phys. Lett. 49 (1986) 1121.
- [106] T. J. Murphy and C. M. Surko, Phys. Rev. A 46 (1992) 5696.
- [107] C. M. Surko, R. G. Greaves, and M. Charlton, Hyperfine Interact. 109 (1997) 181.
- [108] C. M. Surko and R. G. Greaves, Phys. Plasmas 11 (2004) 2333.
- [109] E. M. Hollmann, F. Anderegg, and C. F. Driscoll, Phys. Plasmas 7 (2000) 2776.
- [110] M. Amoretti et al., Nucl. Instrum. Meth. Phys. Res. A 518 (2004) 679.
- [111] M. Charlton et al., J. Phys. Conf. Ser. 262 (2011) 012001.
- [112] D. Comeau et al., New J. Phys. 14 (2012) 045006.
- [113] H. Imao et al., Hyperfine Interact. 194 (2009) 71.
- [114] G. Gabrielse, Adv. At. Mol. Opt. Phys. 50 (2005) 155.
- [115] R. Neumann, H. Poth, A. Winnacker, and A. Wolf, Z. Phys. A 313 (1983) 253.
- [116] D. R. Bates, Case Studies in Atomic Physics 4 (1975) 57.
- [117] M. Bell and J. S. Bell, Particle Accelerators 12 (1982) 49.
- [118] L. H. Andersen and J. Bolko, Phys. Rev. A 42 (1990) 1184.
- [119] T. Schüssler et al., Phys. Rev. Lett. 75 (1995) 802.
- [120] F. B. Yousif et al., Phys. Rev. Lett. 67 (1991) 26.
- [121] A. Wolf, in W. G. Graham et al., editors, Recombination of Atomic Ions, volume 296 of NATO ASI Series B (Plenum, New York, 1992) 209.
- [122] A. Müller and A. Wolf, Hyperfine Interact. 109 (1997) 233.
- [123] C. Wesdorp, F. Robicheaux, and L. D. Noordam, Phys. Rev. Lett. 84 (2000) 3799.
- [124] C. Wesdorp, F. Robicheaux, and L. D. Noordam, Phys. Rev. A 64 (2001) 033414.
- [125] J. G. Zeibel and R. R. Jones, Phys. Rev. Lett. 89 (2002) 093204.
- [126] G. Gabrielse, S. L. Rolston, L. Haarsma, and W. Kells, Phys. Lett. A 129 (1988) 38.
- [127] B. Makin and J. C. Keck, Phys. Rev. Lett. 11 (1963) 281.
- [128] M. E. Glinsky and T. M. O’Neil, Phys. Fluids B 3 (1991) 1279.
- [129] L. I. Men’shikov and P. O. Fedichev, JETP 81 (1995) 78.
- [130] P. O. Fedichev, Phys. Lett. A 226 (1997) 289.
- [131] F. Robicheaux, Phys. Rev. A 73 (2006) 033401.
- [132] J. W. Humberston, M. Charlton, F. M. Jacobsen, and B. I. Deutch, J. Phys. B 20 (1987) L25.
- [133] J. P. Merrison et al., Phys. Rev. Lett. 78 (1997) 2728.
- [134] M. Charlton, Phys. Lett. A 143 (1990) 143.
- [135] E. A. Hessels, D. M. Homan, and M. J. Cavagnero, Phys. Rev. A 57 (1998) 1668.
- [136] A. Speck, C.H. Storry, E.A. Hessels, and G. Gabrielse, Phys. Lett. B 597 (2004) 257.
- [137] M. Amoretti et al., Phys. Rev. Lett. 97 (2006) 213401.
- [138] D.S. Hall, G. Gabrielse, Phys. Rev. Lett. 77 (1996) 1962.
- [139] C. A. Ordonez, Phys. Plasmas 4 (1997) 2313.
- [140] G. Gabrielse et al., Phys. Rev. Lett. 89 (2002) 233401.
- [141] G. B. Andresen et al., Phys. Rev. Lett. 106 (2011) 025002.
- [142] G. Gabrielse et al., Phys. Lett. B 507 (2001) 1.
- [143] G.-Z. Li, Commun. Theor. Phys. 12 (1989) 355.
- [144] J. Walz et al., Phys. Rev. Lett. 75 (1995) 3257.
- [145] H. Dehmelt, Physica Scripta T59 (1995) 423.
- [146] E. Widmann et al., CERN/SPSC 2003-009; SPSC-I-226; February 25, 2003
- [147] R. Blümel, C. Kappler, W. Quint, and H. Walther, Phys. Rev. A 40 (1989) 808.
- [148] M. Amoretti et al., Phys. Plasmas 10 (2003) 3056.
- [149] M. Amoretti et al., Phys. Rev. Lett. 91 (2003) 055001.
- [150] P. Oxley et al. Phys. Lett. B 595 (2004) 60.
- [151] M. C. Fujiwara et al., Phys. Rev. Lett. 92 (2004) 065005.
- [152] M. Amoretti et al., Phys. Lett. B 590 (2004) 133.
- [153] M. Amoretti et al., Phys. Lett. B 578 (2004) 23–32
- [154] M. Amoretti et al., Phys. Lett. B 583 (2004) 59–67
- [155] M. C. Fujiwara et al., Phys. Rev. Lett. 101 (2008) 053401.
- [156] F. Robicheaux, J. Phys. B 41 (2008) 192001.
- [157] S. Jonsell, D. P. van der Werf, M. Charlton, and F. Robicheaux, J. Phys. B 42 (2009) 215002.
- [158] G. Gabrielse et al., Phys. Rev. Lett. 93 (2004) 073401.
- [159] T. Pohl, H. R. Sadeghpour, and G. Gabrielse, Phys. Rev. Lett. 97 (2006) 143401.
- [160] N. Zurlo et al., Phys. Rev. Lett. 97 (2006) 153401.
- [161] C.G. Parthey et al., Phys. Rev. Lett. 107 (2011) 203001.
- [162] J. T. M. Walraven and I.F. Silvera, Rev. Sci. Instrum. 53 (1982) 1167.
- [163] T. Bergeman, G. Erez, and H.J. Metcalf, Phys. Rev. A 35 (1987) 1535.
- [164] H.F. Hess, et al., Phys. Rev. Lett. 59 (1987) 672.
- [165] R. van Roijen, J. J. Berkhout, S. Jaakkola, and J. T. M. Walraven, Phys. Rev. Lett. 61 (1988) 931.
- [166] D.G. Fried et al., Phys. Rev. Lett. 81 (1998) 3811.
- [167] A. Mohri and Y. Yamazaki, Europhys. Lett. 63 (2003) 207.
- [168] E. Narevicius et al. Phys. Rev. Lett. 100 (2008) 093003.
- [169] T. M. O’Neil, Phys. Fluids 23 (1980) 2216.
- [170] E. P. Gilson and J. Fajans, Phys. Rev. Lett. 90 (2003) 015001.
- [171] J. Fajans, W. Bertsche, K. Burke, S. F. Chapman, and D. P. van der Werf, Phys. Rev. Lett. 95 (2005) 155001.
- [172] J. Fajans and A. Schmidt, Nucl. Instrum. Meth. Phys. Res. A 521 (2004) 318.
- [173] D.H.E. Dubin, Phys. Plasmas 8 (2001) 4331.
- [174] T.M. Squires, P. Yesley, and G. Gabrielse, Phys. Rev. Lett. 86 (2001) 5266.
- [175] G. Andresen et al., Phys. Rev. Lett. 98 (2007) 023402.
- [176] G. Gabrielse et al., Phys. Rev. Lett. 98 (2007) 113002.
- [177] G. B. Andresen et al., J. Phys. B 41 (2008) 011001.
- [178] G. Gabrielse et al., Phys. Rev. Lett. 100 (2008) 113001.
- [179] A. Mohri, Y. Kanai, Y. Nakai, and Y. Yamazaki, AIP Conf. Proc. 793 (2005) 147.
- [180] T. Pohl, H. R. Sadeghpour, Y. Nagata, and Y. Yamazaki, Phys. Rev. Lett. 97 (2006) 213001.
- [181] C. L. Taylor, J. Zhang, and F. Robicheaux, J. Phys. B 39 (2006) 4945.
- [182] H. Hellwig et al., IEEE Trans. Instrum. Meas. IM-19 (1970) 200.
- [183] L. Essen, M.J. Donaldson, M.J. Bangham, and E.G. Hope, Nature 229 (1971) 110.
- [184] S.J. Brodsky, C.E. Carlson, J.R. Hiller, and D.S. Hwang, Phys. Rev. Lett. 94 (2005) 022001.
- [185] C.E. Carlson, Can. J. Phys. 85 (2007) 429.
- [186] T. Yamazaki et al., Phys. Reports 366 (2002) 183.
- [187] M. Iwasaki et al., Phys. Rev. Lett. 67 (1991) 1246.
- [188] J.S. Briggs, P.T. Greenland, E.A. Solov’ev, Hyperfine Int. 119 (1999) 235.
- [189] J.S. Cohen, Rep. Prog. Phys. 67 (2004) 1769.
- [190] M. Hesse, A.T. Le, C.D. Lin, Phys. Rev. A 69 (2004) 052712.
- [191] S.Yu. Ovchinnikov and J.H. Macek, Phys. Rev. A 71 (2005) 052717.
- [192] X.M. Tong, K. Hino, N. Toshima, Phys. Rev. Lett. 101 (2008) 163201.
- [193] M. Genkin and E. Lindroth, Eur. Phys. J. D 51 (2009) 205.
- [194] K. Sakimoto, Phys. Rev. A 76 (2007) 042513.
- [195] K. Sakimoto, Phys. Rev. A 79 (2009) 042508.
- [196] V.I. Korobov and I. Shimamura, Phys. Rev. A 56 (1997) 4587.
- [197] J. Révai and A.T. Kruppa, Phys. Rev. A 57 (1998) 174.
- [198] O.I. Kartavtsev, D.E. Monakhov, and S.I. Fedotov, Phys. Rev. A 61 (2000) 062507.
- [199] H. Yamaguchi et al., Phys. Rev. A 66 (2002) 022504.
- [200] H. Yamaguchi et al., Phys. Rev. A 70 (2004) 012501.
- [201] M. Hori et al., Phys. Rev. A 57 (1998) 1698; Phys. Rev. A 58 (1998) 1612.
- [202] M. Hori et al., Phys. Rev. A 70 (2004) 012504.
- [203] K. Tökési, B. Juhász, and J. Burgdörfer, J. Phys. B 38 (2005) S401.
- [204] J. Révai and N. Shevchenko, Euro. Phys. J. D 37 (2006) 83.
- [205] M. Hori et al., Phys. Rev. Lett. 89 (2002) 093401.
- [206] I. Shimamura, Phys. Rev. A 46 (1992) 3776.
- [207] T. Yamazaki and K. Ohtsuki, Phys. Rev. A 45 (1992) 7782.
- [208] P.T. Greenland and R. Thürwächter, Hyperfine Interact. 76 (1993) 355.
- [209] V.I. Korobov, Phys. Rev. A 54 (1996) R1749.
- [210] O.I. Kartavtsev, Phys. At. Nucl. 59 (1996) 1483.
- [211] N. Elander and E. Yarevsky, Phys. Rev. A 56 (1997) 1855.
- [212] V.I. Korobov and D.D. Bakalov, Phys. Rev. A 79 (1997) 3379.
- [213] S. Andersson, N. Elander, and E. Yarevsky, J. Phys. B 31 (1998) 625.
- [214] Y. Kino, M. Kamimura, and H. Kudo, Hyperfine Interact. 119 (1999) 201.
- [215] V.I. Korobov, D. Bakalov, and H.J. Monkhorst, Phys. Rev. A 59 (1999) R919.
- [216] Y. Kino et al., Hyperfine Interact. 138 (2001) 179.
- [217] V.I. Korobov, Phys. Rev. A 61 (2000) 064503.
- [218] V.I. Korobov, Phys. Rev. A 67 (2003) 062501.
- [219] Y. Kino, M. Kamimura, and H. Kudo, Nucl. Instrum. Meth. Phys. Res. B 214 (2004) 84.
- [220] S.P. Goldman, Phys. Rev. A 57 (1998) R677.
- [221] G.W.F. Drake, Phys. Scr. T83 (1999) 83.
- [222] V.I. Korobov, private communication.
- [223] P.J. Mohr and B.N. Taylor, Rev. Mod. Phys. 77 (2005) 1.
- [224] S. Hannemann et al., Phys. Rev. A 74 (2006) 062514.
- [225] L. Hilico, N. Billy, B. Grémaud, and D. Delande, J. Phys. B 34 (2001) 1.
- [226] J.C.J. Koelemeij et al., Phys. Rev. Lett. 98 (2007) 173002.
- [227] N. Morita et al., Nucl. Instrum. Meth. Phys. Res. A 330 (1993) 439.
- [228] N. Morita et al., Phys. Rev. Lett. 72 (1994) 1180.
- [229] M. Hori, R.S. Hayano, E. Widmann, and H.A. Torii, Opt. Lett. 28 (2003) 2479.
- [230] M. Hori et al., Phys. Rev. Lett. 94 (2005) 063401.
- [231] M. Hori, Nucl. Instrum. Meth. Phys. Res. A 496 (2003) 102.
- [232] M. Hori and V.I. Korobov, Phys. Rev. A 81 (2010) 062508.
- [233] M. Hori and A. Dax, Opt. Lett. 34 (2009) 1273.
- [234] Th. Udem, R. Holzwarth, T.W. Hänsch, Nature 416 (2002) 233.
- [235] K.S.E. Eikema, W. Ubachs, W. Vassen, and W. Hogervorst, Phys. Rev. A 55 (1997) 1866.
- [236] V. Meyer et al., Phys. Rev. Lett. 84 (2000) 1136.
- [237] P. Fendel, S.D. Bergeson, Th. Udem, T.W. Hänsch, Opt. Lett. 32 (2007) 701.
- [238] M. Hori, Rev. Sci. Instrum. 76 (2005) 113303.
- [239] M. Hori, Nucl. Instrum. Meth. Phys. Res. A 522 (2004) 420.
- [240] M. Haas et al., Phys. Rev. A 73 (2006) 052501.
- [241] D.L. Farnham, R.S. Van Dyck Jr., and P.B. Schwinberg, Phys. Rev. Lett. 75 (1995) 3598.
- [242] T. Beier, et al., Phys. Rev. Lett. 88 (2002) 011603.
- [243] J. Verdú, et al. Phys. Rev. Lett. 92 (2004) 093002.
- [244] R.J. Hughes, B.I. Deutch, Phys. Rev. Lett. 69 (1992) 578.
- [245] E. Widmann et al., Phys. Rev. Lett. 89 (2002) 243402.
- [246] J. Sakaguchi et al., Nucl. Instrum. Meth. Phys. Res. A 533 (2004) 598.
- [247] T. Pask et al., J. Phys. B 41 (2008) 081008.
- [248] D. Bakalov and V.I. Korobov, Phys. Rev. A 57 (1998) 1662.
- [249] N. Yamanaka, Y. Kino, H. Kudo, and M. Kamimura, Phys. Rev. A 63 (2001) 012518.
- [250] Y. Kino, N. Yamanaka, M. Kamimura, and H. Kudo, Hyperfine Interact. 146/147 (2003) 331.
- [251] V.I. Korobov, Phys. Rev. A 73 (2006) 022509.
- [252] V.I. Korobov and Z.X. Zhong, Phys. Rev. A 80 (2009) 042506.
- [253] S. Friedreich et al., Phys. Lett. B 700 (2011) 1.
- [254] B.D. Obreshkov, D.D. Bakalov, B. Lepetit, and K. Szalewicz, Phys. Rev. A 69 (2004) 042701.
- [255] G.Ya. Korenman and S.N. Yudin, J. Phys. Conf. Series 88 (2007) 012060.
- [256] B. Juhasz et al., Eur. Phys. J. D 18 (2002) 261.
- [257] B. Juhasz et al., Chem. Phys. Lett. 379 (2003) 91.
- [258] B. Juhasz et al., Chem. Phys. Lett. 427 (2006) 246.
- [259] J. DiSciacca and G. Gabrielse, Phys. Rev. Lett. 108 (2012) 153001.
- [260] H. Dehmelt, Proc. Natl. Acad. Sci. USA 83 (1986) 2291.
- [261] B. Odom, D. Hanneke, B.D’Urso, and G. Gabrielse, Phys. Rev. Lett. 97 (2006) 030801.
- [262] D. Hanneke, S. Fogwell, and G. Gabrielse, Phys. Rev. Lett. 100 (2008) 120801.
- [263] S. Ulmer et al., Phys. Rev. Lett. 106 (2011) 253001.
- [264] C. C. Rodegheri et al., New. J. Phys. 14 (2012) 063011.
- [265] E. Fermi and E. Teller, Phys. Rev. 72 (1947) 399.
- [266] R. Golser and D. Semrad, Phys. Rev. Lett. 66 (1991) 1831.
- [267] A. Schiefermüller et al., Phys. Rev. A 48 (1993) 4467.
- [268] H.H. Andersen et al., Nucl. Instrum. Meth. Phys. Res. B 194 (2002) 217.
- [269] N.R. Arista and A.F. Lifschitz, Nucl. Instrum. Methods Phys. Res. B 193 (2002) 8.
- [270] A.H. Sørensen, Nucl. Instrum. Methods Phys. Res. B 48 (1990) 10.
- [271] H.H. Mikkelsen and P. Sigmund, Phys. Rev. A 40 (1989) 101.
- [272] P. Sigmund and A. Schinner, Eur. Phys. J. D 15 (2001) 165.
- [273] W.H. Barkas, W. Birnbaum, and F. M. Smith, Phys. Rev. 101 (1956) 778.
- [274] K. Eder et al., Phys. Rev. Lett. 79 (1997) 4112.
- [275] H. Knudsen et al., Nucl. Instrum. Meth. Phys. Res. B 267 (2009) 244.
- [276] T. Kirchner and H. Knudsen, J. Phys. B 44 (2011) 122001.
- [277] H. Higaki et al., Phys Rev. E 65 (2002) 046410.
- [278] K. Yoshiki Franzen et al., Rev. Sci. Instrum. 74 (2003) 3305.
- [279] L.H. Andersen et al., Phys. Rev. A 41 (1990) 6536.
- [280] P. Hvelplund et al., J. Phys. B 27 (1994) 925.
- [281] L. A. Wehrman et al., J. Phys. B 29 (1996) 5831.
- [282] J. F. Reading et al., J. Phys. B 30 (1997) L189.
- [283] G. Bent, P.S. Krstić, and D.R. Schultz, J. Chem. Phys. 108 (1998) 1459.
- [284] T. G. Lee, H.C. Tseng, and C.D. Lin, Phys. Rev. A 61 (2000) 062713.
- [285] A. Igarashi, A. Ohsaki, and S. Nakazaki, Phys. Rev. A 62 (2000) 052722.
- [286] A. Igarashi, S. Nakazaki, and A. Ohsaki, Nucl. Instrum. Meth. Phys. Res. B 214 (2004) 135.
- [287] S. Sahoo, S.C. Mukherjee, and H.R.J. Walters, Nucl. Instrum. Meth. Phys. Res. B 233 (2005) 318.
- [288] D.R. Schultz and P.S. Krstić, Phys. Rev. A 67 (2003) 022712.
- [289] X.-M. Tong et al., Phys. Rev. A 66 (2002) 032709.
- [290] T. Kirchner et al., J. Phys. B 35 (2002) 925.
- [291] M. Keim et al., Phys. Rev. A 67 (2003) 062711.
- [292] M. Foster, J. Colgan, M.S. Pindzola, Phys. Rev. Lett. 100 (2008) 033201.
- [293] A. Lühr and A. Saenz, Phys. Rev. A 77 (2008) 052713.
- [294] J. S. Cohen, Phys. Rev. A 56 (1997) 3583.
- [295] A. Lühr and A. Saenz, Phys. Rev. A 81 (2010) 010701.
- [296] F. Iazzi et al., Phys. Lett. B 475 (2000) 378.
- [297] C.J. Batty, E. Friedman, A. Gal, Nucl. Phys. A 689 (2001) 721.
- [298] W. Brückner et al., Z. Phys. A 335 (1990) 217.
- [299] A. Bertin et al., Phys. Lett. B 369 (1996) 77.
- [300] A. Benedettini et al., Nucl. Phys. B (Proc. Suppl.) 56 (1997) 58.
- [301] A. Zenoni et al., Phys. Lett. B 461 (1999) 405; Phys. Lett. B 461 (1999) 413.
- [302] T.E. Kalogeropoulos and G.S. Tzanakos, Phys. Rev. D 22 (1980) 2585.
- [303] R. Bizzarri et al., Nuovo Cim. A 22 (1974) 225.
- [304] F. Balestra et al., Phys. Lett. B 230 (1989) 36.
- [305] F. Balestra et al., Phys. Lett. B 149 (1984) 69.
- [306] A. Bianconi et al., Phys. Lett. B 492 (2000) 254.
- [307] M. Corradini et al., Nucl. Instrum. Methods Phys. Res A (2013).
- [308] K. Nakamura et al., Phys. Rev. Lett. 52 (1984) 731.
- [309] A. Bianconi et al., Phys. Lett. B 481 (2000) 194.
- [310] F. Balestra et al., Nucl. Phys. A 452 (1986) 573.
- [311] V. Ashford et al., Phys. Rev. C 31 (1985) 663.
- [312] D. Garreta et al., Phys. Lett. B 149 (1984) 64.
- [313] K. Todoroki and M. Hori et al., J. Inst. 7 (2012) C02052.
- [314] H. Aghai-Khozani et al., Eur. Phys. J. Plus 127 (2012) 125.
- [315] H.V. Knudsen et al., Nucl. Instrum. Meth. Phys. Res. B 266 (2008) 530.
- [316] H. Suit et al., Acta Oncol. 42 (2003) 800.
- [317] J.J. Mazeron et al., Radiother. Oncol. 73 (2004) 50.
- [318] L. Gray and T.E. Kalogeropoulous, Radiat. Res. 97 (1984) 246.
- [319] A.H. Sullivan, Phys. Med. Biol. 30 (1985) 1297.
- [320] S. Levegrün et al., Radiother. Oncol. 63 (2002) 11.
- [321] W. Oelert et al., Hyperfine Interact. 213 (2012) 227.
- [322] T. W. Hänsch, S. A. Lee, R. Wallenstein, and C. Wieman, Phys. Rev. Lett. 34 (1975) 307.
- [323] H.A. Bethe and E.E. Salpeter: Quantum Mechnanics of One- and Two-Electron Atoms, paperback edition (Plenum, New York, 1977).
- [324] M. Fischer et al., Phys. Rev. Lett. 92 (2004) 230802.
- [325] F. Biraben and L. Julien, in H. Figger, D. Meschede, and C. Zimmermann, editors, Laser Physics at the Limits (Springer, Berlin, 2002).
- [326] M. Weitz, F. Schmidt-Kaler, and T. W. Hänsch, Phys. Rev. Lett. 68 (1992) 1120.
- [327] Th. Udem et al., Phys. Rev. Lett. 79 (1997) 2646.
- [328] A. Huber et al., Phys. Rev. Lett. 80 (1998) 468.
- [329] C.G. Parthey et al., Phys. Rev. Lett. 104 (2010) 233001.
- [330] K. Pachucki et al., J. Phys. B 29 (1996) 177.
- [331] C.L. Cesar et al., Phys. Rev. Lett. 77 (1996) 255.
- [332] A. L. Midgall et al., Phys. Rev. Lett. 54 (1985) 2596.
- [333] T.J. Greytak and D. Kleppner, in G. Grynberg and R. Stora, editors, Les Houches, Session XXXVIII, 1982 — Tendances actuelles en physique atomique / New trends in atomic physics (Elsevier, 1984).
- [334] H.F. Hess, Phys. Rev. B 34 (1986) 3476.
- [335] W. Ketterle and N. J. Van Druten, Adv. At. Mol. Opt. Phys. 37 (1996) 181.
- [336] T.C. Killian et al., Phys. Rev. Lett. 81 (1998) 3807.
- [337] T. W. Hijmans et al., J. Opt. Soc. Am. B 6 (1989) 2235.
- [338] J. Walz in A. Dupasquier, A. P. Mills, Jr., and R. S. Brusa, editors, Proceedings of the International School of Physics “Enrico Fermi,” Course CLXXIV. Varenna 7–17 July 2009: Physics with Many Positrons (Societá Italiana di Fisica, Bologna, 2010).
- [339] T. W. Hänsch and C. Zimmermann, Hyperfine Interact. 76 (1993) 47.
- [340] C.L. Cesar, Phys. Rev. A 64 (2001) 023418.
- [341] J. T. M. Walraven, Hyperfine Interact. 76 (1993) 205.
- [342] W. D. Phillips et al., Hyperfine Interact. 76 (1993) 265.
- [343] W. Ertmer and H. Wallis, Hyperfine Interact. 44 (1988) 319.
- [344] P. D. Lett, P. L. Gould, and W. D. Phillips, Hyperfine Interact. 44 (1988) 335.
- [345] M. Allegrini and E. Arimondo, Phys. Lett. A 172 (1993) 271.
- [346] V. Zehnlé and J.C. Garreau, Phys. Rev. A 63 (2001) 021402.
- [347] I.D. Setija et al., Phys. Rev. Lett. 70 (1993) 2257.
- [348] C.R. Vidal, in L.F. Mollenauer, J.C. White, and C.R. Pollock, editors, Tunable Lasers, volume 59 of Topics in Applied Physics, 2 edition, chapter 3 (Springer, Berlin, 1992) 57.
- [349] R. Mahon, T. J. McIlrath, and D.W. Koopman, Appl. Phys. Lett. 33 (1978) 305.
- [350] D. Cotter, Opt. Commun. 31 (1979) 397.
- [351] R. Wallenstein, Opt. Commun. 33 (1980) 119.
- [352] L. Cabaret, C. Delsart, and C. Blondel, Opt. Commun. 61 (1987) 116.
- [353] J. P. Marangos et al., J. Opt. Soc. Am. B 7 (1990) 1254.
- [354] O. J. Luiten et al., Appl. Phys. B 59 (1994) 311.
- [355] A. V. Smith and W. J. Alford, J. Opt. Soc. Am. B 4 (1987) 1765.
- [356] K. S. E. Eikema, J. Walz, and T. W. Hänsch, Phys. Rev. Lett. 83 (1999) 3828.
- [357] K. S. E. Eikema, J. Walz, and T. W. Hänsch, Phys. Rev. Lett. 86 (2001) 5679.
- [358] A. Pahl et al., Laser Physics 15 (2005) 46.
- [359] M. Scheid et al., Opt. Lett. 32 (2007) 955.
- [360] F. Markert, M. Scheid, D. Kolbe, and J. Walz, Optics Express 15 (2007) 14476.
- [361] M. Scheid et al., Optics Express 17 (2009) 11276.
- [362] M.D. Ashkezari et al., Hyperfine Interact. 212 (2012) 81.
- [363] W.N. Hardy, A.J. Berlinsky, and L.A. Whitehead, Phys. Rev. Lett. 42 (1979) 1042.
- [364] J. Scherk, Phys. Lett. 88B (1979) 265.
- [365] G. Chardin, Hyperfine Interact. 109 (1997) 83.
- [366] M. M. Nieto and T. Goldman, Phys. Rep. 205 (1991) 221.
- [367] M. M. Nieto and T. Goldman, Phys. Rep. 216 (1992) 343.
- [368] T. W. Darling, F. Rossi, G. I. Opat, and G. F. Moorhead, Rev. Mod. Phys. 64 (1992) 237.
- [369] A. Peters, K.Y. Chung, and S. Chu, Nature 400 (1999) 849.
- [370] N. Poli et al., Phys. Rev. Lett. 106 (2011) 038501.
- [371] A. Kellerbauer et al., Nucl. Instrum. Meth. Phys. Res. B 266 (2008) 351.
- [372] G. Testera et al., AIP Conf. Proc. 1037 (2008) 5.
- [373] R. Ferragut et al., Can. J. Phys. 89 (2011) 17.
- [374] S. Cialdi et al., Nucl. Instrum. Meth. Phys. Res. B 269 (2011) 1527.
- [375] P. Pérez and A. Rosowsky, Nucl. Instrum. Meth. Phys. Res. A 545 (2005) 20.
- [376] J. Walz and T.W. Hänsch, Gen. Rel. Grav. 36 (2004) 561.
- [377] P. Pérez et al., AIP Conf. Proc. 1037 (2008) 35.
- [378] P. Pérez and A. Rosowsky, Nucl. Instrum. Meth. Phys. Res. A 532 (2004) 523.
- [379] P. Pérez et al., Appl. Surface Sci. 255 (2008) 33.
- [380] M. McGovern et al., Phys. Rev. A 79 (2009) 042707.
- [381] J. Ullrich et al., Rep. Prog. Phys. 66 (2003) 1463.