Ultra-strong Mg II Absorbers as a Signature of Cool Intragroup Gas
Abstract
We present the results of a spectroscopic survey of galaxies in the vicinity of an ultra-strong Mg II absorber of rest-frame absorption equivalent width Å at . This absorber was originally found at projected separation kpc of a luminous red galaxy (LRG) at . Magellan IMACs spectroscopy has revealed two galaxies at kpc ( and ) and a third one at kpc () near the redshift of the absorber.These findings indicate that the absorbing gas resides in a group environment. Combining SDSS broadband photometry with additional , -band images and optical spectroscopy, we perform a stellar population synthesis analysis of the group members to characterize their star formation histories, on-going star formation rates (SFR), and stellar masses. We find that the two group members at kpc are best characterized by old stellar populations ( Gyr) and little on-going star formation activity ( /yr), while the third object at kpc exhibit [O II]- and continuum-derived SFR consistent with SFR /yr. Including the two ultra-strong Mg II absorbers analyzed by Nestor et al. (2011), this is the third ultra-strong Mg II absorber for which a detailed study of the galactic environment is available. All three aborbers are found in galaxy groups. We examine different physical mechanisms giving rise to the absorbing gas including starburst driven-outflows, cold filaments, extended rotating disks, and stripped gas. We argue that the large equivalent width observed in these absorbers is more likely due to the gas dynamics of the intragroup medium rather than driven by starburst outflows.
keywords:
galaxies: groups: general – quasars: absorption lines – galaxies: evolution – galaxies: general – galaxies: haloes – galaxies: structure1 Introduction
Dense galactic environments constitute a remarkable laboratory to study the impacts of dynamical interactions and ram pressure stripping on the gaseous content of galaxies and the intragroup medium. In the local universe, we benefit from the sensitivity of 21-cm observations to map cool gaseous structures down to column density of H I (e.g., Thilker et al. 2004). These observations revealed that groups host a diversity of H I structures, including tails and bridges, plumes, disk warps, filaments, and high-velocity cloud complexes (e.g., Sancisi et al. 2008; Chynoweth et al. 2008, 2011; Mihos et al. 2012; Chynoweth et al. 2012; Rasmussen et al. 2012).Among the groups observed locally, the M81/M82 group constitutes a remarkable example underlining the complexity of the processes shaping up the intragroup medium of galaxy groups. In fact, the M81/M82 radio observations presented in Chynoweth et al. (2008) revealed an extended ( kpc) network of gaseous bridges, tails, and isolated clouds with a total estimated neutral hydrogen mass of (Chynoweth et al., 2008; Yun, 1999). Similarly extended H I features have been found for other groups, including M101 (Mihos et al., 2012) and NGC 2563 (Rasmussen et al., 2012). Consequently, these structures constitute an important reservoir of cool baryons which impact the subsequent evolution of the group members.
The H I structures found in groups are thought to arise from a combination of several phenomena, including dynamical interactions between group members (e.g. Wang 1993), ram pressure stripping (e.g. Kawata & Mulchaey 2008; McCarthy et al. 2008), and possibly in-situ cloud formation via thermal instabilities (e.g., Mo & Miralda-Escude 1996; Maller & Bullock 2004) . In addition, hydrodynamical simulations have shown that accretion of cold gas along dark matter filaments (cold mode accretion) is thought to be the dominant mechanism of gas accretion for dark matter halos of masses , while in more massive systems the gas is shock heated to a temperature similar to the virial temperature of the dark matter halo. The gas is accreted via “hot mode” accretion. (e.g., Kereš et al. 2005, 2009; Faucher-Giguère & Kereš 2011; Faucher-Giguère et al. 2011). Although our theoretical understanding of these processes has improved significantly over the last decade or so, we lack empirical data to constrain their relative importance in the evolution of groups and galaxies in general.
While our empirical knowledge of the cool gas content of local groups has been primarily shaped by H I 21-cm observations, we rely extensively on absorption line techniques to trace the extended gas of individual galaxies and groups at . Numerous studies have used the Mg II 2796,2803 absorption doublet to trace cool, K gas with similar to gas column densities detected through 21-cm observations (e.g., Bergeron 1986; Lanzetta & Bowen 1990; Steidel et al. 1994; Churchill et al. 1996, 2005; Tripp & Bowen 2005; Bouché et al. 2007; Chen & Tinker 2008; Kacprzak et al. 2008; Ménard & Chelouche 2009; Barton & Cooke 2009; Chen et al. 2010a; Gauthier et al. 2010; Bordoloi et al. 2011; Chen 2012). Although, their physical nature remains debated, several works have found that Mg II absorbers trace the CGM out to projected distances kpc from normal, “isolated” galaxies at (e.g. Kacprzak et al. 2008; Chen et al. 2010b; Bordoloi et al. 2011).
In addition, the cold gas content of massive galaxies and group-size dark matter halos have been studied by cross-correlating photometrically-selected luminous red galaxies (LRGs) and Mg II absorbers found in SDSS at (Bouché et al., 2006; Lundgren et al., 2009; Gauthier et al., 2009). Spectroscopic follow-up of close, LRG–Mg II pairs by Gauthier et al. (2010) have shown that even though the covering fraction, , of Å Mg II absorbers is much lower around LRGs () than normal galaxy () at similar redshifts, the gaseous envelope extends out to projected distances comparable to the virial radius of these massive halos ( kpc). The presence/absence of Mg II absorbers does not correlate with the recent star formation activity of the LRGs, strongly suggesting that recent starburst driven outflows from LRGs are not responsible for the Mg II gas (Gauthier & Chen, 2011). The much larger gaseous envelope around LRGs compared to normal, isolated galaxies may also suggest an origin for the absorbing gas different from starburst driven outflows . The dark matter halos of LRGs are expected to host approximately five satellite galaxies with luminosities and within 500 kpc of the LRG (Tal et al., 2012a, b). In principle, the Mg II absorber could be found in the circumgalactic medium or stripped gas of a satellite (e.g., Wang 1993), or in correlated, large scale structures seen along the line of sight (e.g. Gauthier et al. 2010). Consequently, a comprehensive analysis of the environment of Mg II absorbers found in the vicinity of LRGs, including a census of candidate satellite galaxies and a detailed account of their star formation histories and on-going star formation rates are necessary to assess the relative importance of these physical processes for the production of the observed Mg II absorbing gas.
This paper presents a detailed study of the environment of an ultra-strong, Å, Mg II absorber found at kpc and of an LRG at . Ultra-strong Mg II (USMg II) absorbers with Å are rare systems harboring Mg II absorbing gas spread over several 100 km/s111The minimum velocity width of a saturated Mg II absorber is Å . Other similarly strong Mg II absorbers have been previously associated with the cold phase of starburst driven-outflows based on the symmetry of the absorption profile with respect to the galaxy systemic redshift (e.g., Bond et al. 2001) or the proximity of the absorbing gas to a starburst galaxy (Nestor et al., 2011).
The USMg II absorber studied here is found in a group environment in which at least three, normal galaxies with relatively low SFR are found to have redshifts consistent with the absorbing gas. Based on the results of a stellar population synthesis analysis conducted on the group members, we show that the USMg II absorber is unlikely to be tracing the cool phase of a recent starburst driven outflow originating from a satellite, but we cannot rule out this possibility. Including the two ultra-strong Mg II analyzed by Nestor et al. (2011), this is the third ultra-strong Mg II absorber for which a detailed study of the galactic environment is available. All three aborbers are found in groups of galaxies. We argue that the large equivalent width observed in these absorbers is more likely to be due to the gas dynamics of the intragroup medium rather than driven by starburst outflows.
This paper is organized as follows. In section 2, we present a series of observations aimed at characterizing the environment of the USMg II absorber. These observations include and -band images of the QSO field, high-resolution spectroscopy of the Mg II absorber, and optical spectroscopic follow-up of the group members found in the vicinity of the QSO sightline. In section 3, we discuss the methodology and results of a stellar population synthesis (SPS) analysis conducted on the group members. The SPS analysis allows us to test the outflow hypothesis by constraining the star formation histories and on-going star formation rates of the group members. In section 4, we discuss the implications of our results and explore different scenarios for the origin of the absorbing gas. We adopt a cosmology with and , and a Hubble parameter throughout the paper. All projected distances are in physical units unless otherwise stated. All magnitudes are in the AB system. Stellar and halo masses are in units of solar masses.
2 Observations and data analysis
The USMg II system presented in this paper was found in the spectrum of QSO SDSSJ220702.64090117.8 and was listed in the Prochter et al. (2006) catalog. The emission redshift of the QSO is and the intervening absorber is located at . As part of their comprehensive study to characterize the cool gas content of massive dark matter halos, Gauthier (2011) identified a luminous red galaxy (LRG) at kpc and velocity separation from the USMg II absorber. This projected separation is less than the virial radius ( kpc) of LRGs at (eg., Blake et al. 2008; Gauthier et al. 2009) while is comparable to the virial velocity of LRGs suggesting that the absorbing gas could be gravitationally bound to the dark matter halo of the LRG.
A first step toward a comprehensive understanding of the physical origin of the absorbing gas consists of characterizing the properties of the galaxy populations found in the vicinity of the QSO sightline. The QSO–LRG field is covered by the SDSS imaging footprint at a depth of 222Corresponds to a detection of a point source in 1” seeing at airmass 1.4 (York et al., 2000).. The LRG has corresponding to . Given the typical seeing conditions of ”, the SDSS images become significantly incomplete for detecting faint () satellite galaxies at near the magnitude limit of SDSS. Deeper images are thus necessary to reveal the putative satellite population located in the vicinity of the QSO sightline.
2.1 and band photometry
We supplemented the already available SDSS photometry with deep and -band images to identify satellite candidates for follow-up spectroscopy. We gathered band images on 2010 September 8 with the CCD camera of the du Pont 2.5-m telescope at Las Campanas Observatory. The CCD camera consists of a single 20482048 detector of pixel size 0.259” with a field-of-view of 8.8’ sqr arcminute. The observations were carried out in a series of 3 exposures of 600 s each and were spatially dithered by an amount varying from 10 to 50 arcsec. The images were gathered under photometric conditions. The FWHM of the point spread function (PSF) in the final combined image is 1.2”. We used the -band photometry and the color of stars the field to compute the band photometric zero point (e.g., Chonis & Gaskell 2008).
Data reduction followed standard procedures. We subtracted the bias of individual frames by using the overscan region of the chip. Next, the bias-subtracted frames were flattened using a combined dome flat. We then registered individual exposure using bright stars found in the field, filtered for cosmic rays, and combined the images. The combined images reach a magnitude limit of 25.6 in a circular aperture of radius 1”. Photometry and source extraction were performed using SExtractor v2.5 (Bertin & Arnouts, 1996). The image was convolved with a 1.3” FWHM gaussian kernel for object detection. We also required a continuous area of 5 pixels and a minimum threshold of 3 above noise level.
In addition, -band images were obtained with the near-IR imaging spectrograph MOSFIRE (McLean et al., 2010) on the Keck I telescope. In imaging mode, the field of view of MOSFIRE is 6.1’6.1’ with a plate scale of 0.18”/pix. The images were obtained on the night of 18 October 2012 by C. Steidel. The observations consist of a series of 10 exposures. Each exposure is a sum of ten 8.7s co-adds yielding a total of 87s per exposure. The total on-target exposure time is 870s. Each co-adds were dithered by 30” to 40”. The data were taken under photometric conditions.
The data were reduced by Allison Strom using the IRAF XDIMSUM package and custom IDL routines. The data were flat-fielded using the background sky signal from a combination of the science exposures. Images were registered using point sources and shifted to a common reference system. The sky background was subtracted using the IRAF task XSLM which is part of the XDIMSUM package. Thirteen unsaturated 2MASS point sources were recovered over the entire frame yielding a zero point of 28.49 mag. The PSF in the final combined image is characterized by FWHM 0.63”. The combined image reaches a magnitude limit of 23.6 over a circular aperture of radius 1”. SExtractor parameters were the same as for the band dataset, except that we convolved the image with a 0.6” FWHM gaussian kernel for source detection. For both and -band observations, the magnitudes quoted in this paper correspond to SExtractor elliptical-aperture measurement MAG_AUTO.
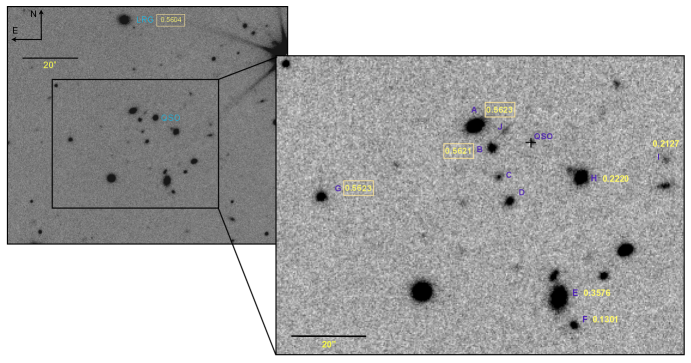
In Figure 1, we show the -band image of the field. The left panel displays the positions of the QSO and the LRG. The inset on the right shows a zoomed-in view of the vicinity of the QSO. We subtracted the QSO PSF in the inset panel. We labeled galaxies with letters (A to J) and, when available, we included the redshift derived from IMACs spectroscopy (see §2.2). We put yellow boxes around the galaxies with redshifts consistent with the absorber (). Galaxies A,B,C,D, and J are detected at kpc from the QSO sightline. We were able to obtain reliable redshift estimates for galaxy A and B. These galaxies are found at velocity separation from the absorber and are members of a group including galaxy G at kpc. Since galaxies A,B, and G are found within the projected virial radius and virial velocity of the LRG, we consider the LRG as a likely member of the group. Nonetheless, it is possible that the LRG and the group formed by galaxies A, B, and G are inhabiting distinct dark matter halos, implying that their relatively small separations arise from mere projection effects. It is also possible that the LRG is accreting a subgroup composed of galaxies A,B, and G as seen in nearby poor groups (e.g., Zabludoff & Mulchaey 1998). When estimating the halo mass of the group (see §3.1), we considered both scenarios in which the LRG is a member or inhabits a different halo. We found that excluding the LRG from the group membership yields similar halo mass and does not affect the conclusions of this paper. Hereafter, we will consider the LRG to be a member of the group unless otherwise stated. In columns (1)-(6) of Table 1, we list the galaxy ID, spectroscopic redshift, SDSS photometric redshift, and -band photometry and estimated luminosities of the confirmed group members as well as galaxies C, D, and J. In column (10) and (11) we included the projected separation from the QSO sightline and the velocity separation from the redshift of the Mg II absorber measured in SDSS () .
2.2 Follow-up spectroscopy with IMACs
Follow-up optical spectroscopy of the galaxies was carried out on the night of 19 August 2012 with the IMACs imaging spectrograph (Dressler et al., 2011) and the f/2 camera. We conducted the observations with a long slit of width 1.2”. Given the serendipitous alignment of the galaxies, we were able to obtain spectra of galaxies A–I with only two long-slit orientations. Galaxies A–F were observed with the first long-slit configuration, while the second long-slit orientation allowed us to simultaneously obtain spectra of galaxies G–I. For all spectroscopic observations, we used the 200 l mm-1 grism which offers a spectral coverage of Å with 2Å per-pixel resolution. The observations were carried in a series of 41800s exposures for the first slit configuration and a single 1200s exposure for the second orientation. Observations of He-Ne-Ar lamps were performed after each series of two science exposures for accurate wavelength calibrations. The typical seeing was ”.
The spectra were processed and reduced using the Carnegie Observatories COSMOS program333Available at http://code.obs.carnegiescience.edu/cosmos. COSMOS is based on a precise optical model of the spectrograph which allows for an accurate prediction of the locations of the slit and spectral features. Initial guesses are further refined after using known spectral lines obtained through He-Ne-Ar lamps observations. The science frames were bias-subtracted and flat-fielded following standard procedures. Sky subtraction on individual 2-D spectrum was performed following the Kelson (2003) procedure. Optimal weights based on the variance of each pixel were used to extract the 1-D spectra. The spectra were then calibrated to vacuum wavelengths, corrected for the heliocentric motion and for Galactic extinction using the Schlegel et al. (1998) maps. Finally, the 1-D spectra and associated error arrays were flux-calibrated using a sensitivity function derived from observations of standard star EG21. Redshifts of the galaxies were determined based on a cross-correlation analysis using known SDSS templates.
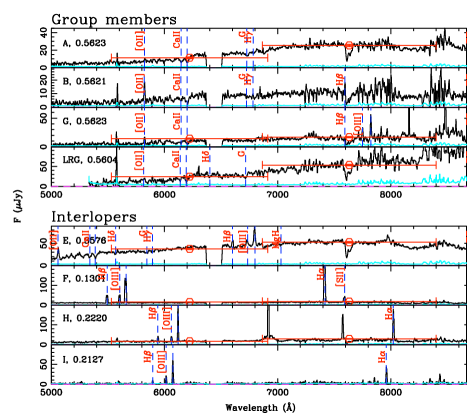
In Figure 2, we display the spectra of all galaxies with enough to yield a reliable redshift estimate. We divided the figure into group members and foreground interlopers. Because our flux calibration is uncertain at Å, we limited our analysis to Å. The LRG spectrum was obtained with the B&C spectrograph on the du Pont telescope as described in Gauthier et al. (2010). Overlaid on top of each spectrum are SDSS and photometric datapoints in red. Galaxy A and the LRG exhibit spectra features dominated by absorption transitions, indicating an old underlying stellar population and little star formation in the recent past. Galaxies B and G show nebular emission lines of [O II] and H, while [O III] is present in galaxy G indicating recent star formation activity. Unfortunately, parts of the H emission line of galaxies B and G fall in the A-band absorption of atmospheric O2. Galaxies B and G also exhibit a shallower SED slope indicating younger stellar populations. In columns (8) and (9) of Table 1, we list [O II] luminosities and a rough estimate of the star formation rate based on the Kennicutt (1998) [OII] calibrator. No slit-loss or intrinsic dust extinction corrections were applied to .
2.3 Echelle spectroscopy of the USMg II absorber
At the resolution of SDSS spectra ( ), it is impossible to resolve the velocity field of individual absorbing clumps which giving rise to the USMg II absorber. Echelle spectroscopy is thus necessary to obtain the velocities of the absorbing clumps relative to the group members and compare, for example, the resulting kinematics with predictions from supergalactic wind models.
We obtained high-resolution spectra of the QSO on the night of 6 September 2010 with the MIKE spectrograph (Bernstein et al., 2003) located on the East Nasmyth platform of the Magellan Clay telescope. MIKE offers wavelength coverage 3200-9500 Å by using a dichroic that redirects the light into a blue ( 3200-4800 Å ) and red ( 4400-9500 Å ) channel. We used MIKE standard configuration, a 22 binning mode, and a 1.0” slit. The blue channel has a dispersion of 0.04 Å in a 22 binning mode. The 1” slit provides a measured resolution of 10.7 in the blue channel where the Mg II absorber resides. The observations consist of s exposures and no dither was applied between exposures. Flat-field sky flats for the blue channel were obtained at twilight. Calibration frames (Th-Ar) for wavelength solutions were taken immediately after each science exposure using the internal calibration lamps. The MIKE observations are characterized by a typical seeing of 0.9” and were obtained under mostly photometric conditions. The data were reduced using the IDL package MIKE Redux444Available at http://web.mit.edu/ burles/www/MIKE/ written by S. Burles et al. The spectra were calibrated to vacuum wavelengths and corrected for heliocentric motion. The final 1-D spectra was binned using 3 wide pixels and has (per pixel) 6 in the spectral region where the Mg II absorber is located. The continuum level was determined by fitting a series of 3rd-order b-splines in the spectral regions of interest.
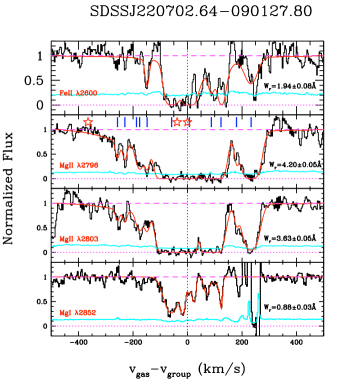
We searched for all absorption transitions within the blue channel of MIKE that are associated with the USMg II absorber. These include Fe II , Mn II , Mg I , and Fe I transitions. Unfortunately, the QSO is faint () for echelle spectroscopy and Fe II transitions blueward of Fe II have too low to yield reliable constraints while the Mn II transitions were simply not detected. We thus limited our analysis to Mg II, Mg I, and Fe II transitions. We performed a Voigt profile analysis that considers all the observed absorption features at once, using the VPFIT555Available at http://www.ast.cam.ac.uk/ rfc/vpfit.html software package. We considered the minimum number of components required to deliver the best in the Voigt profile analysis. Finally, we established the observed line-of-sight velocity by comparing the relative velocities of individual component with the band light-weighted redshift of group members A, B, and G (). In this case, we adopted a conservative approach and excluded the LRG from the redshift estimate of the group. A smoothed version of the absorption profile is show in Figure 3 along with the best-vpfit model shown in red (). In the Mg II panel, we display the positions of individual components with blue tick marks and the positions of galaxies A, B, G and the LRG with red stars. The gas has line-of-sight velocities ranging from to with respect to .
3 Stellar population synthesis analysis
To directly test the previously found association between USMg II absorbers and the cold phase of recent starburst-driven outflows (e.g., Nestor et al. 2011), we performed a stellar population synthesis analysis to constrain the star formation histories, stellar masses, and on-going star formation rates of group members A, B, G, and the LRG.
To accomplish this task, we carried out a likelihood analysis that compares the optical spectrum and broad-band photometry of the galaxies with model expectations for different stellar age (), metallicity (), star formation history (), and intrinsic dust extinction (). The likelihood function follows
| (1) |
where is the number of spectral bins ( for galaxies A,G, for B, and for the LRG), is the observed flux in the th bin, is the model prediction, is the corresponding error of the th element, and is the statistical weight associated with each element. The weights corresponds to the width of each spectral element in wavelength space. In the calculation of the likelihood function, we consider the broadband photometric data points as spectral elements. The weight of each photometric datapoint corresponds to the FWHM of the filter passband. In the range Å, the photometric data points overlap in wavelength space with the optical spectra. Since the same part of the SED is probed by both broad-band photometry and spectroscopy, we divided the weights of each overlapping spectral element by two. We adopted this procedure because in the spectral regions where both spectroscopy and broadband photometry overlap, broadband photometry does not provide additional constraints on the SED. Consequently, we avoid giving more weight to parts of the SEDs that were probed twice.
The stellar population models were based on those described in Bruzual & Charlot (2003) revised to include a prescription of the TP-AGB evolution of low and intermediate mass stars (Marigo & Girardi, 2007). We employed a Chabrier initial mass function for all models (Chabrier, 2003). The star formation history (SFH) of the model galaxies was parametrized by either a single burst (ssp) or by an exponentially declining model with an -folding timescale . The ages were equally separated in logarithmic space between and 8 Gyr, where the upper-limit corresponds to the age of the Universe at . We also adopted an equal spacing of 50 Myr for from 0.1 to 0.5 Gyr and we adopted metallicities of 0.005, 0.02, 0.2, 0.4, 1, and 2.5 solar. To directly compare between data and models, we convolved the model spectra with a top-hat function of width 350 to mimic the resolution of the spectra. We also applied the extinction curve of Charlot & Fall (2000) to simulate dust attenuation by the host galaxies. The extinction model is characterized by , the total effective band optical depth affecting stars younger than 107 yr and , the fraction of contributed by the diffuse ISM. For each model, we generated a grid of extinction curves. Each extinction curve was characterized by a value of and . We adopted , and 2.0 and and 1.0. The range of is consistent with galaxies ranging from dust-free early-types to obscured star-forming systems (da Cunha et al., 2008). In total, 1380 models were generated.
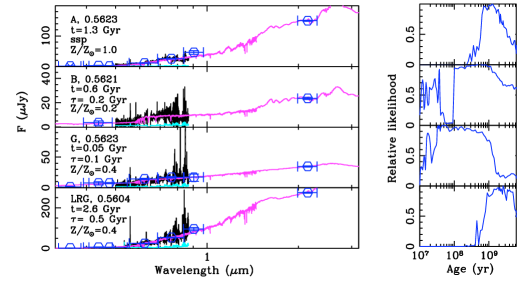
In the left panels of Figure 4 we show the spectra of the LRG and galaxies A,B, and G in black, along with the SDSS and ,band photometric data points in blue. The best-fit stellar population model is shown in magenta. In the upper-left corner, we labelled the name of each galaxy along with its redshift and the best-fit model parameters. The LRG and galaxy A exhibit a very red SED with with very little or no nebular emission lines (see Figure 2), suggesting an old underlying stellar population and little star formation in the recent past. Galaxies B and G have bluer color, indicating younger stellar populations and star formation activity. In the case of A and the LRG, the best-fit models are old ( and 2.6 Gyr respectively) and characterized by solar and sub-solar metallicities (1.0 and 0.4 ) . The best-fit folding times are (ssp) and 0.5 Gyr respectively. In contrast, the best-fit models of galaxies B and G reveal younger stellar populations with and 0.05 Gyr respectively, short (0.3 and 0.2 Gyr) and sub-solar metallicities.
The presence of younger stellar populations in galaxies B and G is further supported by the results of the likelihood analysis presented in the right panel of Figure 4. In this panel, we show the relative likelihood of a given stellar age to reproduce the galaxy SED. To compute the relative likelihood, we identified the model with the largest at a given age and computed its relative likelihood defined as , where is the maximum value of the likelihood function. The right panel of Figure 4 shows that models as young as 10 Myr are able to reproduce the SED of galaxies B and G, although these models also require large dust extinction (). This is not the case for galaxy A and the LRG where models younger than 1 Gyr are rejected. At 300 Myr, the models reproducing B and G typically have Gyr, solar or sub-solar metallicity and large dust extinction ( and ). Older models typically have longer ( Gyr), lower metallicities ( Z⊙) and lower dust extinction (). At Gyr, the LRG and galaxy A are best modeled by single burst and 0.3 Gyr, super-solar metallicities, and large dust extinction (). Alternatively, older models generally have larger and solar metallicity.
3.1 Estimated galaxy properties
Galaxies B and G have younger stellar populations and could, in principle, host starburst-driven outflows, although their [O II]-derived SFR listed in Table 1 indicate low levels of recent star formation activity. To obtain a continuum-derived, SFR estimate for galaxies B and G, we first selected all models with relative likelihood 0.5. While this threshold is arbitrary, the selected models are representative of the variations in star formation history, metallicity, and intrinsic dust extinction that are allowed by the data. For each selected model and galaxy, we computed the stellar mass using rest-frame -band photometric data point and the mass-to-light ratios derived from the model. The continuum-derived SFR (SFRcont) was computed by multiplying the SFR model prediction by the ratio of the galaxy stellar mass over the model stellar mass.
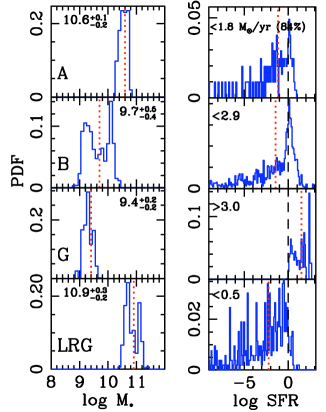
The stellar mass and SFRcont distributions of galaxies A, B, G, and the LRG are shown in Figure 5. The number of models with a relative likelihood 0.5 varies from for galaxy A to for galaxy B. Because of the degeneracy between stellar age and dust attenuation, a much wider range of models are able to reproduce the relatively flat SEDs of galaxies B and G than the steep SED slope of galaxy A. We found that galaxies B and G have which is similar to the stellar masses of galaxies at . In contrast, galaxy A and the LRG are more massive with and respectively. Using the abundance matching technique of Moster et al. (2010) and assuming that galaxy A is the central object, we found666We converted the stellar mass for a Kroupa IMF which is the IMF used in Moster et al. (2010). . that the dark matter halo hosting the group has . If one assumes that the LRG is the central object, the halo mass increases by 0.4 dex to , a value consistent with the dynamical mass estimate of groups at (e.g., Balogh et al. 2011). We included the stellar masses of each galaxy along with their 1- error bars in column (7) of Table 1.
In the right panel of Figure 5, we show the distribution of the SFRcont for all four galaxies. For galaxy G, this distribution is characterized by a tail extending out to SFR /yr. For this reason, we quoted the lower limit of the 84% C.I.. The distribution of confirms the old nature of the stellar populations of galaxies A and the LRG. These galaxies, including galaxy B have /yr. A more interesting case is galaxy G with SFR /yr (84% C.I.). The median value of galaxy G’s distribution is /yr. This is an order of magnitude larger than . Several factors could explain the lower value, including slit loss and dust attenuation. In addition, large values occur in model with implying large dust attenuation corrections . In column (12) of Table 1, we listed the limits to the 84% confidence interval of SFRcont for all four galaxies.
Since we do not have high enough quality spectra and SDSS photometry to constrain the SEDs of galaxies C, D, J, we derived their stellar masses assuming that they are the redshift of the USMg II absorber and that the combined distribution of mass-to-light ratios derived for galaxies A,B,G, and the LRG is an adequate proxy for galaxies C, D, and J. In essence, we hypothesized that these galaxies share similar star formation histories with the confirmed group members. The stellar masses of galaxies C, D, and J are listed in column (7) of Table 1. The results of this analysis show that if located at the redshift of the absorber, galaxies C,D and J are sub- systems with .
4 Discussion
We performed a comprehensive analysis of the environment of a Å Mg II absorber at . Deep optical and near-IR images have revealed five absorber host candidates within 60 kpc of the QSO sightline. Follow-up optical spectroscopy showed that two galaxies at kpc and one at kpc have redshifts consistent with the absorber. The three confirmed group members have rest-frame -band luminosities ranging . These observations convincingly demonstrate that the Mg II absorber originates in a group environment consisting of at least three galaxies. Whether or not the LRG is part of this group remains an open question. We adopted a conservative approach and included the LRG in the analysis, but we found that the conclusions of this paper are not affected by this decision.
We conducted a stellar population synthesis analysis on the group members to constrain their stellar masses, star formation histories, and SFR. In addition to the SFR inferred from SED models, we also derived a SFR estimate based on [O II] emission. Both techniques give consistent results for galaxies A, B, and the LRG. We found that the star formation rates of galaxies A, B, and the LRG are low ( /yr). Furthermore, the SEDs of galaxy A and the LRG are best characterized by old ( Gyr) stellar populations confirming the passive nature of these systems. Of the three group members, only galaxy G exhibits significant star formation rate with a continuum-derived value of SFR 3 /yr. This value is consistent with the [O II]-derived one (SFR /yr). Note that we applied no slit loss or dust extinction corrections when estimating SFR.
4.1 The supergalactic wind scenario
According to Heckman (2002), galaxies with star formation rate per unit area exceeding /yr/kpc2 show ubiquitous starburst-driven outflows. We estimated for the group members by adopting the image isophotal area as a proxy for the sizes of the galaxies. All galaxies are spatially resolved in the -band images. For galaxies A and B located at kpc, we found /yr/kpc2 and /yr/kpc2 respectively. These estimates are based on the upper limits of the SFRcont distribution 84% confidence interval. For the LRG, is even smaller, /yr/kpc2. Therefore, it is unlikely that galaxies A, B, and the LRG are launching galactic superwinds at the time of observation. In contrast, galaxy G has SFR /yr. Adopting the median value of the SFRcont distribution ( /yr) as a typical value allowed by the SED models, we found /yr/kpc2. This value is above the minimum threshold for launching superwinds. In principle, the USMg II absorber could be tracing the cold phase of a starburst-driven outflow originating from galaxy G. Recent semi-analytical models of galactic superwinds have shown that a combination of radiation and ram pressures could drive cold entrained gas out to distances kpc (Murray et al., 2011). The distance traveled by the cold clumps depend on the physical properties of the galaxy as well as the mass load parameter () and the fraction of supernova luminosity that is thermalized (). Under the starburst-driven wind scenario, the equal distribution of Mg II absorbing gas on both sides of the systemic redshift of galaxy G would imply that G is either very inclined or that the opening angle of the wind material is very large (Gauthier & Chen, 2012).
In contrast, Chen et al. (2010b) analyzed a sample of QSO– isolated galaxy pairs at , and convincingly demonstrated an anti-correlation between and . According to their results, USMg II with Å are expected to be found within kpc of a typical galaxy. According to their results, the USMg II absorber is more likely to be associated with galaxies A and B at kpc than galaxy G at kpc. For a definite assessment of the wind scenario we are planning to obtain obtain images of the field, allowing us to use the galaxy inclination and QSO–galaxy relative orientation to estimate the de-projected kinematics of the Mg II clumps and constrain the acceleration mechanisms of the putative wind (Gauthier & Chen, 2012).
4.2 The Nestor et al. (2011) sample of USMg II absorbers
In a recent paper, Nestor et al. (2011) presented deep band observations, follow-up spectroscopy, and stellar population synthesis analysis of the host candidates of two USMg II at . In both fields, the authors found two galaxies within 60 kpc of the QSO sightline and with redshifts similar to the absorber. These results also indicate that a group environment is associated with both absorbers. Assuming that the most massive galaxies are the central objects and following Moster et al. (2010), we computed the halo masses of these two USMg II hosts based on the estimated stellar masses published in Nestor et al. (2011). In Table 2, we list the stellar and derived halo masses these two USMg II along with the system presented in this paper. In columns (6)-(7) we also list the number of confirmed group members their respective separations from the QSO sightline. All three Mg II absorbers are found in halos with . Their estimate of the attenuation-corrected SFR showed that the galaxies display significant star formation activity (SFR /yr). Although Nestor et al. (2011) acknowledged the possibility that the Mg II gas originate from dynamical interactions, they attributed the USMg II systems to the cold phase of a starburst-driven outflow.
These conclusions are further supported by the star formation rate surface density of the galaxies associated with the two USMg II systems. We computed for all galaxies associated with the two USMg II systems presented in Nestor et al. (2011). We adopted the largest dust-corrected values as the SFR of the galaxies while the size of each galaxy was derived from the sizes of the isophotal ellipses presented in Nestor et al. (2007). We did not attempt to de-project the sizes of the galaxy disks. Instead these values allow us to assign upper limits to . Note that Nestor et al. (2007) obtained band images for these two fields while our galaxy size estimates are based on -band images. We found that one galaxy in each field has that could be above the threshold of 0.1 M⊙/yr/kpc2. These two galaxies are G07-1 () and G14-1 (). Nestor et al. (2011) argue that the small probability of finding galaxies with such extreme SFR in the vicinity of a rare USMg II system implies that the two are related. However, we do not find such star-forming systems at kpc of the USMg II absorber discussed in this paper. Yet all three systems are found in group environments.
In addition to the sample of USMg II absorbers presented in Nestor et al. (2011), a detailed study of the environment of a strong, Å Mg II absorber was presented in Kacprzak et al. (2010b). The authors found that the absorber inhabit a group composed of at least five sub- galaxies showing moderate star formation activities of a few M⊙/yr. Furthermore, Whiting et al. (2006) conducted a spectroscopic survey of galaxies found in the field toward QSO PKS2126-158. They discovered a group of at least five passive galaxies at the redshift of a Å Mg II absorber at . These studies show that finding galaxy groups associated with strong Mg II absorbers may not be an uncommon occurrence.
4.3 Different scenarios for the origin of the gas
In principle, the QSO sightline could intercept the CGM of multiple, correlated structures along the line of sight giving rise to the USMg II absorber (e.g., Pettini et al. 1983). According to this hypothesis, the combined effect of multiple gaseous halos would produce absorbing gas spread over several 100 as observed in USMg II absorbers. As mentioned before, the anti-correlation between and implies that Å are typically found at kpc of isolated galaxies (e.g., Chen et al. 2010b; Steidel et al. 1994). For a 0.1 system similar to galaxy J located at kpc777If the galaxy has ., strong Mg II absorbers with Å would be limited to even smaller impact parameters ( kpc). None of galaxies C, D, and J meet this criterion.
Other works have directly compared the kinematics of strong, Å absorbers with the kinematics of galaxies found within kpc of the QSO sightline (e.g., Steidel et al. 2002; Kacprzak et al. 2010a; Bouché et al. 2012). In most cases, the absorbing gas lies entirely on one side of the galaxy systemic redshift and exhibits velocities consistent with the galaxy’s rotation curve, suggesting that a significant fraction of the absorbing gas reside in an extended rotating disk (Steidel et al., 2002; Kacprzak et al., 2010a). This scenario alone cannot explain the gas kinematics we measured for the USMg II absorber. In fact, the gas is found on both sides of the systemic redshift of all confirmed group members. These observations suggest that other physical mechanisms are needed to explain the velocity separation between the gas and galaxies and the overall velocity spread of the gas. Because the quality of our images forbids a reliable characterization of the galaxy morphology, we cannot rule out the possibility that the gas is found in an extended rotating disk associated with galaxy A,B,C, D, or J. However the observed line-of-sight velocity spread ( ) would imply a very massive disk which is highly improbable for galaxies.
Recent hydrodynamical simulations of galaxy formation have shown that cold gas can reach the central regions of dark matter halos via a filamentary accretion channel (e.g., Kereš et al. 2009; Stewart et al. 2011). In these dense filaments, the gas is never shock-heated and can penetrate deep in the hot coronal envelope of the dark matter halo. However, the covering fraction of optically thick gas originating in the cold filaments is found to be low (5% – see Fumagalli et al. 2011) and the efficiency of the cold-mode accretion depends strongly on halo mass and redshift. For halos with , most of the gas accretion occurs in a hot mode where the gas temperature is similar to the virial temperature of the halo. Furthermore, the metallicity of the cold filaments is likely to be low, rendering the detection of metal line transitions challenging (e.g., Kimm et al. 2011). For these reasons, it is rather unlikely that the USMg II absorber is found in the cold streams of gas seen in simulations.
Alternatively, we argue that the Mg II absorber resides in the stripped gas once bound to the gravitational potential of the group members. As discussed in the introduction, such stripped material is seen in nearby, gas rich, group environments. Furthermore, if the USMg II absorber is tracing stripped gas, the kinematics of the absorbing clumps should reflect, the range of velocities allowed by the gravitational potential of the dark matter halo of the group. As show in Figure 3, absorbing clumps have which is comparable to the central velocity dispersion ( ) of a NFW dark matter halo at . The lack of current star formation activity in galaxies A and B may also indicate that cold gas has been stripped from these galaxies . Further HST images of this field would provide crucial morphological informations on the group members and would allow us to directly test the stripped gas hypothesis for the origin of the USMg II absorber population.
Acknowledgments
It is a pleasure to thank H.-W. Chen, M. Rauch, J. Mulchaey, T. Tal, K. Cooksey, A. Diamond-Stanic, G. Becker and C. Steidel for helpful comments and discussions. We also thank the referee for helpful comments that improve the draft significantly. JRG gratefully acknowledges the financial support of a Millikan Fellowship provided by Caltech. This work was supported by the National Science Foundation through grant AST-1108815. This paper is dedicated to the memory of Caltech Professor W.L.W. Sargent.
References
- Balogh et al. (2011) Balogh M. L. et al., 2011, MNRAS, 412, 2303
- Barton & Cooke (2009) Barton E. J., Cooke J., 2009, AJ, 138, 1817
- Bergeron (1986) Bergeron J., 1986, A&A, 155, L8
- Bernstein et al. (2003) Bernstein R., Shectman S. A., Gunnels S. M., Mochnacki S., Athey A. E., 2003, in Society of Photo-Optical Instrumentation Engineers (SPIE) Conference Series, Vol. 4841, Society of Photo-Optical Instrumentation Engineers (SPIE) Conference Series, Iye M., Moorwood A. F. M., eds., pp. 1694–1704
- Bertin & Arnouts (1996) Bertin E., Arnouts S., 1996, A&AS, 117, 393
- Blake et al. (2008) Blake C., Collister A., Lahav O., 2008, MNRAS, 385, 1257
- Bond et al. (2001) Bond N. A., Churchill C. W., Charlton J. C., Vogt S. S., 2001, ApJ, 562, 641
- Bordoloi et al. (2011) Bordoloi R. et al., 2011, ApJ, 743, 10
- Bouché et al. (2012) Bouché N., Hohensee W., Vargas R., Kacprzak G. G., Martin C. L., Cooke J., Churchill C. W., 2012, MNRAS, 426, 801
- Bouché et al. (2007) Bouché N., Lehnert M. D., Aguirre A., Péroux C., Bergeron J., 2007, MNRAS, 378, 525
- Bouché et al. (2006) Bouché N., Murphy M. T., Péroux C., Csabai I., Wild V., 2006, MNRAS, 371, 495
- Bruzual & Charlot (2003) Bruzual G., Charlot S., 2003, MNRAS, 344, 1000
- Chabrier (2003) Chabrier G., 2003, PASP, 115, 763
- Charlot & Fall (2000) Charlot S., Fall S. M., 2000, ApJ, 539, 718
- Chen (2012) Chen H.-W., 2012, arXiv:1209.1094
- Chen et al. (2010a) Chen H.-W., Helsby J. E., Gauthier J.-R., Shectman S. A., Thompson I. B., Tinker J. L., 2010a, ApJ, 714, 1521
- Chen & Tinker (2008) Chen H.-W., Tinker J. L., 2008, ApJ, 687, 745
- Chen et al. (2010b) Chen H.-W., Wild V., Tinker J. L., Gauthier J.-R., Helsby J. E., Shectman S. A., Thompson I. B., 2010b, ApJ, 724, L176
- Chonis & Gaskell (2008) Chonis T. S., Gaskell C. M., 2008, AJ, 135, 264
- Churchill et al. (2005) Churchill C. W., Kacprzak G. G., Steidel C. C., 2005, in IAU Colloq. 199: Probing Galaxies through Quasar Absorption Lines, Williams P., Shu C.-G., Menard B., eds., pp. 24–41
- Churchill et al. (1996) Churchill C. W., Steidel C. C., Vogt S. S., 1996, ApJ, 471, 164
- Chynoweth et al. (2012) Chynoweth K., Holley-Bockelmann K., Langston G., Lockman F., 2012, European Astronomical Society Publications Series, 56, 275
- Chynoweth et al. (2011) Chynoweth K. M., Holley-Bockelmann K., Polisensky E., Langston G. I., 2011, AJ, 142, 137
- Chynoweth et al. (2008) Chynoweth K. M., Langston G. I., Yun M. S., Lockman F. J., Rubin K. H. R., Scoles S. A., 2008, AJ, 135, 1983
- da Cunha et al. (2008) da Cunha E., Charlot S., Elbaz D., 2008, MNRAS, 388, 1595
- Dressler et al. (2011) Dressler A. et al., 2011, PASP, 123, 288
- Faucher-Giguère & Kereš (2011) Faucher-Giguère C.-A., Kereš D., 2011, MNRAS, 412, L118
- Faucher-Giguère et al. (2011) Faucher-Giguère C.-A., Kereš D., Ma C.-P., 2011, MNRAS, 417, 2982
- Fumagalli et al. (2011) Fumagalli M., Prochaska J. X., Kasen D., Dekel A., Ceverino D., Primack J. R., 2011, MNRAS, 418, 1796
- Gauthier (2011) Gauthier J.-R., 2011, PhD thesis, The University of Chicago
- Gauthier & Chen (2011) Gauthier J.-R., Chen H.-W., 2011, MNRAS, 418, 2730
- Gauthier & Chen (2012) Gauthier J.-R., Chen H.-W., 2012, MNRAS, 424, 1952
- Gauthier et al. (2009) Gauthier J.-R., Chen H.-W., Tinker J. L., 2009, ApJ, 702, 50
- Gauthier et al. (2010) Gauthier J.-R., Chen H.-W., Tinker J. L., 2010, ApJ, 716, 1263
- Heckman (2002) Heckman T. M., 2002, in Astronomical Society of the Pacific Conference Series, Vol. 254, Extragalactic Gas at Low Redshift, Mulchaey J. S., Stocke J. T., eds., p. 292
- Kacprzak et al. (2010a) Kacprzak G. G., Churchill C. W., Ceverino D., Steidel C. C., Klypin A., Murphy M. T., 2010a, ApJ, 711, 533
- Kacprzak et al. (2008) Kacprzak G. G., Churchill C. W., Steidel C. C., Murphy M. T., 2008, AJ, 135, 922
- Kacprzak et al. (2010b) Kacprzak G. G., Murphy M. T., Churchill C. W., 2010b, MNRAS, 406, 445
- Kawata & Mulchaey (2008) Kawata D., Mulchaey J. S., 2008, ApJ, 672, L103
- Kelson (2003) Kelson D. D., 2003, PASP, 115, 688
- Kennicutt (1998) Kennicutt R. C., 1998, ARA&A, 36, 189
- Kereš et al. (2009) Kereš D., Katz N., Fardal M., Davé R., Weinberg D. H., 2009, MNRAS, 395, 160
- Kereš et al. (2005) Kereš D., Katz N., Weinberg D. H., Davé R., 2005, MNRAS, 363, 2
- Kimm et al. (2011) Kimm T., Slyz A., Devriendt J., Pichon C., 2011, MNRAS, 413, L51
- Lanzetta & Bowen (1990) Lanzetta K. M., Bowen D., 1990, ApJ, 357, 321
- Lundgren et al. (2009) Lundgren B. F. et al., 2009, ApJ, 698, 819
- Maller & Bullock (2004) Maller A. H., Bullock J. S., 2004, MNRAS, 471
- Marigo & Girardi (2007) Marigo P., Girardi L., 2007, A&A, 469, 239
- McCarthy et al. (2008) McCarthy I. G., Frenk C. S., Font A. S., Lacey C. G., Bower R. G., Mitchell N. L., Balogh M. L., Theuns T., 2008, MNRAS, 383, 593
- McLean et al. (2010) McLean I. S. et al., 2010, in Society of Photo-Optical Instrumentation Engineers (SPIE) Conference Series, Vol. 7735, Society of Photo-Optical Instrumentation Engineers (SPIE) Conference Series
- Ménard & Chelouche (2009) Ménard B., Chelouche D., 2009, MNRAS, 393, 808
- Mihos et al. (2012) Mihos C., Keating K., Holley-Bockelmann K., Pisano D. J., Kassim N., 2012, arXiv:1210.8333
- Mo & Miralda-Escude (1996) Mo H. J., Miralda-Escude J., 1996, ApJ, 469, 589
- Moster et al. (2010) Moster B. P., Somerville R. S., Maulbetsch C., van den Bosch F. C., Macciò A. V., Naab T., Oser L., 2010, ApJ, 710, 903
- Murray et al. (2011) Murray N., Ménard B., Thompson T. A., 2011, ApJ, 735, 66
- Nestor et al. (2011) Nestor D. B., Johnson B. D., Wild V., Ménard B., Turnshek D. A., Rao S., Pettini M., 2011, MNRAS, 412, 1559
- Nestor et al. (2007) Nestor D. B., Turnshek D. A., Rao S. M., Quider A. M., 2007, ApJ, 658, 185
- Pettini et al. (1983) Pettini M., Hunstead R. W., Murdoch H. S., Blades J. C., 1983, ApJ, 273, 436
- Prochter et al. (2006) Prochter G. E., Prochaska J. X., Burles S. M., 2006, ApJ, 639, 766
- Rasmussen et al. (2012) Rasmussen J. et al., 2012, ApJ, 747, 31
- Sancisi et al. (2008) Sancisi R., Fraternali F., Oosterloo T., van der Hulst T., 2008, A&A Rev., 15, 189
- Schlegel et al. (1998) Schlegel D. J., Finkbeiner D. P., Davis M., 1998, ApJ, 500, 525
- Steidel et al. (1994) Steidel C. C., Dickinson M., Persson S. E., 1994, ApJ, 437, L75
- Steidel et al. (2002) Steidel C. C., Kollmeier J. A., Shapley A. E., Churchill C. W., Dickinson M., Pettini M., 2002, ApJ, 570, 526
- Stewart et al. (2011) Stewart K. R., Kaufmann T., Bullock J. S., Barton E. J., Maller A. H., Diemand J., Wadsley J., 2011, ApJ, 735, L1
- Tal et al. (2012a) Tal T., Wake D. A., van Dokkum P. G., 2012a, ApJ, 751, L5
- Tal et al. (2012b) Tal T., Wake D. A., van Dokkum P. G., van den Bosch F. C., Schneider D. P., Brinkmann J., Weaver B. A., 2012b, ApJ, 746, 138
- Thilker et al. (2004) Thilker D. A., Braun R., Walterbos R. A. M., Corbelli E., Lockman F. J., Murphy E., Maddalena R., 2004, ApJ, 601, L39
- Tripp & Bowen (2005) Tripp T. M., Bowen D. V., 2005, in IAU Colloq. 199: Probing Galaxies through Quasar Absorption Lines, Williams P., Shu C.-G., Menard B., eds., pp. 5–23
- Wang (1993) Wang B., 1993, ApJ, 415, 174
- Whiting et al. (2006) Whiting M. T., Webster R. L., Francis P. J., 2006, MNRAS, 368, 341
- York et al. (2000) York D. G. et al., 2000, AJ, 120, 1579
- Yun (1999) Yun M. S., 1999, in IAU Symposium, Vol. 186, Galaxy Interactions at Low and High Redshift, Barnes J. E., Sanders D. B., eds., p. 81
- Zabludoff & Mulchaey (1998) Zabludoff A. I., Mulchaey J. S., 1998, ApJ, 498, L5
| ID | redshift | photo-888SDSS “photozcc2” value. | 999 (AB) from the UKIDSS UDS galaxy sample of Cirasuolo et al. (2010) . | M∗101010Stellar mass obtained from SED models with relative likelihood0.5. For galaxies C,D, and J, we assumed that they are located at the redshift of the absorber and adopted the likely models of galaxies A,B, and G to estimate their stellar masses. | SFR[OII]111111Star formation rate derived from using the Kennicutt (1998) estimator. No slit losses or intrinsic dust attenuation corrections were applied. | SFRcont121212For galaxies A,B, and the LRG, the value corresponds to the upper-limit defining the 84% C.I. of the SFR derived from SED models. For galaxy G, we quoted the lower-limit of the 84% C.I.. | |||||
| ( ergs/s) | (/yr) | (kpc) | (km/s) | (/yr) | |||||||
| (1) | (2) | (3) | (4) | (5) | (6) | (7) | (8) | (9) | (10) | (11) | (12) |
| A | 0.5623 | 23.00.6 | 18.46 0.01 | 1.8 | 55 | -38 | |||||
| B | 0.5621 | 22.70.5 | 20.47 0.04 | 0.3 | 38 | -77 | |||||
| C | 23.40.6 | 21.81 0.10 | 0.09 | 45 | |||||||
| D | 23.80.9 | 20.54 0.05 | 0.3 | 59 | |||||||
| G | 0.5623 | 0.31 0.12 | 21.70.4 | 20.05 0.03 | 0.5 | 209 | -38 | ||||
| J | 25.6 | 22.00 0.14 | 0.07 | 28 | |||||||
| LRG | 0.5604 | 0.53 0.04 | 22.00.4 | 17.80 0.01 | 3.5 | (3) | 246 | -385 |
| Reference | M∗131313Stellar mass of the most massive group member. | Mh141414Halo mass obtained from Moster et al. (2010) assuming that the most massive galaxy is central. | ||||
|---|---|---|---|---|---|---|
| (Å) | (kpc) | |||||
| Nestor et al. (2011) | 0.7646 | 3.63 | 2 | [36,61] | ||
| Nestor et al. (2011) | 0.6690 | 5.6 | 2 | [29,58] | ||
| This work | 0.5624 | 4.20 | 10.6 | 12.3 | 3 | [38,55,209] |