Study of the electronic nematic phase of Sr3Ru2O7 with precise control of the applied magnetic field vector
Abstract
We report a study of the magnetoresistivity of high purity Sr3Ru2O7, in the vicinity of its electronic nematic phase. By employing a triple-axis (9/1/1T) vector magnet, we were able to precisely tune both the magnitude and direction of the in-plane component of the magnetic field (). We report the dependence of the resistively determined anisotropy on in the phase, as well as across the wider temperature-field region. Our measurements reveal a high-temperature anisotropy which mimics the behaviour of fluctuations from the underlying quantum critical point, and suggest the existence of a more complicated phase diagram than previously reported.
Since the pioneering work of Pomeranchuk Pomeranchuk (1958), it has been known that a fluid of interacting electrons might, in principle, develop a spontaneous macroscopic anisotropy. Through the 1990s, solutions of idealised models of electrons on lattices showed that a variety of spin and charge orders can occur that break the symmetries of the underlying lattice and are purely driven by electron-electron interactions. The most celebrated of these, stripes, have been widely discussed in relation to the cuprate high temperature superconductors Kivelson et al. (2003). When the stripes are static there is both a macroscopic anisotropy and an observable translational symmetry breaking, but states in which translational symmetry is preserved may also exist. The analogy between this behaviour and that seen in liquid crystals has led to the adoption of liquid crystal terminology in correlated electron systems: a static stripe phase is equivalent to an electronic smectic, while a metal showing rotational but not translational symmetry breaking is often referred to as an electronic nematic Kivelson et al. (1998).
In recent years, rapid advances have been made. Electronic nematicity has been reported in high purity two dimensional electron gases (2DEGs) Lilly et al. (1999); Pan et al. (1999), Sr3Ru2O7 Borzi et al. (2007), cuprates Ando et al. (2002); Hinkov et al. (2008); Daou et al. (2010); Lawler et al. (2010), pnictides Chuang et al. (2010); Chu et al. (2010); Kasahara et al. (2012) and URu2Si2 Okazaki et al. (2011), stimulating a considerable body of theoretical work Fradkin et al. (2010). In some cases, however, interpretation of the observations is complicated by the coexistence of nematicity with other ordering phenomena. One of the main requirements for further progress is identifying systems in which the onset of anisotropy can be unambiguously determined, and their physical properties established in depth. The material that is the subject of this paper, Sr3Ru2O7, is a particularly attractive host for such experiments. It is a layered perovskite metal in which conduction occurs in stacks of Ru-O bilayers. The two Ru-O planes in each bilayer couple relatively strongly, but bilayer-bilayer coupling is weak, so the electronic structure is nearly two-dimensional Ikeda et al. (2000); Singh and Mazin (2001); Tamai et al. (2008); Mercure et al. (2010). In high magnetic fields of approximately 8 tesla applied normal to the Ru-O planes, a novel phase forms in the purest crystals Grigera et al. (2004); Rost et al. (2009). Tilting the field to a small angle, , produces an in-plane field component which uncovers a large two-fold in-plane transport anisotropy whose easy and hard directions are perpendicular and parallel, respectively, to the direction of the in-plane field Borzi et al. (2007).
While neutron studies were unable to resolve any accompanying anisotropic response of the lattice to the onset of the electronic anisotropy Borzi et al. (2007), it was recently shown by dilatometry measurements to be less than one part in 106 Stingl et al. (2011). This suggests that the coupling of the electronic distortion to the crystal lattice is extremely weak, and means that Sr3Ru2O7 offers, in principle, an ideal opportunity to study the way in which electronic nematics form and behave. In this paper, we report an experimental study of the transport-derived nematic susceptibility which reveals the full richness of the Sr3Ru2O7 phase diagram.
In order to investigate the effect of an in-plane field with high experimental precision, it is necessary to tune its magnitude and orientation with respect to the sample. This cannot be done directly using a standard single-axis rotator. Although interesting experiments can be attempted using octagonal samples with multiple contact configurations Borzi et al. (2011), changing contact configuration during an experiment introduces geometric correction factors that can be difficult to determine with accuracy. A precise investigation of transitions from two- to four-fold transport requires two axis rotation by some means. The standard approach would be to construct a two-axis mechanical rotator, but performing the rotation inevitably introduces heat which disrupts measurements at dilution refrigerator temperatures. The experiments described here result from a different experimental approach, using a bespoke triple-axis vector magnet capable of producing 9/1/1 tesla along , and . We studied carefully characterised single crystals cut either into ‘needle’ shapes (2 x 0.3 x 0.2 mm3 typical dimensions) or octagonal plates (1.8 x 1.8 x 0.1 mm3 typical dimensions). Transport measurements were performed in a dilution refrigerator using four-probe a.c. techniques employing room temperature passive amplification to achieve voltage noise levels of 100pV/. Careful centring using the vector field capability allowed to be determined to an accuracy of 0.1∘ relative to the crystallographic axis Bruin (2012).
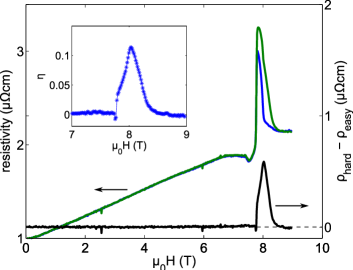
In Fig. 1 we show the magnetoresistivity of a single crystal of Sr3Ru2O7 as a function of the applied field modulus at = 6.4∘ and = 100 mK. At this tilt angle the in-plane field reaches 1 tesla when the axis field is 9 tesla. In both measurements the current was passed along the tetragonal axis 111In the unfolded tetragonal zone the axis is along the Ru-Ru bond direction., but for the blue curve the in-plane field component is perpendicular to the current (the ‘easy’ direction), while for the green curve it is parallel to it (the ‘hard’ direction). Both the current and voltage contacts to the crystal remain identical, so this is a precise measurement of whether the resistivity changes for the two perpendicular in-plane field directions or not. Within our resistivity noise level of 2 ncm/, the resistivity is identical until the sharp jump at 7.78 tesla, as demonstrated by the black curve () in Fig. 1. At higher fields there is a clear resistive anisotropy, which then falls to zero within experimental resolution near the experimentally limited maximum field. A convenient dimensionless measure of the degree of anisotropy is the ratio . We illustrate the onset and subsequent disappearance of anisotropy by plotting as a function of field in the inset of Fig. 1.
The data shown in Fig. 1 emphasise the first key result of this paper: the uniqueness of Sr3Ru2O7 as a model material for the investigation of electronic nematicity. In all the systems in which large anisotropies have been observed, a symmetry-breaking field has been required to reveal them. In the 2DEGs, sample strain has been suggested as the source of this symmetry-breaking field Fradkin et al. (2010), while in the cuprates and pnictides it arises from a pre-existing lattice anisotropy. In the latter case, deconvolving the nematicity due to electronic interactions from coupling to the anisotropic lattice is challenging, though ways of doing so have been proposed Ando et al. (2002); Chuang et al. (2010); Chu et al. (2012). In Sr3Ru2O7, two issues could in principle complicate the interpretation of transport data. Firstly, there is one report of a small lattice anisotropy of approximately 5 parts in 104 even at zero applied magnetic field Kiyanagi et al. (2004). Although small, and not reported in other crystallographic studies Shaked et al. (2000); Hu et al. (2010), it could be a source of two-fold transport anisotropy. Secondly, an in-plane field component could lead to transport anisotropy because of the difference between transverse and longitudinal magneto-resistance 222If a lattice anisotropy of 5 parts in 104 creates no observable transport anisotropy, a change over two orders of magnitude less is not expected to do so either, while any difference between transverse and longitudinal magnetoresistance is a strong inverse function of the scattering rate, which is higher in the anisotropic region than outside it.. The fact that we resolve two-fold transport anisotropy only in a restricted range of fields shows that both effects are negligible in Sr3Ru2O7. Combined with the dilatometry data showing that the lattice anisotropy introduced by entering the region of two-fold transport is less than 1 part in 106, this provides strong evidence that the two-fold transport in Sr3Ru2O7 is induced by electron interactions. Further, the fact that the magnetoresistance makes such well-defined changes from four-fold ( to within high experimental precision) to two-fold () strongly suggests that it is associated with symmetry breaking of the interacting electron system.
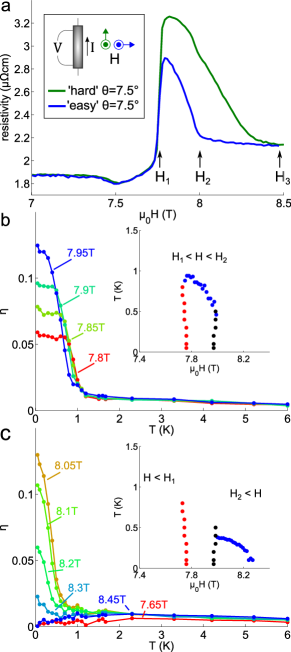
In Fig. 2a we show data in the close vicinity of the region of resistive anisotropy, for = 7.5∘ and = 100 mK. The field labels facilitate comparison with previous thermodynamic and magnetic data, which have established the existence of first order phase transitions at and on the basis of dissipative peaks in the imaginary part of low-frequency a.c. susceptibility Perry et al. (2004) and features in the magnetocaloric effect Rost et al. (2009). The data show that, as the field increases, the initial sharp rise in the anisotropy occurs at . Although there is a feature in at , anisotropy does not disappear there, but persists to the higher field .
The existence of resistive anisotropy between and , beyond the boundaries of the previously-identified phase, is the second key result reported in this paper. Electrical transport in Sr3Ru2O7 is based mainly on bands with Ru 4, 4 and 4 character. A body of theoretical work has shown that electronic anisotropy can arise from instabilities of either the quasi-1D 4-based bands Raghu et al. (2009); Lee and Wu (2009) or from a (bilayer-split) quasi-2D model Puetter et al. (2007); Yamase (2009). The real Fermi surface is quite complicated, however, and the portions which are most strongly renormalised have hybrid 4 and 4 character Tamai et al. (2008). It seems plausible, therefore, that multiple instabilities may exist, as addressed recently in a model predicting a multi-component phase diagram Puetter et al. (2012), and evidence for lattice constant anisotropy above has also been reported Stingl et al. (2012).
The observed transport anisotropy between and shows that the phase diagram of Sr3Ru2O7 is more complex than previously thought, motivating a thorough investigation of the field, temperature and dependence of the anisotropy. We have performed such a study, measuring in the vector magnet for 7T 8.5T, 0.1 K 6K and = 1∘, 2∘, 4∘, 6.4∘ and 7.5∘. In Figs. 2b and 2c we show samples from this data set, namely the temperature dependence of at = 7.5∘, for temperatures between 6 K and 100 mK, for fields between the and , and fields above and below respectively.
The data in Fig. 2b are relevant to an important issue in the study of electronic nematicity: why anisotropy is observed only in the presence of a symmetry-breaking field. The most likely reason is the inherent degeneracy between the order developing along the or axes of a square-planar system. If a phase transition to a nematic state occurs, it would be expected to be accompanied by the formation of domains which would mask the microscopic anisotropy from observation in macroscopic measurements Fradkin et al. (2010). In layered compounds like Sr3Ru2O7 it is also possible that even in mono-domain samples the preferred direction might rotate from layer to layer, again preventing the observation of anisotropy Puetter et al. (2007); Yamase (2009). If a microscopic order parameter exists, the field that is applied to reveal the anisotropy must couple to it, so what is actually measured is the response of the system to the application of that field, which in the case of Sr3Ru2O7 is . The first feature of Fig. 2b that is consistent with this basic picture is the pronounced high temperature ‘tail’ seen in . Small but resolvable anisotropy exists to 6 K, the maximum temperature shown. Below approximately 1 K, rises rapidly from its ‘background’ value. As shown in the inset (blue markers), the temperatures at which this happens agree closely with those of second order phase transitions previously identified for = 0 Rost et al. (2009). The finite high temperature anisotropy along with a pronounced increase at 1K are characteristic of the behaviour expected for an ordered system in the presence of an external field to which it couples, and are reminiscent of previous measurements on the anisotropic state that exists at high field in high purity 2DEGs Lilly et al. (1999).
Data for (Fig. 2c) share some but not all of the features of the data shown in Fig. 2b. The ‘tail’ extending to 6 K is still evident, as is the rise in at low temperatures. The temperatures at which this rise occurs are lower and there is no evidence for the low-temperature saturation of seen at most fields between and , but the data close to show little qualitative difference either side of it. This suggests that there might be a second phase between and , raising the question of why it has not so far been observed in thermodynamic measurements. The issue may be disorder. The previously identified phase between and is strongly dependent on sample purity, and only becomes well-defined in samples with mean free paths of several thousand angstroms. If there were a phase between and with a lower transition temperature, it might be expected to suffer significant disorder broadening even at this high level of sample purity, making a thermodynamic signature difficult to observe. Our transport observations motivate further thermodynamic experiments to clarify this issue.
The third key finding from our study of the field and temperature dependence of is also contained in Fig. 2c. The 7.65T and 8.45T curves (red and blue markers) are representative of the temperature dependence of at fields away from, but in close proximity to, the main regions of anisotropy, both for and . At high temperatures is similar to the values measured for . Instead of rising at low temperatures, however, it drops towards zero. This is characteristic of a quantum critical system tuned away from its critical field. At high temperatures, critical fluctuations affect a wide range of field, but this range is cut off when the temperature is too low to populate them. There is extensive thermodynamic and transport evidence that, away from its critical field, Sr3Ru2O7 behaves like a quantum critical system (with the actual approach to the quantum critical point cut off by the phase formation), but until this experiment there was no evidence that the fluctuations had any nematic character. The nematic response that we report here is small, and would have been difficult to determine with certainty without the use of a vector magnetic field. It is therefore not clear whether the primary fluctuations of the system are nematic or whether the nematicity is a by-product of more dominant fluctuations of some other kind, but it is intriguing to see a nematic signal with such direct characteristics of quantum criticality. It will be interesting to see if it can be enhanced by the application of in-plane stress, to allow the phase diagram to be traced out in detail.
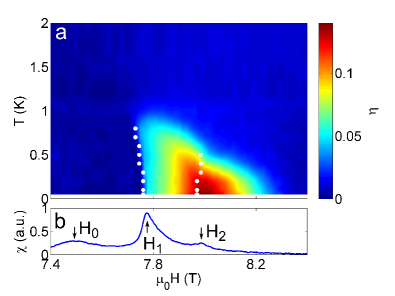
In Fig. 3a we summarise all the data in the vicinity of the regions of strong anisotropy in a colour scale contour plot of for = 7.5∘, based on interpolating data taken at 17 closely spaced temperatures. The data shown in the insets of Fig. 2b and 2c for and are superposed here as white dots. The contouring of in the higher field region is suggestive of that region being associated with a second phase.
Comparison with magnetic susceptibility data for similar (Fig. 3b) reveals a final noteworthy feature of the phase diagram. In addition to the sharp peaks at and , which are known to signal first order phase transitions Grigera et al. (2003, 2004); Rost et al. (2009), there is a broader peak at the lower field . Although it is associated with a larger moment change than that at , there is no evidence from either the imaginary part of the magnetic susceptibility or the magnetocaloric effect that it signals a first order magnetic transition. It might in principle be a crossover or a broadened second order transition (either a critical end-point or a symmetry-breaking transition to finite order of some kind). Whether it is a crossover or a phase transition, it is clearly not associated with the onset of low temperature transport anisotropy. The resistivity falls slightly, but retains four-fold symmetry within our experimental resolution. In contrast, the disappearance of anisotropy at does not coincide with any large feature in the magnetic susceptibility. The overall picture that emerges from these measurements is that the phase diagram of Sr3Ru2O7 may be richer than previously thought. High precision thermodynamic measurements extending to temperatures below 100 mK are highly desirable.
In conclusion, we have used a vector magnetic field to perform a series of high-precision measurements of anisotropic transport in Sr3Ru2O7. Within our high experimental resolution, we observe well-defined transitions from four-fold to two-fold to four-fold symmetry of in-plane resistivity as a function of magnetic field. Transport anisotropy exists in a region of field higher than that bounding a previously identified anisotropic phase. Even when the resistivity is four-fold symmetric at low temperatures, some anisotropy can be induced at higher temperatures, consistent with nematic fluctuations being an integral feature of the broader quantum critical phase diagram that is known to exist for Sr3Ru2O7.
We thank S. A. Kivelson and S. Raghu for stimulating discussions. This work was supported by the EPSRC (UK), RAB and SAG were partially supported by the Royal Society (UK), CONICET and ANPCyT (Argentina), and APM holds a Royal Society - Wolfson Research Merit Award.
References
- Pomeranchuk (1958) I. J. Pomeranchuk, JETP 35, 524 (1958).
- Kivelson et al. (2003) S. A. Kivelson, I. P. Bindloss, E. Fradkin, V. Oganesyan, J. M. Tranquada, A. Kapitulnik, and C. Howald, Rev. Mod. Phys. 75, 1201 (2003).
- Kivelson et al. (1998) S. Kivelson, E. Fradkin, and V. Emery, Nature 393, 550 (1998).
- Lilly et al. (1999) M. P. Lilly, K. B. Cooper, J. P. Eisenstein, L. N. Pfeiffer, and K. W. West, Phys. Rev. Lett. 82, 394 (1999).
- Pan et al. (1999) W. Pan, R. R. Du, H. L. Stormer, D. C. Tsui, L. N. Pfeiffer, K. W. Baldwin, and K. W. West, Phys. Rev. Lett. 83, 820 (1999).
- Borzi et al. (2007) R. A. Borzi, S. A. Grigera, J. Farrell, R. S. Perry, S. J. S. Lister, S. L. Lee, D. A. Tennant, Y. Maeno, and A. P. Mackenzie, Science 315, 214 (2007).
- Ando et al. (2002) Y. Ando, K. Segawa, S. Komiya, and A. N. Lavrov, Phys. Rev. Lett. 88, 137005 (2002).
- Hinkov et al. (2008) V. Hinkov, D. Haug, B. Fauqué, P. Bourges, Y. Sidis, A. Ivanov, C. Bernhard, C. T. Lin, and B. Keimer, Science 319, 597 (2008).
- Daou et al. (2010) R. Daou, J. Chang, D. LeBoeuf, O. Cyr-Choiniere, F. Laliberte, N. Doiron-Leyraud, B. J. Ramshaw, R. Liang, D. A. Bonn, W. N. Hardy, and L. Taillefer, Nature 463, 519 (2010).
- Lawler et al. (2010) M. J. Lawler, K. Fujita, J. Lee, A. R. Schmidt, Y. Kohsaka, C. K. Kim, H. Eisaki, S. Uchida, J. C. Davis, J. P. Sethna, and E.-A. Kim, Nature 466, 347 (2010).
- Chuang et al. (2010) T.-M. Chuang, M. P. Allan, J. Lee, Y. Xie, N. Ni, S. L. Bud’ko, G. S. Boebinger, P. C. Canfield, and J. C. Davis, Science 327, 181 (2010).
- Chu et al. (2010) J.-H. Chu, J. G. Analytis, K. De Greve, P. L. McMahon, Z. Islam, Y. Yamamoto, and I. R. Fisher, Science 329, 824 (2010).
- Kasahara et al. (2012) S. Kasahara, H. J. Shi, K. Hashimoto, S. Tonegawa, Y. Mizukami, T. Shibauchi, K. Sugimoto, T. Fukuda, T. Terashima, A. H. Nevidomskyy, and Y. Matsuda, Nature 486, 382 (2012).
- Okazaki et al. (2011) R. Okazaki, T. Shibauchi, H. J. Shi, Y. Haga, T. D. Matsuda, E. Yamamoto, Y. Onuki, H. Ikeda, and Y. Matsuda, Science 331, 439 (2011).
- Fradkin et al. (2010) E. Fradkin, S. A. Kivelson, M. J. Lawler, J. P. Eisenstein, and A. P. Mackenzie, Annual Review of Condensed Matter Physics, Vol. 1 (Annual Reviews, 2010) pp. 153–178 and references contained therein.
- Ikeda et al. (2000) S.-I. Ikeda, Y. Maeno, S. Nakatsuji, M. Kosaka, and Y. Uwatoko, Phys. Rev. B 62, R6089 (2000).
- Singh and Mazin (2001) D. J. Singh and I. I. Mazin, Phys. Rev. B 63, 165101 (2001).
- Tamai et al. (2008) A. Tamai, M. P. Allan, J. F. Mercure, W. Meevasana, R. Dunkel, D. H. Lu, R. S. Perry, A. P. Mackenzie, D. J. Singh, Z.-X. Shen, and F. Baumberger, Phys. Rev. Lett. 101, 026407 (2008).
- Mercure et al. (2010) J.-F. Mercure, A. W. Rost, E. C. T. O’Farrell, S. K. Goh, R. S. Perry, M. L. Sutherland, S. A. Grigera, R. A. Borzi, P. Gegenwart, A. S. Gibbs, and A. P. Mackenzie, Phys. Rev. B 81, 235103 (2010).
- Grigera et al. (2004) S. A. Grigera, P. Gegenwart, R. A. Borzi, F. Weickert, A. J. Schofield, R. S. Perry, T. Tayama, T. Sakakibara, Y. Maeno, A. G. Green, and A. P. Mackenzie, Science 306, 1154 (2004).
- Rost et al. (2009) A. W. Rost, R. S. Perry, J.-F. Mercure, A. P. Mackenzie, and S. A. Grigera, Science 325, 1360 (2009).
- Stingl et al. (2011) C. Stingl, R. S. Perry, Y. Maeno, and P. Gegenwart, Phys. Rev. Lett. 107, 026404 (2011).
- Borzi et al. (2011) R. A. Borzi, A. McCollam, J. A. N. Bruin, R. S. Perry, A. P. Mackenzie, and S. A. Grigera, Phys. Rev. B 84, 205112 (2011).
- Bruin (2012) J. A. N. Bruin, PhD thesis, University of St Andrews (2012).
- Note (1) In the unfolded tetragonal zone the axis is along the Ru-Ru bond direction.
- Chu et al. (2012) J.-H. Chu, H.-H. Kuo, J. G. Analytis, and I. R. Fisher, Science 337, 710 (2012).
- Kiyanagi et al. (2004) R. Kiyanagi, K. Tsuda, N. Aso, H. Kimura, Y. Noda, Y. Yoshida, S.-I. Ikeda, and Y. Uwatoko, Journal of the Physical Society of Japan 73, 639 (2004).
- Shaked et al. (2000) H. Shaked, J. Jorgensen, O. Chmaissem, S. Ikeda, and Y. Maeno, Journal of Solid State Chemistry 154, 361 (2000).
- Hu et al. (2010) B. Hu, G. T. McCandless, M. Menard, V. B. Nascimento, J. Y. Chan, E. W. Plummer, and R. Jin, Phys. Rev. B 81, 184104 (2010).
- Note (2) If a lattice anisotropy of 5 parts in 104 creates no observable transport anisotropy, a change over two orders of magnitude less is not expected to do so either, while any difference between transverse and longitudinal magnetoresistance is a strong inverse function of the scattering rate, which is higher in the anisotropic region than outside it.
- Raghu et al. (2009) S. Raghu, A. Paramekanti, E-.A. Kim, R. A. Borzi, S. A. Grigera, A. P. Mackenzie, and S. A. Kivelson, Phys. Rev. B 79, 214402 (2009).
- Perry et al. (2004) R. S. Perry, K. Kitagawa, S. A. Grigera, R. A. Borzi, A. P. Mackenzie, K. Ishida, and Y. Maeno, Phys. Rev. Lett. 92, 166602 (2004).
- Lee and Wu (2009) W.-C. Lee and C. Wu, Phys. Rev. B 80, 104438 (2009).
- Puetter et al. (2007) C. Puetter, H. Doh, and H.-Y. Kee, Phys. Rev. B 76, 235112 (2007).
- Yamase (2009) H. Yamase, Phys. Rev. B 80, 115102 (2009).
- Puetter et al. (2012) C. M. Puetter, S. D. Swiecicki, and H.-Y. Kee, New Journal of Physics 14, 053027 (2012).
- Stingl et al. (2012) C. Stingl, R. S. Perry, Y. Maeno, and P. Gegenwart, ArXiv:1212.0948 (2012).
- Grigera et al. (2003) S. A. Grigera, R. A. Borzi, A. P. Mackenzie, S. R. Julian, R. S. Perry, and Y. Maeno, Phys. Rev. B 67, 214427 (2003).