Social and place-focused communities in location-based online social networks
Abstract
Thanks to widely available, cheap Internet access and the ubiquity of smartphones, millions of people around the world now use online location-based social networking services. Understanding the structural properties of these systems and their dependence upon users’ habits and mobility has many potential applications, including resource recommendation and link prediction. Here, we construct and characterise social and place-focused graphs by using longitudinal information about declared social relationships and about users’ visits to physical places collected from a popular online location-based social service. We show that although the social and place-focused graphs are constructed from the same data set, they have quite different structural properties. We find that the social and location-focused graphs have different global and meso-scale structure, and in particular that social and place-focused communities have negligible overlap. Consequently, group inference based on community detection performed on the social graph alone fails to isolate place-focused groups, even though these do exist in the network. By studying the evolution of tie structure within communities, we show that the time period over which location data are aggregated has a substantial impact on the stability of place-focused communities, and that information about place-based groups may be more useful for user-centric applications than that obtained from the analysis of social communities alone.
Networks can describe a large variety of complex systems, and network science has proved to be a successful framework for the quantitative study of their structure and dynamics Barabasi2002rev ; Newman2003rev ; Boccaletti2006 . In the last decade, the tools and models provided by complex network theory have enabled discovery of similarities between seemingly very different systems including the Internet, the human proteome, and collaboration networks. Complex networks analysis is now regularly employed to characterise the topology and functioning of biological, technological and social structures Barrat2008 ; Newman2010 .
The analysis of social networks is one of the traditional application fields of network science, and sociologists generally agree that many social behaviours, from opinion formation to rule enforcement, from individual success to cooperation, depend in a fundamental way on the structure and evolution of the patterns of social relationships. In other words, characterising and quantifying social structures is often a prerequisite for understanding and interpreting social dynamics granovetter_1973 ; coleman_1988 ; Castellano2009 . In the last twenty years, sociologists have relied on the study of small social networks with tens or hundreds of nodes at most, collected by means of targeted questionnaires and direct interviews. Recently, the ubiquity of the Internet and the World Wide Web, and the emergence of hundreds of online social services, have produced a huge volume of data about online relationships between millions of people around the world. These online social networks (OSNs) have allowed quantitative verification of sociological theories on an unprecedented scale. Analysis of a wide variety of online social systems has allowed insights into the dynamics of human behaviours, including bond formation, cooperation, imitation, and synchronisation Szell2010 ; Onnela2010 ; Lewis2012 . However, the extent of the correspondence between people’s online activities and their offline lives is still the subject of debate Borge-Holthoefer2011 ; Crandall10:Inferring ; Jones2013 .
One problem of interest in social network analysis is that of identifying communities, cohesive groups of people who are more tightly interconnected to each other than to the rest of the network. Communities can be exploited in a wide range of practical applications, including obtaining coarse-grained visual representations of large networks, sorting personal online contacts into manageable groups, finding partitions to speed up the performance of services or providing personalised recommendations Liu12:Simplifying ; Papadopoulos11:Community ; Pujol10:Little . Many methods have been proposed in the last decade to find the best partition of a graph into a set of meaningful communities Girvan2002 ; Newman2004a ; Newman2006 ; Fortunato2009 , and the community structure of OSNs has recently been the subject of much research Backstrom06:Group ; Kumar10:Structure ; Mislove07:Measurement . At the same time, OSNs are becoming increasingly location-aware, meaning that user-produced content has an associated place. Examples include Facebook’s recent introduction of the ability to tag any post with a location Facebook12:Building , geo-tagged tweets in Twitter Twitter09:Think , and explicitly location-based social networks. The most popular of these, Foursquare, has almost 35 million users Foursquare13:What . Recent research has shown that online social ties are more likely to form between spatially close users than between those further apart Crandall10:Inferring ; Backstrom10:Find ; Cranshaw10:Bridging ; Liben-Nowell05:Geographic ; Scellato11:Socio-spatial , but the exact role played by space in the formation and evolution of communities is still unclear.
In this work we study Gowalla, an online location-based social network, and analyse friendship and co-location networks obtained from longitudinal data corresponding to more than 3 months of activity by around 150,000 users. We focus on the structural properties and evolution of social and local communities, defined as tightly-connected groups of nodes in the social and in the co-location graphs respectively, and find that in general the overlap between social and local communities is small, if not negligible. A local community is rarely a proper subset of a social community, and usually contains members belonging to different social groups. Furthermore, the probability of two unconnected nodes becoming connected is much higher if they belong to the same local community, and users in the same local community who have not been in the same place are more likely later to visit a common place than users in the same social community. Finally, while the structure of the social communities is relatively stable over time, local communities are more dynamic and volatile. The differences between social and local communities highlighted in this work provide a first piece of evidence that the standard approach to social group inference, based on the detection of communities in the social graph, can fail to capture the microscopic dynamics of local groups. Our results suggest that information derived from social community analysis should be appropriately complemented with knowledge about individual activity before being used in user-centric applications such as providing friend suggestions or place recommendations.
I The data set
We analyse data from Gowalla, an online location-based social network founded in 2009 and discontinued at the end of 2011, when the company was bought by Facebook. The service allowed users to declare friendship ties to other users, thus forming a social network. The main user activity in Gowalla was the check-in: users indicating their presence at specific, named venues using a mobile phone application. When users checked in to places in this way, geo-located and time-stamped records were stored in the system, and their friends in the social network were notified of their location.
I.1 Data collection
Our data set consists of a series of daily crawls of Gowalla downloaded between May and August 2010, obtained using the public API provided by Gowalla to allow other applications and services to access their content. Each user is identified by an anonymised numeric ID and has an associated profile including social connections and check-ins. We downloaded these profiles from the service daily over the crawling period, meaning that for each day we have complete information about the social graph (all the friendship ties between users at that time), and about all the user check-ins. Each check-in consists of the venue name, category, location (latitude and longitude), the ID of the user who made the check-in, and a timestamp. We also have a record of all the check-ins that had taken place before the measurement period began, but we do not have the state of the social network corresponding to this period.
In Gowalla each place is represented as a named venue, such as ‘Starbucks’, ‘Kings Cross Railway Station’ or ‘Computer Laboratory’, with latitude and longitude values so that the correct ‘Starbucks’ for the user’s location can be identified. The user therefore checks in to a specific place, rather than being located using coordinates alone. We can therefore identify when users actually visit the same places rather than just being in geographic proximity, e.g., in two shops next door to one another. Having crawled Gowalla daily, we are able to examine closely which social ties were formed and deleted during the data collection period, and gain insight into the dynamics of the network structure at the level of individual links. The crawl was performed when the network was already fairly large and steadily growing, not during the explosive growth period typically observed shortly after the creation of such online social services, when their popularity increases exponentially Kumar10:Structure .
I.2 Data processing
Since we have two kinds of information about users, i.e. the places where they have checked in, and their connections in the social network, given a time interval we can construct two different graphs. The first graph represents the social network: each user present in the system during the considered time interval is represented by one of the nodes of the set , and is a set of edges (or ties) between nodes. The edge exists in between users if and are friends in the OSN in that time interval. We represent a graph by the adjacency matrix , in which the entry if there exists a link connecting node and node , and otherwise. The number of neighbours of a node is called the degree of , and is denoted by . In the following we refer to the average degree of a graph . In Gowalla, ties are bidirectional and indistinguishable, so the social graphs we construct are undirected and unweighted, and the associated adjacency matrices are symmetric.
Using the information about places where users check in, we can define the notion of placefriends: users (not necessarily having a social tie) who have checked in to one or more of the same places. Since our aim is to investigate the relationship between online and offline social groups, we are particularly interested in users who have checked in to one or more of the same places as their online friends, that is, users who are both friends and placefriends. Given a time interval and the corresponding social graph , we define the associated placefriends-social graph as the subgraph of such that contains all the nodes in having at least one friend who is also a placefriend, and is the subset of edges such that and are both friends and placefriends. We call and , respectively, the number of nodes and the number of edges in the placefriends graph. For convenience, we henceforth refer to the placefriends-social graph simply as the placefriends graph, and to the edges of the placefriends graph as placefriends edges (or ties).
II Structure of social and placefriends graphs
We analyse the structure of the social and placefriends graphs in Gowalla, focusing on the temporal evolution of communities. In order to study the temporal evolution of these graphs, we divided the original data set into 8 snapshots, each covering a period of 2 weeks except the last one, which is 9 days long. Table 1 reports the number of new check-ins and new unique places per day at each snapshot, and the total number of check-ins and unique places in the data set at the end of each snapshot. The total number of check-ins in the first snapshot refers to all check-ins recorded in the system since the inception of Gowalla. At the time of crawling the system was steadily growing, with around 5,000 new places visited every day.
| Snapshot | NCh | NP | TCh | TP |
|---|---|---|---|---|
| 1 | - | - | 4,946,778 | 1,023,991 |
| 2 | 49,562 | 4,812 | 5,640,646 | 1,091,366 |
| 3 | 59,055 | 4,997 | 6,467,416 | 1,161,324 |
| 4 | 59,846 | 4,785 | 7,305,267 | 1,228,323 |
| 5 | 52,085 | 4,876 | 8,034,466 | 1,296,594 |
| 6 | 53,878 | 5,061 | 8,788,764 | 1,367,448 |
| 7 | 57,941 | 4,921 | 9,599,945 | 1,436,352 |
| 8 | 32,106 | 2,960 | 9,888,905 | 1,462,993 |
II.1 Basic network properties
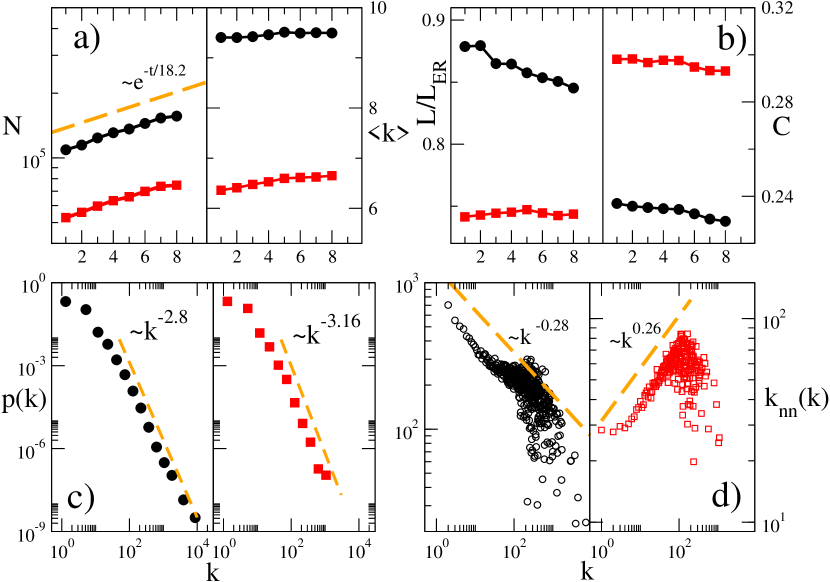
Fig. 1 reports the basic structural properties of the social and placefriends graphs corresponding to each of the eight snapshots. The number of nodes in the largest connected components of both the social (black circles) and the placefriends graphs (red squares) increases exponentially over time (Fig. 1a), confirming that at the time of data acquisition the system was still growing. In particular, the number of users in the largest connected component of the social graph increased from around 100,000 to around 150,000, while the size of the largest connected component in the placefriends graph grew from around 52,000 to around 75,000. The average node degree in the social graph (right panel of Fig. 1a) remains almost constant over the 8 snapshots, indicating that the social network was already well-established and stable at the time of the crawl. Conversely, the average degree of the placefriends graph increases from around 6.2 in the first snapshot to around 6.8 in the last, showing that the placefriends graph becomes denser with time.
Both the social and the placefriends graphs are small-world networks, as confirmed by Fig. 1b, which reports the values of the relative characteristic path length (the average distance between any pair of nodes divided by the expected value of this quantity in an Erdös-Renyi graph with the same number of nodes and links) and the mean node clustering coefficient (the mean percentage of closed triads incident to a node). The relative characteristic path length in the placefriends graph is smaller than that of the social graph, and the average clustering coefficient of the placefriends graphs is consistently higher than that of the social graph, indicating that on average a node in the placefriends graph is surrounded by neighbours who in turn have a high probability of having been to a common place. This effect can be explained by observing that users of online social networking services may add as friends people they meet only occasionally, if ever, since creating and maintaining this kind of online friendship does not involve any real cost or effort. Conversely, in order to be considered placefriends, two users have to have been to the same place, meaning that their activities are focused around a certain geographical area. This makes it more probable that pairs of their friends with whom they share a common place could themselves have visited a common place in the same area.
II.2 Degree distributions and degree correlations
In Fig. 1c we show the degree distribution, i.e. the probability of finding a node having degree equal to , of the social and placefriends graphs corresponding to the whole data set. The two degree distributions exhibit power-law tails, i.e. for large , indicating that the form of the distribution is scale-invariant and that there is a non-negligible probability of nodes having a large number of neighbours. However, the tails of the two distributions are characterised by two different values of 111The exponents of the tails of the degree distributions have been computed using the maximum likelihood estimator (MLE) for discrete power-law distributions, as indicated in Ref. Clauset2007a . The values of corresponding to the maximum likelihood fit are and , respectively for social and placefriend graphs.. Since the exponent of a power-law degree distribution is an indirect measure of the heterogeneity of the degrees, with larger exponents corresponding to more homogeneous distributions, we can conclude that the node degrees of the placefriends graph usually are more homogeneously distributed. The maximum degree of the placefriends graph is much smaller than that of the social graph ( in the placefriends graph while in the social graph). These observations are consistent with the fact that place-friendship is much more costly and demanding than purely online friendship.
For complex networks, the degree distribution alone is often not enough to fully characterise the microscopic structure. Many networks exhibit degree-degree correlation, meaning that the existence of a link between two nodes having respective degrees and is a function of both and Newman2002 ; Newman2003 . Networks can be either assortative (nodes of a certain degree are preferentially linked to nodes with similar degrees) or disassortative (highly connected nodes are preferentially linked with other nodes having small degree, and vice versa). The assortativity of a network can be quantified by looking at the average degree of the first neighbours of nodes having degree , as a function of . For assortative networks, is an increasing function of , while for disassortative networks decreases with . Quite often, is a power–law, i.e. ; in these cases, the exponent can be used to quantify the assortativity of the network, with more positive values of indicating more assortative networks and more negative values of corresponding to disassortative graphs.
Fig. 1d reports the value of for the social and the placefriends graphs. Notice that while the social graph is markedly disassortative (), the placefriends graph is assortative (). This means that hubs in the social graph preferentially link to poorly-connected nodes, while nodes in the placefriends graph tend to be connected with other nodes having similar degree. We hypothesize that the disassortativity of the social graph may be due to the nature of Gowalla as an online social service: its most active users, who would probably add the most friends, tended to be ‘early adopters’ and people who were particularly interested in new online services and technology. These people would have a lot of connections and might convince their friends to sign up to the service, but these friends could be less interested and maybe only add one or two friends before stopping using Gowalla. Such patterns of behaviour could give rise to the kind of disassortativity we see in the social graph.
The results reported in Fig. 1 confirm that the structure of the social graph constructed from friendship declared by Gowalla users is fundamentally different from the structure of the corresponding placefriends graphs obtained from check-in information. This means that social ties alone are probably not a good proxy of users’ activity, and that information about friendships needs to be appropriately complemented with other knowledge before being used to draw conclusions about users’ dynamics.
III Social and local communities
We have seen that despite being constructed from the same data set, the social and placefriends graphs are quite different with respect to heterogeneity and assortativity. We now focus on the community structures of the two graphs, in order to understand whether these discrepancies also reflect a different meso-scale organisation. In general, a community is a subset of nodes of a graph that are tightly connected to each other. Depending on the precise definition of community employed Fortunato2009 , one can require that in order to form a proper community a subset of nodes should either be more tightly connected than expected in a null model Newman2006 or should instead have more internal links, i.e. edges between nodes belonging to the community, than external ones, i.e. those connecting a node inside the community with a node outside the community Girvan2002 . We use the former definition, and we consider partitions obtained using the Louvain method Blondel08:Fast , a greedy agglomerative community detection algorithm based on modularity optimisation Newman2006 ; Arenas2007 .
It has been observed that some OSNs contain groups of users who are online friends and also happen to visit the same places in the physical world Brown12:Importance ; in practice, these are groups of placefriends who also form a community in the social graph. Since we are interested in understanding the relationship between online and place-focused communities, and in particular in quantifying the extent to which the structure of the social graph mirrors the activity of users visiting the same places, we will compare the results of community detection performed on the Gowalla social graphs and on the corresponding placefriends graphs. In the following we call the communities of the social graph social-only communities, or simply social communities, and refer to the communities of the placefriends graphs as local communities.
When tracking the evolution of communities over time, we need to be confident that changes in the communities in two different temporal snapshots are due to the changing structure of the network, not to peculiarities of the community detection algorithm. Many greedy community detection methods, including the Louvain method, are non-deterministic and can give different output depending on the order of the input Fortunato2009 . To address this problem, we adopted the algorithm proposed by Kwak et al. Kwak09:Mining , which works as follows. A chosen community detection algorithm able to handle weighted graphs (e.g., the Louvain method) is run times on the same network, with the input being given in a different, randomised order each time, thus obtaining community partitions of the graph. In principle, if the graph has a strong community structure then these partitions should differ only for the community placement of a relatively small subset of nodes. Then, the network is re-weighted according to the frequency with which pairs of nodes have been placed in the communities of each of the partitions. Specifically, the weight of an edge connecting nodes and is increased or decreased proportionally to the number of times that and have been put in the same community in each of the runs. The re-weighting procedure has the effect of reinforcing more robust groupings over those appearing by chance or due to a particular input ordering. The process is iterated on the re-weighted network, until a consistent placement of nodes into communities is obtained and all the partitions obtained in the runs of an iteration are identical. Although Kwak et al. noted in their paper that the convergence of their method cannot be guaranteed for certain graphs, we did not encounter this problem for our networks, and we were able to find a stable partition of each graph.
III.1 Size distribution
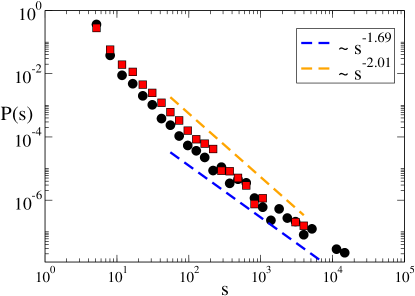
It is common for social networks to exhibit communities at different scales, and quite often the distribution of community sizes is a power-law. Figure 2 shows the size distributions of communities in the final snapshot of the social and the placefriends graphs in Gowalla; the distributions do not change significantly between any of the snapshots. Notice that the distributions have power-law tails, so that more than 95% of both social and local communities have fewer than members. However, the exponent of the tail () of the distribution of social communities () is smaller than that of the distribution of placefriends communities (), indicating that the size of large social communities is more heterogeneous 222The exponents of the tails of the distributions of community sizes have been computed using the maximum likelihood estimator (MLE) for discrete power-law distributions, as indicated in Ref. Clauset2007a . The fit was perfomed by setting .. We are particularly interested in small communities when considering local communities: in a study of communities formed by people communicating using mobile phones, Onnela et al. Onnela11:Geographic found that communities of up to 30 people tended to be geographically tight, with the span of user locations becoming larger more quickly once this size is exceeded. Indeed, Figure 2 confirms that the size of placefriends communities is consistently smaller than that of social communities. This might reflect the ease of establishing an online tie, while the constraint that users within local communities have been to the same places means that these communities are necessarily smaller.
III.2 Shared places
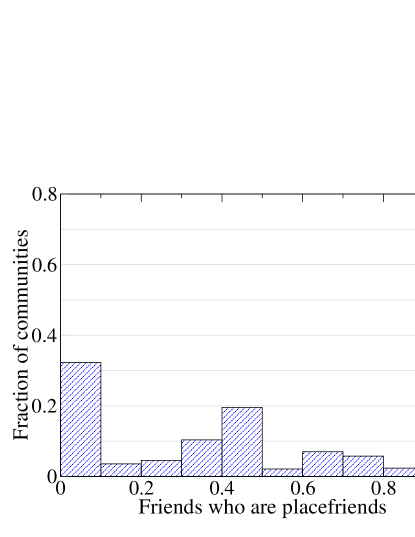
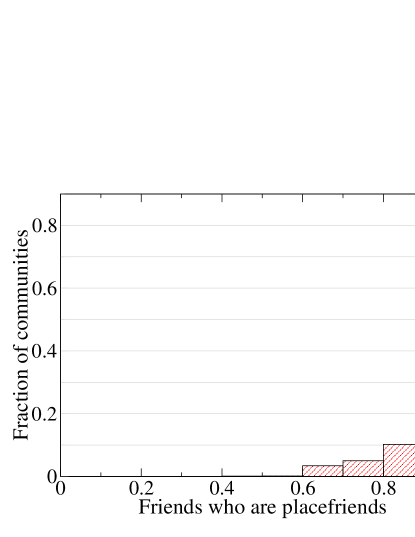
Figure 3 shows how many intra-community social ties in social and local communities are between placefriends (recall that placefriends are two users who have been to one of the same places, not necessarily having a tie in the social graph). Almost all of the social ties between members of local communities connect users who are also placefriends. In contrast, there are many social communities that have no such ties. For instance, we find that in more than 30% of the communities in the social graph, under 10% of the internal edges lie between nodes that are also placefriends, and in more than half the social communities, under 50% of the social ties are between placefriends. In the local communities, however, we can see that in over 80% of the communities, more than 90% of the internal social ties are between placefriends. We thus see that if we perform community detection on the social graph alone we are not able to identify many of the local communities.
Since Gowalla is an explicitly location-focused social network with an emphasis on location sharing, one might expect users to be friends with those who go to the same places. Indeed, this has been shown to be the case by previous research into online location-based social networks: Scellato et al. Scellato11:Exploiting found that during the steady growth period of the service, 30% of links are added between placefriends. However, social communities mainly contain ties between users who do not visit the same places. This is a first piece of evidence that performing community detection on the social graph may not capture local communities, even though spatially close users are more likely to form ties than distant users Stewart41:Inverse .
IV Temporal evolution of communities
We now study the formation and deletion of edges in the social network in each type of community, by examining the social and local communities present in the first snapshot, and identifying the social ties that have been created and deleted by the time of the final snapshot. We consider ties according to whether they are within or between social and local communities. Note that the graph we use here is the subset of the social graph composed of nodes that are in communities at the first snapshot. Isolated pairs of nodes and nodes with no ties are not considered to be in communities.
IV.1 Null model
We compare the actual number of links created or deleted within or between communities since the first snapshot, to the corresponding expected number of links created or deleted in a null model, where new links (resp. old links) are added (resp. removed) at random. The only constraint is that we avoid self-loops and multiple edges between the same pair of nodes. If is the observable of interest (i.e. number of links meeting the given criteria), we denote by the expected value of in the null model, and we compute:
| (1) |
For instance, if we want to assess the significance of edge creation between nodes belonging to the same community, the observable is the total number of edges added between nodes in the same community since the first snapshot, while is the expected number of edges created between nodes in the same community when the same number of new edges are placed uniformly at random. That is, the total number of edges added since the first snapshot, multiplied by the fraction of those edges that could be formed between nodes belonging to the same community. This quantity can be thought of as the number of ‘missing’ edges within communities, i.e. the number of pairs in the same communities that are not connected in the first snapshot. Thus, the expression for reads:
where is the number of edges missing between members of the same community, is the total number of missing edges (between members of the same community and members of different communities), and is the number of edges added between the first and the final snapshots. Instead, if we consider intra-community edge deletion, is equal to the total number of deleted edges in the final snapshot multiplied by the fraction of edges that lie within a community in the first snapshot. As a formula:
where is the number of edges between members of the same community in the first snapshot, is the total number of edges in the first snapshot and is the number of edges that have actually been deleted between the first and the final snapshot.
The same model applies when considering the case of edges created or deleted between communities, but with the obvious replacements of the edge counts for within communities with those for between communities. In summary, is the ratio of the number of edges we actually see being created or deleted between members of the same or different communities, to that we would expect if edges were to be added or removed at random. We can use this to assess the significance of communities for the creation and deletion of edges.
In Figure 4 we give a visual representation of the ratios corresponding to the formation and deletion of edges in the social and in the placefriends graph. In each panel of the figure we represent the results for social and local community communities (yellow and blue boxes respectively).
IV.2 Edge formation and deletion
We first examine which social ties form over the course of the eight snapshots. Figure 4a shows the numbers of pairs of users who are not friends in the first snapshot and have declared a social tie by the final snapshot. The number of social ties formed between members of the same social community is times greater than expected when ties form randomly between disconnected users. The effect is even stronger for local communities: ties are times more likely than expected to form between members of the same local community. This shows that social communities could be useful for applications such as friend recommendation in services like Gowalla, but local communities might be even more valuable to consider.
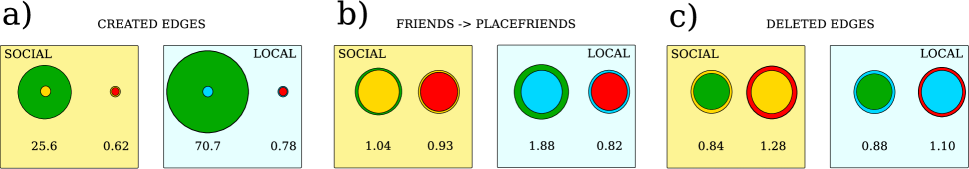
Next, we investigate the conceptually dual problem: which of the pairs of friends who are not placefriends at the start of the snapshots later become placefriends. Figure 4b shows the number of intra- and inter-community pairs of friends who were not placefriends in the first snapshot, who had become placefriends by the final snapshot, that is, they were friends in the first snapshot but had not visited the same place, but had visited the same place by the final snapshot. Members of the same social community are only times more likely than expected to become placefriends than at random. For local communities, the difference is more pronounced: members of the same local community are times more likely to become placefriends than at random. One explanation for this difference could be that if a community is already focused around physical places, members are more likely to go to places where other members have been than when the community is only social. This again demonstrates the potential benefit of specifically considering local communities for applications such as place recommendation.
Finally, we quantify the deletion of social ties between the first and last snapshots. Figure 4c shows the number of social ties that exist in the first snapshot that have been deleted by the final snapshot. Edge deletion is a comparatively rare event in online social networks in general, and in Gowalla in particular, with under of the total edges in the social graph being deleted at all. In both social and local communities, edges between members of the same community are less likely to be deleted than expected at random, and edges between members of different communities are more likely than expected to be deleted. Edge deletion in OSNs has not been extensively studied, due to lack of availability of data Kwak11:Fragile , but this does seem to suggest that being in the same community might indicate that a tie in Gowalla is stronger than one between users in different communities, leading to its decreased likelihood of deletion.
IV.3 Community events
The availability of longitudinal data makes it possible to study the stability of social and local communities, i.e. to quantify whether the community decomposition of the graph observed at the beginning remains stable over time or evolves towards a different partition at the end. Other research has generally agreed on the main types of event that may occur as communities change over time Asur09:Event-based ; Greene10:Tracking ; Palla07:Quantifying ; Tantipathananandh07:Framework . We take the definitions of Asur et al. Asur09:Event-based and denoting the set of nodes making up community in snapshot by , we define the following possible situations:
-
•
Continue: is a continuation of if and only if , i.e. the set of nodes is the same.
-
•
-Merge: and form a merged community if contains at least of the nodes belonging to , and if it contains more than half the nodes in each of and .
-
•
-Split: has been split in snapshot if of nodes in are present in different communities in snapshot . For Split and Merge we take as in Asur09:Event-based .
-
•
Form: A new community forms in snapshot if none of the nodes in were grouped in a community in snapshot .
-
•
Dissolve: A community in snapshot has dissolved in snapshot if none of the nodes in are grouped together in snapshot .
In order to assess not just whether a community is exactly the
same as in a Continue event, but whether it still exists
in some form in the next snapshot although users may have joined or
left, we defined an event Persist:
-
•
Persist: persists in snapshot if:
-
1.
There is a community such that more than half of the nodes in are present in
-
2.
Nodes from make up more than half of the nodes in
-
1.
These latter conditions ensure that the majority of the nodes in the community are still the same, and that the community has not become merged into a larger one. Note that Continue events are a special case of Persist events, in which all the nodes belonging to a given community in a snapshot are put in the same community in the following snapshot.
IV.4 Dynamics of social and local communities
We have been considering placefriends relationships to continue indefinitely in time: local communities have been obtained taking users to be placefriends when they have ever checked in to the same places, regardless of how long ago that was. We now consider placefriends relationships to have different lifetimes and examine how this affects local communities. Specifically, we study the cases where users are considered to be placefriends only if they have checked into one of the same places in a period of weeks ( days), month ( days), or months ( days). Recall that even though we only have the structure of the social graph during the snapshot periods, we have check-ins extending back to the beginning of the service, so it is possible to consider a period of check-ins before the measurement period began.
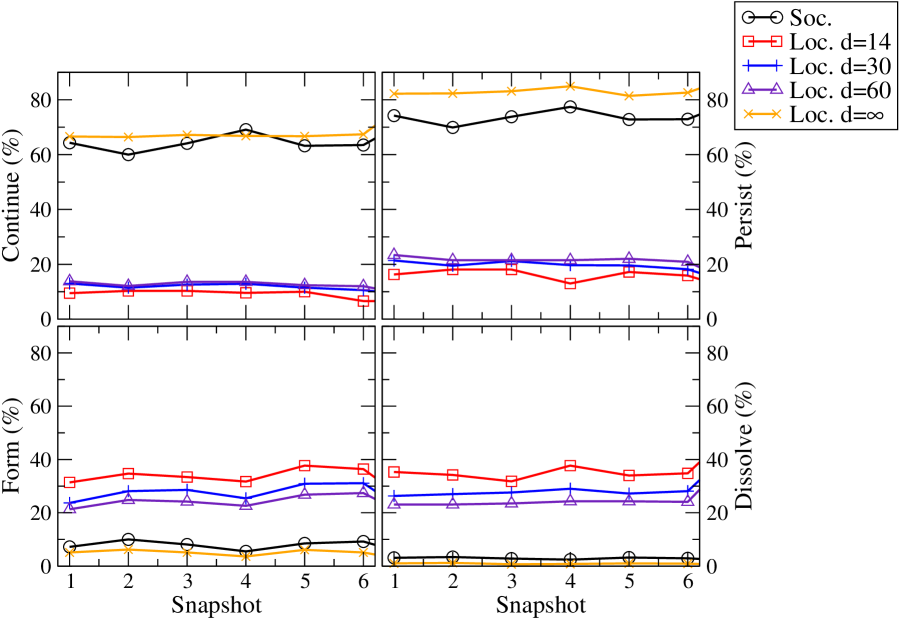
We analysed the occurrence of the community events for both social and local communities over the course of the snapshots. Figure 5 shows the percentages of communities in a snapshot undergoing different types of event, for different time thresholds for the expiration of a placefriends tie. Note that due to the definitions of the events, not all communities will undergo one of the defined events at each snapshot; for example, a community may break up at the next snapshot, but this will not count as a Dissolve event if any of the nodes are still in the same community at the next snapshot. However, it will not count as a Split event unless enough nodes of the previous community are present together in a community at the next snapshot and form more than half of this community; for example, the case where a -member community breaks into pairs, each of which then join different communities, will count neither as a Dissolve nor a Split, though the community has not Persisted.
Figure 5 shows that social communities are rather stable, with a high proportion, or more, remaining unchanged between pairs of snapshots (Persist) and more than continuing to exist between each pair of snapshots with minor changes in membership (Continue). Dissolve events never affect more than of communities between a pair of snapshots. Split and Merge events are very rare, affecting no more than of the communities in any snapshot, and are therefore not shown in the figure.
The figure shows that when we consider placefriends relationships to have a limited duration, local communities become highly volatile: when users must have checked in to the same place within the past weeks to be considered placefriends, under of local communities persist from snapshot to snapshot. The proportion remains under even when the duration is increased to months, which is quite a generous period of time. This is in stark contrast to the very high proportions of persistent communities observed when placefriends relationships are assumed to continue indefinitely; in that case, local communities are more stable than social communities, with over of communities in any one snapshot persisting to the next, and below dissolving.
The instability of local communities when placefriends edges have limited duration may be due to users not consistently checking in at locations when they go there, rather than their ceasing to go to the same places. This would reflect how people use Gowalla as a service, rather than their true mobility, or indeed their relationships with their online friends. Just because users have not checked in at the same place for a while, it does not necessarily mean they no longer see one another, that they are no longer friends, or that they no longer visit that place, and so we must be careful what we infer from the instability of these communities. To investigate what is happening in more detail, we examined firstly whether or not users in local communities that dissolved between snapshots had stopped using the service, and secondly, if they had not, whether they were still checking in to places in the same area. We found that in most cases, users continued to make check-ins in the same geographic area as they had been previously. This would indicate that the dissolution of the local community probably does not indicate that they are no longer in the same area. Furthermore, for all of the -, - and -day lifespans of placefriends relationships, between and of the communities that dissolved after the first snapshot reappeared in one of the later snapshots. This may indicate that the users are still visiting the places that they have in common, but are not regularly checking in using Gowalla. Previous research by Lindqvist et al. Lindqvist11:Mayor into how people use Foursquare, another location-based social network similar to Gowalla, found that people had many reasons for not checking in at locations, ranging from privacy concerns to the fact that they found it ‘boring’ to keep on checking in repeatedly. The unstable local communities that we see here may well be a consequence of this type of behaviour.
V Conclusions
We have analysed social and local communities in Gowalla, an online location-based social network, and demonstrated that the two community structures do not yield the same user groupings. Despite the tendency of spatially close users to form social connections, systems that aim to make use of the existence of both types of community may not be able to rely on simply considering the community structure of the social network, but should take geography into account explicitly. We have seen that local communities could be valuable for friend suggestion and place recommendation, since edges are more likely to form within local communities than within social communities, and friends in the same local community are more likely to visit the same places. Finally, we have shown that while the social graph changes slowly and thus social communities are quite stable, local communities can be very transient or very stable depending on the lifetime given to the placefriends relationship. This has implications for systems aiming to make use of local communities: the choice of timescale at which the placefriends relationship is considered may be crucial due to the way in which users perform check-ins.
These results suggest that location-aware applications aiming to exploit the existence of community structure in OSNs should not rely only on the detection of social communities: these communities can fail to capture local groups. By taking geographic information into account, local communities can be extracted and these may be more useful than social communities in applications such as providing personalised friend suggestions or place recommendations. However, systems making use of local communities should carefully choose the timescale at which they perform community detection, according to the particular needs of the application. This work makes a step towards online social services and systems being able to make better use of community information, as they become increasingly location-aware.
C. B. is a recipient of the Google Europe Fellowship in Mobile Computing, and this research is supported in part by this Google Fellowship. V.N. acknowledges support from the EPSRC project MOLTEN (EP/l017321/1) and from the EU project LASAGNE, contract No. 318132 (STREP).
References
- (1) R. Albert and A.-L. Barabasi, Rev. Mod. Phys. 74, 47 (2002).
- (2) M. E. J. Newman, SIAM Review 45, 167-256 (2003).
- (3) S. Boccaletti, V. Latora, Y. Moreno, M. Chavez and D.-U. Hwang, Phys. Rep. 424, 175 - 308 (2006).
- (4) A. Barrat, M. Barthélemy and A. Vespignani, Dynamical processes on complex networks (2008).
- (5) M. Newman, Networks: an introduction (2010).
- (6) Granovetter, M., Am. J. Sociol. 78, 1360-1380 (1973).
- (7) Coleman, J. S., Am. J. Sociol. 94, S95-S120 (1988).
- (8) C. Castellano, S. Fortunato and V. Loreto, Rev. Mod. Phys. 81,, 591-646 (2009).
- (9) M. Szell, R. Lambiotte and S. Thurner, Proc. Natl. Acad. Sci. USA 107, 31, 13636–13641(2010).
- (10) J.-P. Onnela and F. Reed-Tsochas, Proc. Natl. Acad. Sci. USA 107, 18375-18380 (2010).
- (11) K. Lewis, M. González and J. Kaufman, Proc. Natl. Acad. Sci. USA 109, 68-72 (2012).
- (12) J. Borge-Holthoefer, A. Rivero, García, I, Cauhé, Elisa, A. Ferrer, D. Ferrer, D. Francos, D. Iñiguez, M. P. Pérez, G. Ruiz, F. Sanz, F. Serrano, C. Viñas, A. Tarancón and Y. Moreno, PLoS ONE 6 (2011).
- (13) Crandall, D. J., Backstrom, L., Cosley, D., Suri, S., Huttenlocher, D., and Kleinberg, J. Proc. Natl. Acad. Sci. USA 107, 52 (2010), 22436–22441.
- (14) J. J. Jones, J. E. Settle, R. M. Bond, C. J. Fariss, C. Marlow and J. H. Fowler, PLoS ONE 8 (2013).
- (15) Liu, Y., Viswanath, B., Mondal, M., and Mislove, A. Proceedings of WWW ’12 (2012).
- (16) Papadopoulos, S., Kompatsiaris, Y., Vakali, A., and Spyridonos, P., Data Mining and Knowledge Discovery, 1–40 (2011).
- (17) Pujol, J. M., Erramilli, V., Siganos, G., Yang, X., Laoutaris, N., Chhabra, P., and Rodriguez, P., Proceedings of SIGCOMM ’10, 375–386 (2010).
- (18) M. Girvan and M. E. J. Newman, Proc. Natl. Acad. Sci. USA 99, 7821-7826 (2002).
- (19) M. E. J. Newman, Eur. Phys. J. B 38, 321–330 (2004).
- (20) M. E. J. Newman, Proc. Natl. Acad. Sci. USA 103, 8577-8582 (2006).
- (21) S. Fortunato, Phys. Rep. 486, 75-174 (2009).
- (22) Backstrom, L., Huttenlocher, D., Kleinberg, J., and Lan, X., Proceedings of KDD ’06, 44–54 (2006).
- (23) Kumar, R., Novak, J., and Tomkins, A., Link Mining: Models, Algorithms, and Applications, P. S. S. Yu, J. Han, and C. Faloutsos, Eds. Springer New York, 337–357 (2010).
- (24) Mislove, A., Marcon, M., Gummadi, K. P., Druschel, P., and Bhattacharjee, B., Proceedings of IMC ’07, 29–42 (2007).
-
(25)
Facebook,
http://developers.facebook.com
/blog/post/2012/03/07/building-be%tter-stories-
with-location-and-friends, (2012). -
(26)
Twitter,
http://blog.twitter.com/2009/11/
think-globally-tweet-locally.html (2009). -
(27)
Foursquare,
http://blog.foursquare.com/2013/01/17/
what-the-last-500000000-check-ins-look
-like-and-what-they-show-about
-the-future-of-foursquare/, (2013). - (28) Backstrom, L., Sun, E., and Marlow, C., Proceedings of WWW ’10, 61–70 (2010).
- (29) Cranshaw, J., Toch, E., Hong, J., Kittur, A., and Sadeh, N., Proceedings of UbiComp ’10, 119–128 (2010).
- (30) Liben-Nowell, D., Novak, J., Kumar, R., Raghavan, P., and Tomkins, A., Proc. Natl. Acad. Sci. USA 102, 33, 11623–11628 (2005).
- (31) Scellato, S., Noulas, A., Lambiotte, R., and Mascolo, C., Proceedings of ICWSM ’11 (2011).
- (32) A. Clauset, C. R. Shalizi and M. E. J. Newman, SIAM Review 51, 661-703 (2007).
- (33) M. E. J. Newman, Phys. Rev. Lett. 89,, 208701 (2002).
- (34) M. E. J. Newman, Phys. Rev. E 67,, 026126 (2003).
- (35) Blondel, V. D., Guillaume, J.-L., Lambiotte, R., and Lefebvre, E., J. Stat. Mech. 10, P10008 (2008).
- (36) A. Arenas, J. Duch, A. Fernández and S. Gómez, New J. Phys. 9, 176 (2007).
- (37) Brown, C., Nicosia, V., Scellato, S., Noulas, A., and Mascolo, C., Proceedings of WOSN ’12 (2012).
- (38) Kwak, H., Choi, Y., Eom, Y.-H., Jeong, H., and Moon, S., Proceedings of IMC ’09, 301–314 (2009).
- (39) Onnela, J.-P., Arbesman, S., González, M. C., Barabási, A.-L., and Christakis, N. A., PLoS ONE 6, 4 (2011).
- (40) Scellato, S., Noulas, A., and Mascolo, C., Proceedings of KDD ’11, 1046–1054 (2011).
- (41) Stewart, J. Q., Science 93, 2404, 89–90 (1941).
- (42) Kwak, H., Chun, H., and Moon, S., Proceedings of CHI ’11, 1091–1100 (2011).
- (43) Asur, S., Parthasarathy, S., and Ucar, D., ACM Trans. Knowl. Discov. Data 3, 4 (2009).
- (44) Greene, D., Doyle, D., and Cunningham, P., International Conference on Advances in Social Networks Analysis and Mining (ASONAM), 176 –183, (2010).
- (45) Palla, G., Barabási, A.-L., and Vicsek, T., Nature 446, 7136, 664–667 (2007).
- (46) Tantipathananandh, C., Berger-Wolf, T., and Kempe, D., Proceedings of KDD ’07, 717–726 (2007).
- (47) Lindqvist, J., Cranshaw, J., Wiese, J., Hong, J., and Zimmerman, J., Proceedings of CHI ’11, 2409–2418 (2011).