The Outer Halo of the Nearest Giant Elliptical: A VLT/VIMOS Survey of the Resolved Stellar Populations in Centaurus A to 85 kpc††thanks: Based on data collected at the European Southern Observatory, Paranal, Chile, within the observing Programme 074.B-0741.
Abstract
We present the first survey of resolved stellar populations in the remote outer halo of our nearest giant elliptical (gE), Centaurus A (D Mpc). Using the VIMOS/VLT optical camera, we obtained deep photometry for four fields along the major and minor axes at projected elliptical radii of kpc (corresponding to ). We use resolved star counts to map the spatial and colour distribution of red giant branch (RGB) stars down to magnitudes below the RGB tip. We detect an extended halo out to the furthermost elliptical radius probed ( kpc or ), demonstrating the vast extent of this system. We detect localised substructure in these parts, visible in both (old) RGB and (intermediate-age) luminous asymptotic giant branch stars, and there is some evidence that the outer halo becomes more elliptical and has a shallower surface brightness profile. We derive photometric metallicity distribution functions for halo RGB stars and find relatively high median metallicity values ([Fe/H] to dex) that change very little with radius over the extent of our survey. Radial metallicity gradients are measured to be dex/kpc and the fraction of metal-poor stars (defined as [Fe/H]) is % at all radii. We discuss these findings in the context of galaxy formation models for the buildup of gE haloes.
keywords:
galaxies: photometry - galaxies: stellar content - galaxies: individual: Cen A - galaxies: evolution1 Introduction
Giant elliptical (gE) galaxies contain a large fraction of the stellar mass in the Universe and it is crucial to understand how they form and evolve. Important clues come from analyses of their structures, stellar populations and kinematics and a variety of models have been invoked in order to reproduce and explain their observed properties. The classical monolithic collapse models have stars forming during an early dissipative phase where the gas rapidly flows into the central galaxy regions (e.g. Larson, 1974; Carlberg, 1984; Arimoto & Yoshii, 1987). On the other hand, in the hierarchical scenario of a CDM cosmology, either a few major mergers or several minor mergers and accretion events are believed to build-up the haloes of the largest galaxies (e.g. Kauffmann et al., 1993; De Lucia et al., 2006). Recent work has favoured a two-stage scenario (e.g. Naab et al., 2007; Naab et al., 2009; Kaviraj et al., 2009; Oser et al., 2010, 2012) whereby early in-situ star formation builds up the central parts of gEs at , while later low-mass dry accretions feed the growth at large radii. Such models provide a natural explanation for the observation that some massive ellipticals at high z are more compact than their low redshift counterparts (e.g., Daddi et al. 2005; Trujillo et al. 2006; Buitrago et al. 2008).
Observations confirm the existence of a dominant population of old stars in the centers of gEs (e.g. Thomas et al., 2005), but few constraints exist to date on the properties of stars in regions beyond the effective radius, . The reason for this is that most studies of gEs have been based on integrated light analyses, and the faintness of the outer regions has hindered quantitative study of these parts. Some work has demonstrated the existence of faint tidal debris in the outskirts of ellipticals (e.g. Tal et al., 2009; Janowiecki et al., 2010) while a few recent studies have started to probe kinematics and chemical composition out to increasingly large radii (e.g. Weijmans et al., 2009; Spolaor et al., 2010a, b; Coccato et al., 2010a; Coccato et al., 2010b; Greene et al., 2012; La Barbera et al., 2012). The general picture emerging is one of older ages and lower metallicities in the outskirts of gEs, qualitatively consistent with the predictions of the two-phase model. However, it should be noted that these studies typically have not probed beyond a few effective radii.
To probe gEs to even more extreme radii, techniques other than integrated light analysis are required. Tal & van Dokkum (2011) stack SDSS images of more than 42000 massive red galaxies at in order to explore the mean properties to radii of kpc. They find the halo colour is bluer than the central regions and remains constant beyond . They also find a deviation from a simple Sersic profile (Sersic, 1968) at radii , in the sense that there is excess light, and an increasing ellipticity. While powerful, the stacking technique has the disadvantage that information regarding individual galaxies is lost and the interpretation can be complicated if the stacked sample is not truly homogeneous.
An alternative method is to use resolved stellar populations to probe the outskirts of gEs. This technique can only be applied to a small number of very nearby systems at present, but has the advantage that age and metallicity can be directly constrained from colour-magnitude diagram (CMD) morphology, removing several of the uncertainties inherent in integrated light analyses. Wide-area resolved star counts also allow the structure and extent of individual galaxies to be probed to extremely low effective surface brightness levels, competitive with those attained through the stacking analysis of many thousands of systems. This has already been demonstrated in a number of recent studies of spiral and dwarf galaxies (e.g. Ferguson et al., 2002; Ibata et al., 2007; McConnachie et al., 2009; Barker et al., 2009, 2012; Bernard et al., 2012) but thus far there has been no wide-field study of the resolved stellar populations in a gE.
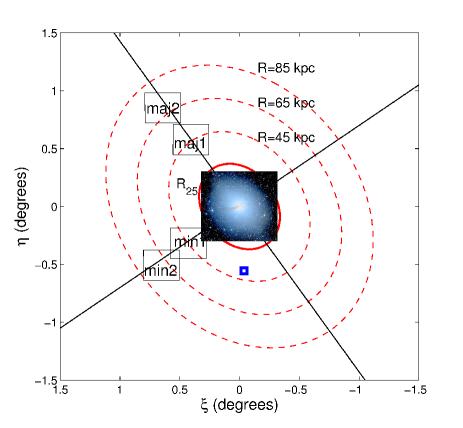
Located at a distance of 3.8 Mpc (Harris et al., 2010a) and sitting at the centre of the homonymous group of galaxies, Centaurus A (Cen A, NGC 5128) is the best target for wide-field resolved stellar populations analysis of a gE from the ground. This peculiar system hosts an active nucleus and shows striking evidence for having experienced a recent gas-rich merger event. In particular, the inner regions ( kpc, or within the 25th -band isophote, R25) contain dust lanes, a dense warped gas disk and diffuse stellar shells and arcs (e.g. Haynes et al., 1983; Malin et al., 1983; Peng et al., 2002, see also Fig. 1). The strong radio emission from Cen A partly overlaps with these optical features, but extends very much further out, covering almost 8 degrees in declination (for a review, see Israel, 1998). Nonetheless, with a mass of M☉ (Woodley et al., 2007; Woodley & Gómez, 2010c) and a luminosity of M, Cen A is typical in a global sense of the field ellipticals seen at low redshift.
Fifteen years ago, the old stellar populations of Cen A were the first to be resolved in a galaxy outside the Local Group by using WFPC2 onboard the Hubble Space Telescope (HST) (Soria et al., 1996). Since then, numerous space- and ground-based studies (Harris et al., 1999; Harris & Harris, 2000, 2002; Marleau et al., 2000; Rejkuba et al., 2001, 2003, 2005, 2011; Crockett et al., 2012) have surveyed Cen A in both optical and near-IR (NIR) bands out to radii of kpc in projection. At the distance of Cen A, the physical scale is 1 arcmin kpc and, given that arcsec kpc (van den Bergh, 1976), this radial extent corresponds to . Amongst the results, the predominantly old red giant branch (RGB) population is found to be moderately metal-rich ([M/H]) with a broad metallicity spread and no significant metallicity gradient. In the deepest HST field studied to date ( kpc), an intermediate-age population is estimated to account for of the population, and has a derived age of Gyr (Rejkuba et al., 2011). A much younger ( Myr), and more localized, trace population is found within kpc, aligned with the radio jet of Cen A and possibly triggered by bow shocks propagating through the interstellar medium (Crockett et al., 2012). Although probing a significant range in radius, these studies are all based on small field-of-view (FOV, a few arcmin2) imagery, leaving open questions about how representative they are of the global properties of Cen A’s stellar halo.
There is also good reason to believe that the halo of Cen A may extend very far out, well beyond the region where previous resolved stellar populations studies have probed. Indeed, globular clusters (GCs) and planetary nebulae have been discovered out to projected radii of kpc (Peng et al., 2004a, b; Woodley et al., 2007, 2010b; Harris et al., 2012, see also Fig. 1). Harris et al. (2007a) discuss the halo of another nearby gE, NGC3379, where the outer stellar halo is found to be predominantly metal-poor at radii . Such a transition from a metal-rich to a metal-poor halo has not yet been observed in Cen A suggesting that, if it is a universal feature of gEs, it may lurk at larger radii.
With this motivation in mind, we have undertaken the first wide-field survey of the resolved stellar populations in the remote outer halo of Cen A. This work is part of a larger programme we are conducting to explore the low surface brightness outer regions of galaxies within 5 Mpc using wide-field imagers on 8-m class telescopes (Barker et al., 2009, 2012; Bernard et al., 2012). In §2 we present our observations and photometric analysis, and in §3 we present the resulting CMDs. In §4 we investigate the structure of Cen A’s outer halo while in §5 we derive metallicity distribution functions (MDFs) and constrain the radial gradients. In §6 we discuss our results, and the summary is presented in §7.
2 The Data
2.1 Observations
Observations were obtained in imaging mode with the VIMOS instrument at the ESO Very Large Telescope (VLT) on Cerro Paranal, Chile under programme 074.B-0741 (Cycle 74, PI: Ferguson). VIMOS (Le Fèvre et al., 2003) is a visible wide field imager and multi-object spectrograph mounted on the Nasmyth B platform of the 8.2m Unit Telescope 3 (Melipal). The instrument is made up of four identical arms, each with a field of view of arcmin2, separated by arcmin. The pixel scale is 0.205 arcsec.
| Field | Rcirc111Projected linear distance from Cen A’s center (, ; taken from the NED database). | Rell222Projected elliptical radius from Cen A’s center, computed assuming b/a and PA (values from the RC3; Corwin et al. 1994). | F | texp | Nexp | Seeingmed | ||
| () | (∘ ’ ”) | (arcmin/kpc) | (arcmin/kpc) | (sec) | (”) | |||
| Cen A-maj1 | 13 27 39.2 | -42 26 35.2 | 42.3/45.7 | 42.3/45.7 | 6000 | 15 | 0.73 | |
| 13 27 40.7 | -42 26 30.1 | 10000 | 8 | 0.76 | ||||
| Cen A-maj2 | 13 28 55.1 | -42 09 57.6 | 63.8/68.9 | 63.8/68.9 | 5200 | 13 | 0.68 | |
| 13 28 55.0 | -42 10 03.7 | 10000 | 8 | 0.58 | ||||
| Cen A-min1 | 13 27 49.8 | -43 20 13.9 | 32.2/34.8 | 41.8/45.1 | 8000 | 20 | 0.57 | |
| 13 27 49.8 | -43 20 17.2 | 8750 | 7 | 0.66 | ||||
| Cen A-min2 | 13 29 04.9 | -43 31 29.3 | 49.8/53.8 | 64.7/69.9 | 6800 | 17 | 0.68 | |
| 13 29 05.0 | -43 31 33.6 | 10000 | 8 | 0.60 |
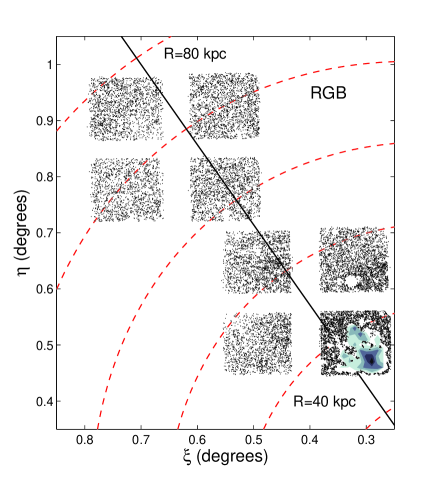
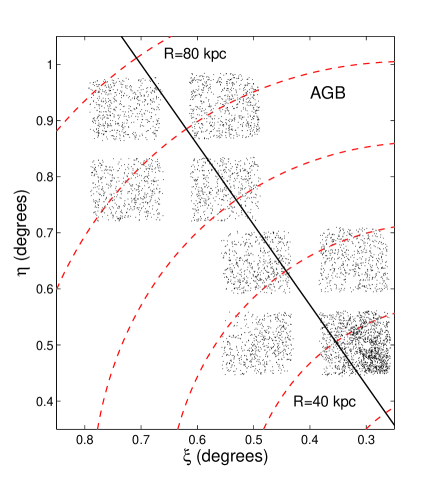
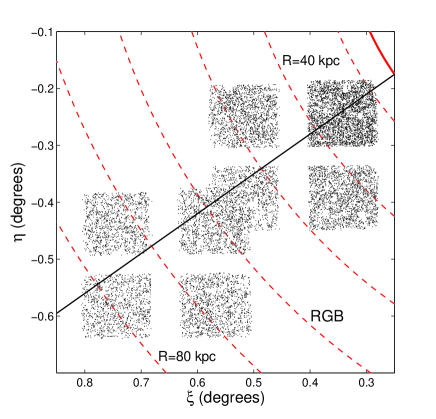
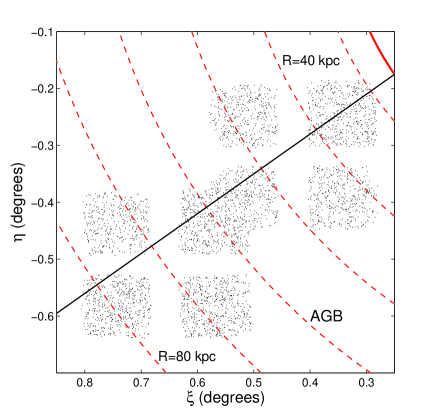
We imaged two fields along each of the major and minor axes, centered at projected galactocentric elliptical radii of and 70 kpc; these fields all lie well beyond the the known shell system of Cen A which is generally confined to R25 (Haynes et al., 1983; Malin et al., 1983; Peng et al., 2002). The radii, which refer to the semi-major axis of the elliptical isophote which intersects a given position, are calculated assuming an axis ratio of b/a and a position angle of (Corwin et al., 1994). Throughout this paper, whenever we refer to a ”radius”, we mean a projected elliptical radius computed in this way. The footprint of each pointing is drawn and labelled in Fig. 1 where some fiducial radii are also marked. This figure also shows the location and size of the deepest extant HST/ACS pointing which lies at a projected radius of kpc. Each of our VIMOS fields was observed with 13 to 20 individual exposures of sec in the -band, and 7 to 8 exposures of sec in the -band. Individual exposures were dithered by a few tens of arcsecs. The seeing was excellent during most of the observing runs, ranging from 0.45–0.98” with median values of ” for -band images and ” for -band images. Full details of the observations are reported in Tab. 1.
The sensitivity of each individual VIMOS detector is lower at the edges, with additional distortion and vignetting in some cases. Stars which fall in these regions are thus not recovered well and we exclude these regions from our analysis. The effective area that was surveyed by our observations (i.e., after eliminating inter-chip gaps, masking bad edges, and considering the overlap between the minor axis fields) is deg2, corresponding to kpc2.
The data reduction procedure followed a modified version of the pipeline developed for processing Wide Field Camera data from the Isaac Newton Telescope (for further details see Irwin 1985, 1997; Irwin & Lewis 2001; Irwin et al. 2004; Barker et al. 2012; Bernard et al. 2012). The first stage includes bias and overscan-correction, plus trimming of each image to the useful active detector area. Master flats were then created by stacking a well-exposed dithered set of 21 -band and 9 -band twilight sky observations. The flat-fielding also corrects for internal gain differences between the detectors. The dark sky -band images were combined to form a master fringe frame. Typical fringe pattern amplitudes were around of the sky with a range of spatial scales. Individual -band science images were corrected for fringing using a scaled version of the master fringe frame.
Before stacking the science images, object catalogues were generated for each image to refine the astrometric calibration and to assess the data quality. A Zenithal polynomial projection (Greisen & Calabretta, 2002) was found to provide an accurate World Coordinate System (WCS) of the telescope plus imaging camera. A third-order polynomial included all the significant radial field distortions and a further six-parameter linear model per detector was used to define the remaining astrometric transformations. The Two Micron All Sky Survey (2MASS) point-source catalogue (Cutri et al., 2003) was used for the astrometric reference system.
Common background regions in the overlap area of individual exposures were used to correct for sky variations during the exposure sequence and the final stack included seeing weighting, confidence (i.e., variance) map weighting and clipping of cosmic rays. First-pass catalogues using standard aperture photometry techniques (Irwin et al., 2004) were generated and used to update the astrometric solution for the stacked images and to provide the aperture corrections to total flux required for the final photometric calibration.
In addition to the science targets, a series of Landolt standard fields (Landolt, 1992) were observed throughout the programme. These were analysed in the same way as the science image and provide the instrumental to photometric system (Johnson-Cousins) calibration. The variation in derived magnitude zero-points seen in the standard field observations was at the level of and we take this to be indicative of the final accuracy of our photometric calibration.
2.2 Photometry
Although aperture photometry was performed as part of the data reduction process, we chose to further perform point spread function (PSF)-fitting photometry on the stacked images so as to more accurately recover faint stars in crowded regions, obtain additional morphological information on detected sources and better assess photometric errors and incompleteness effects. For this we used the photometric suite of programs DAOPHOT and ALLFRAME (Stetson, 1987, 1994). For each chip of the stacked images, the PSF was constructed by using at least 30 bright, non saturated stars, evenly spread across the image. We derived a list of objects with a detection threshold in each filter, and computed the coordinate transformations between the different filters with the DAOMATCH/DAOMASTER packages (Stetson, 1993). The list of stars detected in at least one of the two filters for each chip was used as the input list for the simultaneous photometry on the stacked images using ALLFRAME. In the final stellar catalogue, we retain sources that were detected in both filters with photometric errors smaller than 0.3 mag. Furthermore, we only retain sources that are highly likely to be stellar by requiring absolute values of the sharpness parameter . At magnitudes fainter than , we also require the parameter to be smaller than 1.4–1.6, depending on chip.
We calibrate the magnitudes obtained with our PSF photometry to the Johnson-Cousins system - and -bands by selecting bright stars in common with the aperture photometry catalogue, and then deriving a constant offset between the two. The total number of stars remaining after quality cuts is 104325, of which 37117 are in the inner major axis field (Cen A-maj1), 22170 are in the outer major axis field (Cen A-maj2), 26922 are in the inner minor axis field (Cen A-min1), and 18046 are in the outer minor axis field (Cen A-min2). There is partial overlap between one chip in each of the Cen A-min1 and Cen A-min2 pointings. We chose to match the common sources and retain the photometry from the Cen A-min1 field, since this is the one with the longest exposure time and best seeing in the -band, hence smaller photometric errors.
2.3 Artificial Star Tests
We have performed extensive artificial star tests to quantify the observational uncertainties in our data. We have simulated fake stars for each individual chip in each field with an even spatial distribution and with colours and magnitudes covering the entire colour-magnitude space spanned by the observed stars. The total number of simulated stars per chip is , divided into subsets so as to not substantially increase the stellar crowding on the images. The artificial stars were added to each chip by using the measured PSF. The photometry was then performed in the same way as for the real data, with the same quality cuts applied. We derive photometric errors as the difference between the input and the recovered magnitudes of the fake stars, and assess the incompleteness of our data by counting the number of stars recovered over the total number of injected stars.
| R kpc | |||
|---|---|---|---|
| Cen A-maj | 25.2 | 24.8 | 24.2 |
| Cen A-min | 25.7 | 25.1 | 24.3 |
| R kpc | |||
| Cen A-maj | 25.4 | 25.0 | 24.4 |
| Cen A-min | 25.6 | 25.2 | 24.4 |
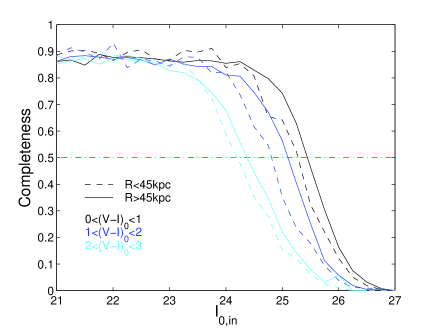
Given that our pointings cover a significant portion of Cen A’s outer halo, it is important to quantify the photometric uncertainties not only as a function of magnitude but also as a function of galactocentric radius. In Fig. 2 we show the completeness curves for the entire sample (i.e., without distinction between major and minor axes) within and beyond kpc and for various colour ranges. As expected, the completeness at a fixed magnitude is somewhat lower at smaller radii because of increased crowding, and it decreases towards redder colours. The derived -band completeness values for the individual major and minor axes are given in Tab. 2. The radial completeness at a fixed colour does not vary significantly along the minor axis, partly due to the fact that the Cen A-min1 pointing had a longer -band exposure time than other pointings. On the other hand, the radial dependence of the completeness along the major axis is mainly driven by the intrinsically higher stellar density at smaller radii. Along the major axis, the typical photometric errors in magnitude are of order mag at for radii kpc, and at for kpc. Along the minor axis, the photometric errors are mag at a for all radii. This information will be incorporated into our spatially-resolved analysis of Cen A’s stellar populations whenever necessary.
3 Colour-Magnitude Diagrams
The CMDs for each of the four VIMOS pointings are shown in Fig. 3. We have dereddened the original magnitudes using the Schlegel extinction maps (Schlegel et al., 1998) and adopting the Cardelli et al. (1989) extinction law. In order to account for possible spatial variations in the reddening (for example, due to the large FOV and the low Galactic latitude of Cen A), we have applied extinction corrections to subfields of 20 arcsec on a side. On these scales, the variations are on the order of mag with respect to the mean extinction values of and . Internal extinction is expected to be negligible in the gas-deficient outer regions of Cen A and we do not take it into account in the subsequent analysis.
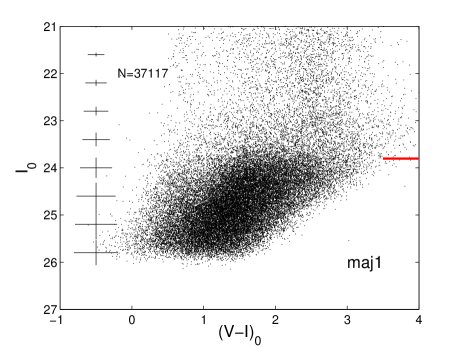
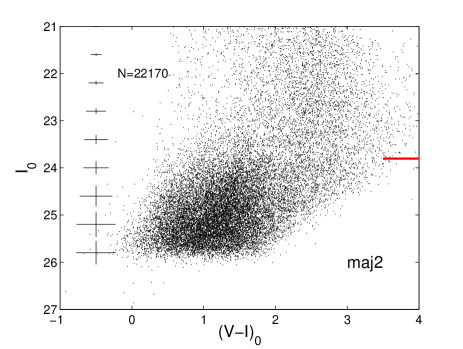
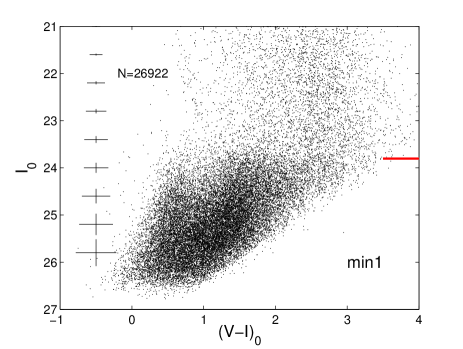
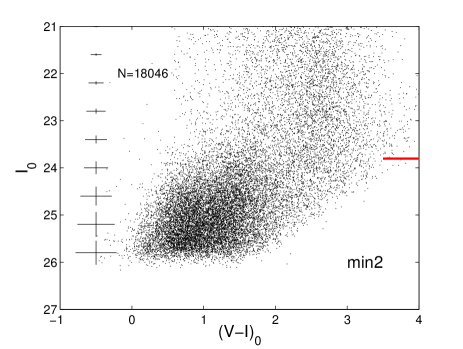
The main feature visible in the CMDs of Fig. 3 is a prominent RGB, a feature indicative of an old population ( Gyr) of evolved cool giants. The upper two magnitudes of the RGB can be seen in all cases. The width of the RGB is broader than the photometric errors derived from the artificial star tests implying an intrinsic spread in colour, likely due to metallicity. The absence of upper main sequence and blue or red supergiant stars excludes the presence of stars younger than Gyr. In the CMDs, there are also some stars brighter than the tip of the RGB (TRGB) which are candidate intermediate-age ( Gyr) luminous asymptotic-giant branch (AGB) stars. However, as discussed below, this region of the CMD is also heavily contaminated by foreground Galactic stars. Similarily, we will also show that objects in the colour range are for the most part unresolved background galaxies.
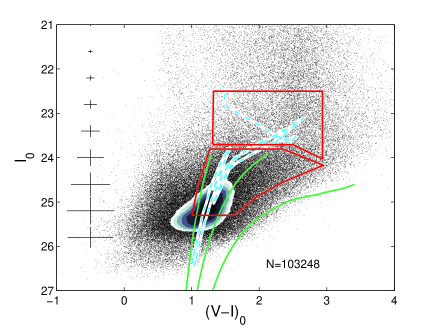
In the top panel of Fig. 4 we show the combined CMD for all stars in our photometric catalogue. We overlay -enhanced ([/Fe] )333The choice of the -enhancement is justified by the mean value found for Cen A GCs, [/Fe] (Woodley et al., 2010a). stellar isochrones from the Dartmouth group (Dotter et al., 2008) shifted to the distance of Cen A with a fixed old age (12 Gyr) and metallicity varying from [Fe/H] to . For our choice of -enhancement, these values translate into a range of [M/H] from to dex using the prescriptions of Salaris et al. (1993). This set of theoretical models has been shown to give a particularly good fit to old and intermediate-age star cluster fiducials (e.g. Glatt et al., 2008). We also show the AGB phase of the Padova stellar isochrones (Girardi et al., 2010). We choose isochrones with a metallicity of (corresponding to [M/H]) and ages of 2 and 4 Gyr (following the age estimates of Rejkuba et al. 2011 for fields at smaller radii).
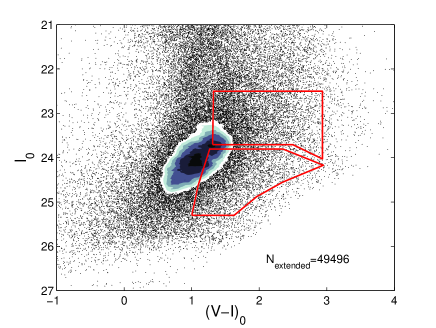
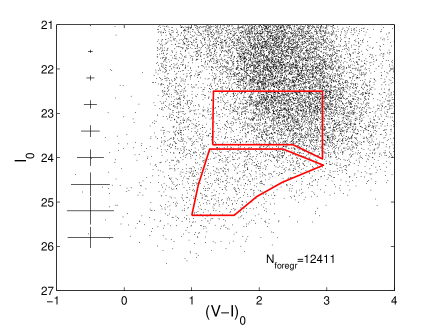
Fig. 4 also shows the selection boxes used to define the locations of the RGB and AGB candidates that we will subsequently analyse. For the RGB box, the faint limit is set by the completeness limit for radii kpc while the bright limit is determined by considering the location of the TRGB. The blue end of the RGB box is defined by the most metal-poor isochrone and excludes the bulk of unresolved contaminants. For the AGB box, we start mag above the TRGB in order to avoid RGB stars scattered up by photometric errors and allow for a luminosity width of 1.5 magnitudes. The colours range from the bluest edge of the RGB to , thus not encompassing the reddest stars in the CMD. Stars with colours redder than this might be dust-enshrouded carbon-rich AGB stars, however only a handful of these are likely to be present and their numbers will be dwarfed by the foreground contaminants which dominate at these colours.
3.1 The Distance to Cen A
The TRGB has a fixed -band absolute magnitude of for predominantly metal-poor old populations (e.g., Rizzi et al., 2007) and can therefore be used as a powerful distance indicator. Harris et al. (2010a) reviews Cen A’s distance measurements to date, as derived with different indicators. Based on their previous HST studies, they report a mean which, when combined with their assumed , yields . We recompute the TRGB values for each of our observed fields using a Sobel edge-detection filter (Lee et al., 1993) and average them to find , in excellent agreement with previous estimates. The significant uncertainty on our value comes from a combination of zero-point and extinction uncertainties, and our chosen binwidth (which depends on the photometric error at the TRGB value). The precise absolute magnitude of the TRGB has a colour/metallicity dependence (e.g. Madore et al., 2009), becoming fainter for metal-rich populations ([Fe/H]). The value reported by Harris et al. (2010a) is computed considering only the metal-poor side of the TRGB. Our data do not reach the reddest magnitudes of Cen A’s RGB () because of incompleteness, so we too are sampling a region where the TRGB magnitude is mostly constant. To be conservative, we used stars with . Finally, we exclude stars bluer than for the TRGB computation, as these are largely contaminated by unresolved background galaxies. Throughout the paper we will use the TRGB value derived in this study.
3.2 Background and Foreground Contaminants
Even under excellent seeing conditions, a substantial number of high-redshift background galaxies will appear as unresolved point sources in ground-based data. Moreover, the low Galactic latitude of Cen A () means that a non-negligible number of Milky Way dwarf stars will be projected along our sight lines. Minimizing this contamination, and ultimately correcting for it, are necessary before we can properly interpret our data.
The min1 field was observed with the best combination of depth and seeing of all our fields. Fig. 3 shows that this CMD has two distinct almost parallel sequences, the particular definition of which is due to the smaller photometric errors. The blue sequence lies blueward of plausible RGB tracks (see top panel of Fig. 4), but redward of where we would expect to see blue plume stars (). Similarly, red and blue supergiants at the distance of Cen A would be expected at slightly redder and bluer colours respectively but at brighter magnitudes than the sequence seen (see Fig. 9 of Barker et al. 2012). As in previous work, we therefore identify the blue sequence as resulting from unresolved background galaxies (Barker et al., 2009, 2012; Bernard et al., 2012). The fact that the surface density of objects in this region of the CMD does not show any trend with galactocentric radius adds further weight to it being a population unassociated with Cen A. To further support our interpretation, we additionally show in the middle panel of Fig. 4 the CMD for all the sources rejected as stars by quality cuts in our PSF photometry. These sources will largely be resolved galaxies. As can be seen, the dominant sequence here does indeed lie blueward of the main RGB sequence. We have used this fact to guide our choice of RGB selection box boundaries so as to limit the contamination by these non-stellar sources. While it is clearly impossible to cleanly separate stars from unresolved galaxies through color-magnitude cuts alone, our conservative approach is designed to optimise the fidelity of our RGB catalogue, if not its completeness.
To quantify the contamination from the Milky Way foreground, we have simulated the CMD of the Galactic population in this direction using the Besançon model (Robin et al., 2003). As inputs, we provide the Galactic coordinates and approximate areas of each of the four observed VIMOS fields. We apply the photometric errors derived from our artificial star tests to the simulated stars, and account for incompleteness by randomly extracting a subsample reflecting the derived recovery level in each magnitude bin. The bottom panel of Fig. 4 shows the simulated Galactic CMD for the four pointings combined. The densest sequences here are clearly recognisable in the observed CMDs and only minimally contaminate our RGB selection box. However, the Galactic populations severely contaminate the AGB selection box, where they contribute up to of the sources along the minor axis. Overall, the predicted number of foreground stars accounts for of the total number of stars observed.
Consideration of the magnitudes and colours of the background and foreground contaminants therefore leads us to conclude that our analysis of Cen A’s remote RGB population will not be strongly affected by their presence. In the subsequent sections, we will use two methods to estimate the actual contaminant source density in our RGB selection box. In the first instance, we will use knowledge of the surface density of objects rejected as stars (i.e. that are resolved) that fall within the RGB selection box to provide a lower limit on the contaminant level. We will also use the surface density of RGB stars in the kpc radial bin along the minor axis as an alternative estimate of the contaminant level. This region has the lowest point source density of all those studied in our survey. Since the number of genuine Cen A RGB stars which reside in this area is unknown, it strictly provides an upper limit on the contamination. The situation is more difficult for the AGB selection box and we resort to using model predictions for the surface density of Galactic stars to assess the contaminant level here.
4 Halo Extent and Structure
4.1 Colour-Magnitude Diagrams as a Function of Radius
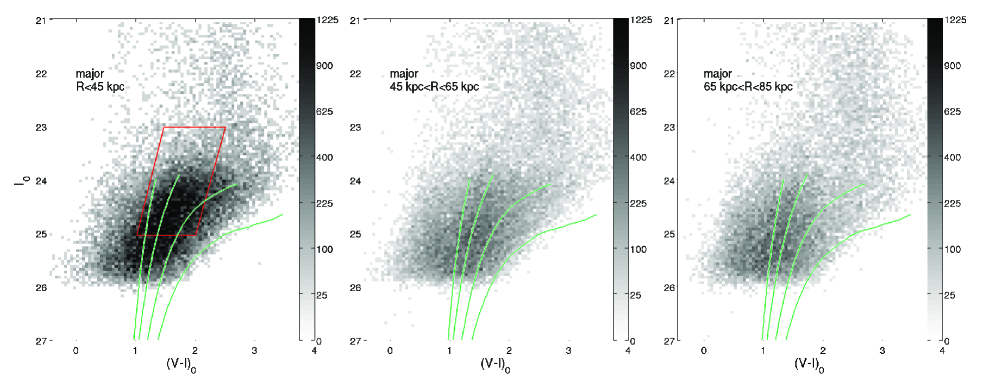
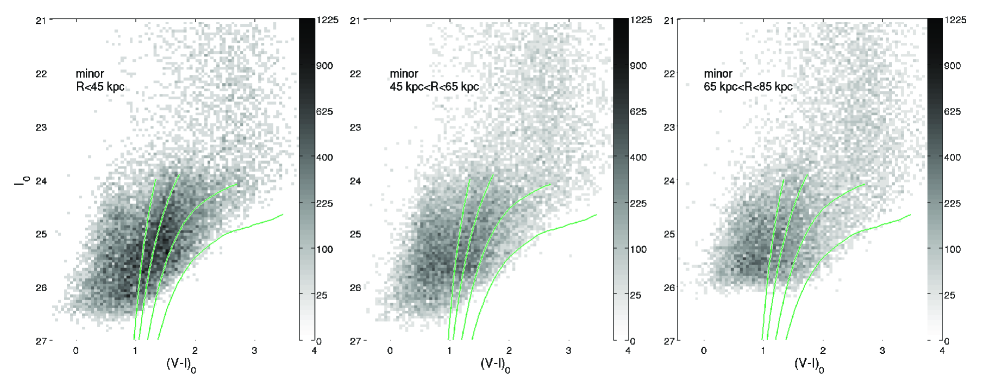
In Fig. 3 we show the CMDs for each of our individual pointings; we now consider the CMDs as a function of radius in order to search for radial variations. Fig. 5 shows Hess diagrams for three radial bins along each of the major and minor axes with Dartmouth stellar isochrones overlaid. Stellar density decreases with radius along both axes, with the highest density measured anywhere occurring at kpc along the major axis. A clear RGB sequence can be seen at all distances along the major axis, testifying to the existence of a halo population at least out to kpc in this direction. On the other hand, it is difficult to discern whether an RGB sequence is present in the outermost bin ( kpc) along the minor axis. This asymmetry in the density of stars along the major and minor axes of the outermost elliptical bin suggests that the outer halo is either more flattened than the inner isophotes would suggest or that it is spatially inhomogeneous on the scales probed by VIMOS. The red extension of the RGB appears to become bluer with increasing radius indicating a decrease in the number of metal-rich stars. However, the colour separation between isochrones does not scale linearly with metallicity and we will subsequently see that this behaviour does not translate into a strong metallicity gradient (see Sect. 5).
4.2 Luminosity Functions as a Function of Radius
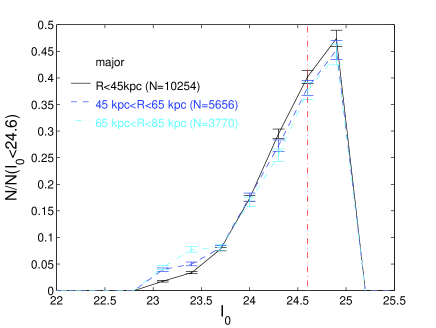
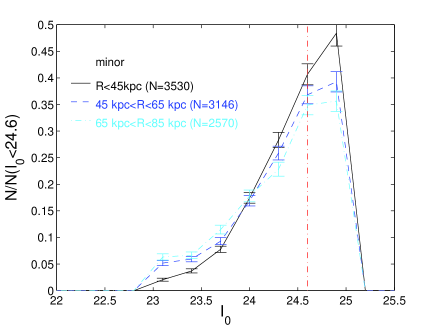
In addition to CMDs, we also examine constraints on halo extent that come from consideration of the luminosity functions (LFs). We construct the LFs by selecting stars in a colour-magnitude box that minimizes the background/foreground contamination as much as possible. Stars are chosen in the magnitude range and in a diagonal colour range with the bottom edge comprising and top edge comprising (see Fig. 5). We choose magnitude bins of mag, the largest photometric error within the adopted colour-magnitude range for the innermost radial bins, and derive histograms in the same radial bins as before. The LFs are corrected for incompleteness as a function of magnitude and radius, and the expected foreground counts, as simulated by the Besançon models, are subtracted off. Finally, in order to facilitate comparison, the LFs in each bin are normalized to the total number of stars brighter than (corresponding to the completeness limit for the most crowded bin, i.e., kpc along the major axis).
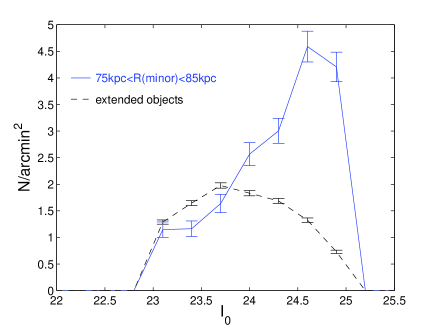
Fig. 6 shows the LFs in radial bins along the major and minor axes. Poissonian errorbars are shown, which include the uncertainty in the completeness corrections and in the Besançon model counts. Although the LFs look broadly similar, the outer bins show an excess of sources brighter than the TRGB () with respect to the innermost bin. Additionally, the LFs become progressively flatter at faint magnitudes in the outer radial bins with the variation being more pronounced along the minor axis. A Kolmogorov-Smirnov (KS) test rejects the null hypothesis that the LFs at radii beyond 45 kpc come from the same underlying population at a significance level.
Although these differences could result from genuine radial variations in the halo populations, it is also plausible that they result from varying relative contributions of Cen A stars and contaminants. Indeed, in the outer halo the latter will contribute an increasing fraction of the overall source counts and will thus have a more profound impact on the LF shape. In Fig. 7 we plot the LF per unit area of sources rejected as stars by our quality cuts, derived from the same selection box as above. If unresolved background contaminants follow the same luminosity distribution as resolved galaxies, then we can assume this is how these objects will contribute to the overall LF. We also show in Fig. 7 the LF per unit area of point sources in the kpc radial bin along the minor axis, which has not been corrected for incompleteness or foreground subtracted (we use the bin kpc rather than kpc in order to avoid as much as possible the presence of Cen A halo stars). Despite the fact that the true fraction of contaminants remains unknown, this comparison illustrates the excellent agreement between the two estimates of background LF shapes at magnitudes brighter than the TRGB. This is reassuring as it indicates that the excess of bright stars with respect to the innermost radial bins is very likely due to an increasing fraction of contaminants at large radii. At fainter magnitudes, the LF of resolved sources turns over with respect to that of point sources in the kpc minor axis bin, consistent with the progressive flattening seen in the outer LFs in Fig. 6. Clearly some of this behaviour will be a result of incompleteness in the resolved source counts but we have no way to correct for this. Without an accurate measurement of the shape and normalisation of the contaminant LF, it is impossible to quantify what fraction of the faint sources in the kpc bin LF are genuine Cen A halo stars however it is likely that this number is non-negligible. Indeed, we have derived TRGB values for each radial bin along both the major and minor axes and find all of them to be consistent with the value derived from the total stellar sample (see Sect. 3), within the uncertainties; this supports the idea that a significant RGB population is present in all our fields.
4.3 Radial Density Distribution
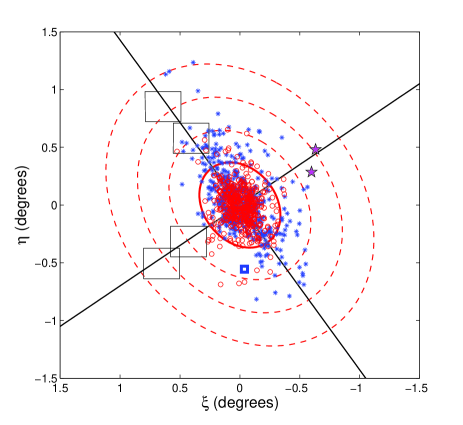
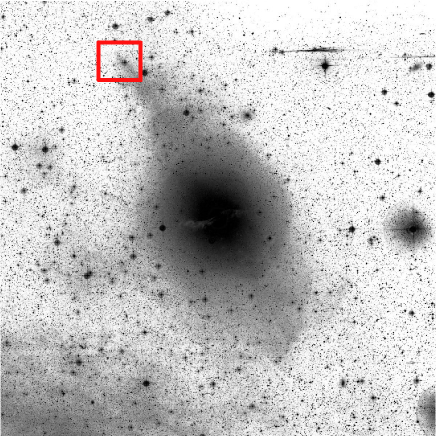
In Fig. 8 we show the spatial distribution of sources falling within our RGB and AGB selection boxes. Small holes in the distribution are mostly due to saturated stars. As noted before, the highest stellar density occurs in the maj1 pointing. Additionally, Fig. 8 reveals that the enhanced density in this region is due in part to a spatially-coherent substructure which is most prominent on the innermost chip; this overdensity is apparent in both the distribution of RGB and AGB candidates. At a radius of kpc, the new substructure lies well beyond the known shell system. To further explore this feature, we retrieved a scanned UK Schmidt Telescope (UKST) IIIa-J survey plate centred on Cen A and spanning on a side. Fig. 9 shows a slightly smoothed version of this plate with an outline of the innermost chip of the maj1 pointing overlaid. The substructure detected in our star count analysis is clearly visible on this deep plate. Furthermore, the plate reveals that the substructure is part of a very large overdensity of stars which protrudes from the main body of Cen A along the north-eastern major axis. Given the morphology of this feature, the most likely origin is post-merger debris from a significant merger event and not individual dwarf galaxy accretions.
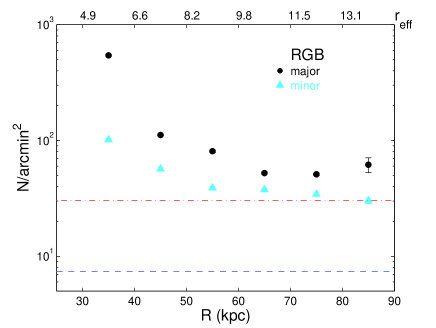
Aside from the innermost major axis field, the RGB stellar density declines smoothly with radius along both axes, while for candidate AGB stars it remains relatively constant. We show the radial density profiles for the RGB sample in the left panel of Fig. 10. These are computed using the same elliptical annuli as before. Star counts are calculated in radial bins for kpc, in steps of 10 kpc, and corrected for incompleteness as a function of radius and magnitude. These profiles are not corrected for foreground/background contaminants. Instead, we indicate the RGB number density for the kpc bin along the minor axis with a dash-dotted line, and assume that this represents an upper limit on the contamination. Similarly, a lower limit is given by the dashed line which is constructed from the sum of resolved background source density and simulated foreground star density, derived in the same selection box as for the RGB sample. As can be seen, these contaminant estimates differ by a factor of . Completeness corrections are very significant for kpc while the last major axis point is calculated from only a very small area (see Fig 8). It is clear that the surface density of RGB stars is always higher along the major axis than the minor axis, and especially for radii kpc. On the other hand, both axes exhibit similar profile shapes with steep declines in the number counts out to kpc and much flatter declines beyond that.
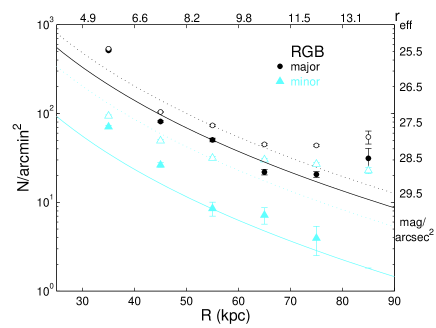
Unfortunately, we cannot construct a surface density (or surface brightness) profile across the whole extent of Cen A’s halo since the UKST plate does not have the required level of linearity for an accurate photometric calibration. Previous studies have constrained the structure of Cen A over small areas. Using data within the inner kpc, van den Bergh (1976) fit a de Vaucouleurs’ law (de Vaucouleurs, 1959) with parameters kpc and mag arcsec-2. Additionally, Dufour et al. (1979) find kpc from - and -band profiles along the major axis, with mag arcsec-2. The smaller effective radius found in the latter study probably results from their exclusion of data at radii kpc.
It is of obvious interest to explore whether the stellar density profile in the outer halo behaves as expected from an extrapolation of the inner profile and we attempt to address this as follows. In the right panel of Fig. 10, we present contaminant-subtracted versions of our RGB radial density profiles using both the upper (filled symbols) and lower (open symbols) limit estimates for the contaminant level. We overplot the de-reddened de Vaucouleurs’ profile derived by van den Bergh (1976), arbitrarily scaled to match the kpc datapoint in each case. Our VIMOS density profiles appear broadly consistent with fall-off of the extrapolated de Vaucouleurs’ profile. There is a reasonable agreement along the minor axis when the upper limit on the contaminant level is adopted, while using the lower limit yields an excess of stars at radii kpc. The major axis profile deviates significantly from the inner extrapolation at kpc regardless of what contaminant level is subtracted. Although some part of this behaviour could be due to a genuine flattening of the halo profile at these radii, the increased radial density in the kpc bin along the major axis suggests additional low-level substructure in these parts. Visual inspection of the outermost chip along the major axis (Fig. 8) provides a tantalising suggestion of this, with a marginally higher stellar density in the outer portion of the chip. Had we assumed a de Vaucouleurs’ profile with an effective radius of 5.5 kpc, as derived by Dufour et al. (1979), our conclusions would be unchanged. For reference, in the right panel of Fig. 10 we indicate the surface brightness values corresponding to the extrapolated de Vaucouleurs’ profile, arbitrarily scaled to match the (upper-limit) contaminant-subtracted major axis profile at 55 kpc.
Finally, the radial density profiles for candidate AGB stars (not shown here) are essentially flat along both axes, except for the significant major axis overdensity at radii kpc. Any genuine AGB stars in these parts are most likely completely outnumbered by foreground and background contaminants.
5 Metallicity Distribution Functions
For largely coeval populations, the colour and width of the RGB constrains the mean metallicity and metallicity spread of the population (the RGB colour is more sensitive to changes in metallicity than it is to changes in age, VandenBerg et al. 2006, e.g.,.). Given that we have not found evidence for a significant intermediate-age AGB population in our VIMOS fields (except for the innermost radial bin along the major axis), we will assume that the Cen A halo population is essentially coeval and proceed to derive photometric MDFs (see, e.g., Harris et al., 1999; Harris & Harris, 2002; Rejkuba et al., 2005, and references therein).
We again adopt 12 Gyr -enhanced ([/Fe] ) isochrones from the Dartmouth group (Dotter et al., 2008), with metallicity ranging from [Fe/H] to [Fe/H] , sampled every 0.2 dex. This choice of age is driven by the analysis of Rejkuba et al. (2011) which indicates that the bulk of the star formation in their 38 kpc field occured Gyr ago on a relatively short timescale ( Gyr).
Our MDFs are calculated only using stars which fall within our RGB selection box, to ensure good completeness. In this region of the CMD, the stellar isochrones are also more widely separated thus reducing the uncertainty in individual metallicity determinations. We linearly interpolate within the isochrone grid to determine the metallicity of each star. The uncertainties are computed by producing 1000 Monte-Carlo (MC) realizations of the interpolation process: each time the CMD position of the star is varied within its photometric uncertainty (with a Gaussian distribution), and the metallicity recomputed.
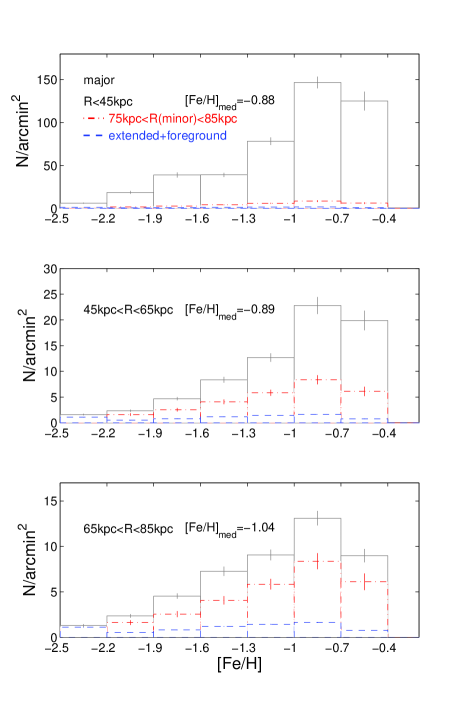
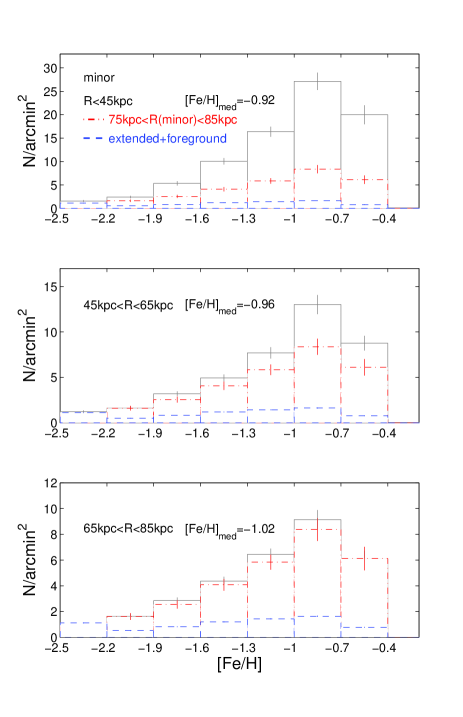
While the derivation of precise absolute metallicity estimates is not possible with photometric data alone, we can nevertheless get robust results on the relative metallicities within our sample. Fig. 11 shows the MDFs, corrected for incompleteness, as a function of radius along both axes, while Tab. 3 tabulates their main properties. The MDFs exhibit the same overall shape consisting of a peak around [Fe/H] and a long tail to lower metallicities. At kpc, the major axis has a slightly larger number of stars more metal-rich than [Fe/H] compared to the minor axis, which translates into a small increase in the median metallicity. This mild enhancement could plausibly be related to the presence of the substructure we have uncovered in these parts. Intriguingly, we find the median [Fe/H] is rather constant across the radial extent of our survey, varying from only to . In particular, there is a change of [Fe/H] dex along the major axis ( kpc, see Fig 8) corresponding to a gradient of dex/kpc. Along the minor axis, the change is [Fe/H] dex over kpc and thus a similarly small gradient of dex/kpc. The metallicity spread, as estimated by the standard deviation of the individual metallicity measurements, is also essentially constant at dex throughout the halo. Finally, the fraction of metal-poor stars (which we define as N[Fe/H]<-1.0/Ntot) shows only a very modest increase of with radius, reaching a maximum of in the outermost bin.
| Field | [Fe/H]med | [Fe/H]med,sub-upp444after subtraction of the upper limit on background/foreground estimate, i.e., the MDF of the kpc bin along the minor axis. | [Fe/H]med,sub-low555after subtraction of the lower limit estimate, i.e., the combined MDF of resolved background sources and simulated foreground stars. | |||
|---|---|---|---|---|---|---|
| kpc (major) | -0.88 | -0.87 | -0.87 | 0.40 | 0.39 | 0.39 |
| 45 kpc kpc (major) | -0.89 | -0.85 | -0.87 | 0.41 | 0.34 | 0.38 |
| 65 kpc kpc (major) | -1.04 | -1.08 | -1.00 | 0.53 | 0.56 | 0.50 |
| kpc (minor) | -0.92 | -0.89 | -0.90 | 0.43 | 0.39 | 0.41 |
| 45 kpc kpc (minor) | -0.96 | -0.87 | -0.91 | 0.46 | 0.34 | 0.41 |
| 65 kpc kpc (minor) | -1.02 | -1.09 | -0.96 | 0.52 | 0.62 | 0.47 |
5.1 Uncertainties
There are a number of uncertainties in the derivation of the MDFs that we now consider. In particular, we wish to address to what extent these uncertainties could affect our derived MDFs as a function of radius. Firstly, intermediate-age AGB stars ascending the giant branch could contaminate our RGB samples and this could be important in our innermost major axis chip where the clear signature of such a population exists. AGB stars will lie on the blue side of the RGB, and will thus artificially enhance the metal-poor population in our MDFs. However, given that the metal-poor population in the innermost major axis bin is small (see Fig. 11), we conclude that this cannot be a significant effect.
Secondly, similar to the LFs discussed in Sec. 4.2, the MDFs we derive will contain both genuine Cen A halo stars as well as contaminants. As the contaminants are not RGB stars at the distance of Cen A, the metallicities computed for them will be meaningless. Both the number and the colour distribution of the contaminants can potentially influence our results. In Fig. 11, we show normalized “MDFs” for our two estimates of the contaminant population, derived in exactly the same way as described above. Our lower limit estimate, based on summing resolved galaxies and foreground models, yields an “MDF” that is fairly flat while our upper limit estimate, based on the outermost portion of the outer minor axis field, bears a strong similarity to those we have derived for the halo. This is not surprising since this field may still contain a significant number of genuine Cen A RGB stars. We subtract these estimates of the contaminant “MDF” from our measured MDF and recompute the median metallicity and metal-poor fractions (see Tab. 3). This has only a small impact on our results and does not affect our inferences regarding the metallicity gradient and metal-poor fraction.
Finally, although we have corrected for incompleteness in deriving our MDFs, these corrections are very significant for the reddest () populations that fall within our RGB selection box. In order test how accurate our completeness corrections are for these metal-rich populations, we use the photometric catalogue for the HST/ACS field at 38 kpc, kindly provided by M. Rejkuba (Rejkuba et al., 2005), which reaches to redder colours and fainter magnitudes than our VIMOS data. We deredden the photometry with the mean extinction values reported in Sect. 3. For the magnitude and colour ranges of relevance for comparing to our VIMOS data, the photometric and colour uncertainties are generally smaller than and mag respectively, and the completeness as derived from artificial star tests is close to . In addition to photometric accuracy, the other main advantage of this catalogue over our ground-based data is its purity. The high resolution (0.049 arcsec/pixel) of the ACS means that background galaxy contaminants can easily be identified and rejected.
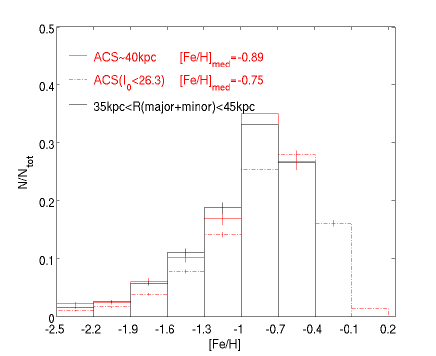
We initially derive the MDF for the HST/ACS catalogue using the same RGB selection criteria and procedure as for our VIMOS data. In Fig. 12 (solid lines), we show the resulting ACS MDF as well as the VIMOS MDF for the same radial range ( kpc), constructed using data along both major and minor axes. The HST/ACS sample yields a median metallicity of [Fe/H] , and a spread (standard deviation) of dex. For a comparison, the VIMOS MDFs at these radii have a median metallicity of [Fe/H] with a spread of dex. Reassuringly, there are only small differences in the median metallicity and the shape of the two MDFs, confirming that that our completeness corrections for the reddest stars in the VIMOS data are accurate, and that contaminating galaxies have a negligible influence on our results at these radii.
We then proceed to derive the MDF for the HST/ACS data using a broader range of colour and magnitude than we are sensitive to with VIMOS in order to assess what systematic biases might arise from the limitations of our photometry. We select RGB stars brighter than and use the whole range of colours in the HST/ACS CMD. The dashed line in Fig. 12 shows the resultant MDF in this case. Overall, there is a good agreement between this MDF and our VIMOS MDF however it peaks at somewhat higher metallicities and has a metal-rich tail not seen in the ground-based data. The median metallicity derived in this way is [Fe/H] with a spread of 0.46 dex. This value translates into [M/H] for our choice of -enhancement, and is in excellent agreement with the mean metallicity [M/H] reported by Rejkuba et al. (2005) (obtained using the VandenBerg et al. 2000 evolutionary models). Finally, the metal-poor fractions for the HST/ACS MDFs are 0.38 (VIMOS selection box) and 0.29 (full colour range) which are within of our VIMOS estimate (i.e., 0.40 for the considered radial range).
In summary, none of the effects discussed above are expected to have a significant impact on our results. The lack of sensitivity to very red stars in the VIMOS data may slightly bias ( dex) our metallicity estimates towards lower values, but it is unlikely that this effect could disguise any strong radial gradients. Contamination from background/foreground objects has even less of an effect on our measurements. We conclude that the moderately high and relatively uniform metallicity in the extended halo of Cen A is a robust result.
6 Discussion
6.1 Halo Extent and Structure
The intrinsic faintness of the outskirts of gEs has made it challenging to quantify the structure and extent of these objects, even in our local universe. We have shown the existence of an RGB population to at least kpc () along the major axis of Cen A. Along the minor axis, there is a clear RGB signature in the CMDs to kpc, however analysis of LFs and TRGB distances suggests that the stellar population extends further in this direction too. The RGB population in Cen A is therefore at least as extended as the distribution of planetary nebulae and GCs (Peng et al., 2004a, b; Woodley et al., 2007, 2010b; Harris et al., 2012). A few studies have shown the existence of stars at very large radii in other ellipticals (e.g., Weil et al. 1997; Harris et al. 2007a, b; Tal & van Dokkum 2011). Taken together, these studies demonstrate the vast extents of elliptical galaxies. Almost all previous studies of ellipticals have focused on regions lying at . While this is sufficient to sample the bulk of the light in these systems, it samples only a small fraction of their physical extents. With the increasing focus on questions related to the size evolution of early-type galaxies (e.g., Buitrago et al. 2008), an understanding of the properties and nature of the peripheral regions of ellipticals is of paramount importance.
The RGB stellar density in Cen A’s halo is always higher along the major axis than the minor axis for a given elliptical annulus. Within kpc (), this results from the presence of a coherent overdensity of stars that we have uncovered along the major axis. The morphology of this feature suggests it is post-merger debris, perhaps originating from the same recent ( Gyr) event that led to the galaxy’s peculiar inner structure (see, e.g., Israel, 1998). The feature is unlikely to be due to triggered star formation from Cen A’s radio jets given the estimated timescale ( years) for this process compared to the typical Gyr age of RGB stars (Israel 1998). The existence of such substructure in Cen A’s far outer halo indicates that these regions are significantly inhomogeneous and that a wide-field approach is required to properly study and interpret the resolved stellar populations in these parts.
Beyond 55 kpc, the difference between the major and minor axis density profiles could plausibly be explained if our assumption of elliptical isophotes with b/a=0.77 and a position angle of breaks down. Indeed, the two profiles could be brought into better agreement if b/a0.5-0.6 in these parts, implying a higher ellipticity in the outer halo. Interestingly, Tal & van Dokkum (2011) find the same result in their stacking analysis of SDSS luminous red galaxies. In particular, they find a mild increase in ellipticity from 0.25 to 0.3 (or equivalently b/a varying from 0.75 to 0.7) at radii . On the other hand, the profile differences in Cen A could simply be due to additional low-level substructure further out along the major axis, a tantalising hint of which may exist in our data.
Finally, we have examined whether the star count measurements we have made in the outer halo are consistent with an extrapolation of the inner surface brightness profile. Along both the major and minor axes, there is evidence for a flattening in the profile shape beyond 60-70 kpc (), the exact details of which depend on the contaminant level subtracted and how the profiles are normalised. Subtracting the upper limit on the contaminant level, approximate power-law profiles of and can be fit to the major and minor axis profiles of Cen A, respectively. A flattening of the outer profile was also seen beyond in the stacked surface brightness profile of Tal & van Dokkum (2011). These authors were not able to tell whether the excess light at large radius was due to a flattening in the galaxy surface brightness profile, or to intragroup light. Indeed, the same ambiguity persists to some extent here although the Cen A group is unlikely to have an extensive intragroup light component.
6.2 Metallicity Gradient
The photometric MDFs derived from our VIMOS data yield median values of [Fe/H] to dex which, given our choice of -enhancement, correspond to [M/H] to dex. The median metallicity is essentially constant, varying by only dex across the radial extent of our survey ( through ). This variation implies negligible gradients, dex/kpc. There are also no strong azimuthal variations, aside from a small enhancement in metallicity in the region of the outer halo major axis substructure. This suggests that either the stellar populations of the accreted system do not differ substantially from the native populations in the outer halo of Cen A or that significant mixing of the debris has already occurred.
The moderately high metallicity found argues against a scenario in which most of the outer halo stars have been accreted from very low mass objects. Crnojević et al. (2010) study a sample of dwarf satellites of Cen A with luminosities in the range M to , corresponding to % the luminosity of Cen A. They find median metallicities of [M/H] , considerably below the outer halo metallicity of Cen A. However, this result may not be surprising. Indeed, Oser et al. (2012) use simulations to argue that the dominant mode of halo assembly is through minor mergers with typical mass ratios of 1:5; such systems are likely to be more metal-enriched than low mass dwarfs.
We can compare our results to previous HST studies of Cen A’s halo. These cover 4 fields in the radial range from to , none of which lie along the major axis (Harris et al., 1999; Harris & Harris, 2000, 2002; Rejkuba et al., 2005). Aside from the central pointing which contains a combination of halo and bulge stars, these fields all exhibit a moderately high mean metallicity ([M/H] to ) with only a small population (%) of low metallicity stars. When combined with our results presented here, this suggests a variation of only dex in [M/H] over the entire extent of the halo. Harris et al. were able to reproduce their MDFs with a simple chemical evolution model in which early star formation proceeds with an initial stage of rapid infall of very metal-poor gas, after which the infall dies away exponentially. Similarily, Rejkuba et al. (2011) argue that most of the stars in their field at formed rapidly and at very early times, with a minority intermediate-age component having formed more recently. The moderate metallicities we find at larger radii in the halo suggests that the qualitative conclusion of rapid collapse continues to hold in these parts, although we have yet to model our MDFs in detail. Interestingly, recent kinematic and abundance studies of GCs in Cen A’s halo (out to kpc) also support a fast, early formation phase, coupled with subsequent merger events (Woodley et al., 2010a, b).
Unfortunately, it is not straightforward to compare our results to those for other gEs. Very few observational studies have been able to investigate the metallicity content of stellar populations at galactocentric radii as large as we have probed in Cen A. HST/ACS observations have been obtained centred at for the nearby “classical” gE NGC3379 ( Mpc; Harris et al. 2007a) and at for the intermediate-sized elliptical, NGC3377 ( Mpc; Harris et al. 2007b). The resulting picture is different for these two systems. NGC3379 shows an extremely broad and flat MDF, with the metal-poor population becoming increasingly dominant at . On the other hand, NGC3377 has an MDF peaked at dex and does not show a significant gradient out to the furthest radius probed (). In integrated light analyses, some systems show continuing metallicity gradients out to (Greene et al., 2012; Weijmans et al., 2009) while others show steepening of gradients when traced as far out as (La Barbera et al., 2012). The stacking analysis of Tal & van Dokkum (2011) yields a clear colour gradient within the inner , with the populations getting bluer and thus more metal-poor (and possibly older) with radius, while the color index flattens out at larger galactocentric distances (out to ). Larger samples will be required to establish what is the typical behaviour for the metallicity gradient at large radii in gEs.
Comparison to the predictions of theoretical models is similarly difficult since existing models do not explicitly address the large radii probed by our study. Theoretical models of gE formation are able to predict both the presence and the absence of metallicity gradients at smaller radii. Monolithic collapse models, in which gas sinks to the centre of the potential well and is enriched by the first generations of evolving stars, predict steep radial metallicity gradients which become more pronounced with increasing galaxy mass due to gas loss efficiency (e.g., Matteucci, 1984; Chiosi, 2002; Kawata & Gibson, 2003; Kobayashi, 2004). On the contrary, in hierarchical models, the physical properties of the resultant galaxy will largely depend on those of the progenitors however the expectation is for metallicity gradients to be shallower due to the mixing of stars (Kobayashi, 2004; Naab et al., 2009). Whether or not these inner trends should extend to larger radii remains an open question.
Finally, we note in passing that the metallicity of RGB stars in Cen A’s outer halo is very similar to that which we have found in the extended stellar envelopes around some spiral galaxies (Barker et al., 2009, 2012). These extended envelopes are also characterised by flatter surface brightness profiles than seen in the inner regions. It is interesting to speculate whether moderate metallicity extended stellar structures could be an ubiquitous feature of all large galaxies, regardless of morphological type.
7 Conclusions
We have conducted a wide-field survey of resolved stellar populations in the outer halo of our closest gE, Cen A, using the VIMOS imager mounted on the VLT. Two fields were imaged along each of the major and minor axes sampling projected elliptical radii in the range kpc (or ). From PSF-fitting photometry, we derive CMDs in - and -bands that reach mag below the TRGB. The CMDs show evidence for an old RGB population, which can be traced to the furthest extent of our survey ( kpc) along the major axis and to at least kpc along the minor axis. However, consideration of LFs and MDFs strongly suggests that the stellar population along the minor axis extends to at least kpc too.
The spatial distribution of RGB stars has been mapped as a function of radius and azimuth. We have uncovered a prominent localized overdensity extending to kpc () along the major axis. Inspection of a deep UKST plate confirms the existence of this structure and shows a morphology consistent with post-merger debris. Our VIMOS data indicate that the metallicity of the constituent stars in this structure do not differ significantly from that of the underlying halo population. Even beyond the extent of this substructure, the major axis stellar density is higher than the minor axis one at a given elliptical radius. This could be evidence for an increasing ellipticity in the outer halo, or conversely for residual low level debris contaminating the outer halo major axis. Uncertainties in the contaminant level make it difficult to rigorously assess whether the outer halo density profile follows an extrapolation of de Vaucouleurs law which characterises the inner regions. Both the major and minor axis profiles appear generally consistent with such an extrapolation, but there is evidence for a flattening in the profile beyond kpc ().
We derive photometric MDFs via isochrone interpolation of RGB stars. The median metallicities we find are relatively high ([Fe/H] to dex, corresponding to [M/H] to dex), with broad spreads of dex. We analyse the median metallicities as a function of radius in order to search for radial gradients, but find only a modest decrease of dex over a range of to . Moreover, the fraction of stars more metal-poor than [Fe/H] increases by only as a function of radius, reaching at the outermost radii probed. When combined with previously published results, the stellar metallicity in Cen A can be seen to vary by dex over the entire radial range of 85 kpc. This apparent constancy of the metallicity is vey intriguing, and suggests that if Cen A does have a metal-poor halo component then it can only dominate much further out.
Our results demonstrate that important constraints on elliptical galaxy formation can come from studying the extent and properties of their extended halos. The faintness and inhomogeneity of these parts requires an approach that combines both depth and wide-field coverage. Unfortunately, Cen A is the only gE that can, at present, be readily resolved into stars over large areas from the ground; other techniques, perhaps less optimal, will be required for additional gEs. Our findings indicate that Cen A itself is also worthy of further study; observations at even larger radii than we have probed here will be required in order to establish its true extent and search for evidence of an underlying metal-poor component to its stellar halo.
Acknowledgments
We thank the service mode support staff at Paranal for conducting the VIMOS observations. We kindly acknowledge M. Rejkuba for sharing the photometric catalogue of her HST/ACS pointing, and N. Hambly for providing the scanned photographic plate image of Cen A. We thank Rodrigo Ibata for providing useful comments that helped us improve our manuscript. DC acknowledges hospitality from the Mullard Space Science Laboratory - University College of London, where part of this work was carried out. DC, AMNF and EJB are supported by an STFC Rolling Grant. This research made use of the NASA/IPAC Extragalactic Database (NED), which is operated by the Jet Propulsion Laboratory, California Institute of Technology, under contract with the National Aeronautics and Space Administration.
References
- Arimoto & Yoshii (1987) Arimoto N., Yoshii Y., 1987, A&A, 173, 23
- Barker et al. (2009) Barker M. K., Ferguson A. M. N., Irwin M., Arimoto N., Jablonka P., 2009, AJ, 138, 1469
- Barker et al. (2012) Barker M. K., Ferguson A. M. N., Irwin M. J., Arimoto N., Jablonka P., 2012, MNRAS, 419, 1489
- Bernard et al. (2012) Bernard, E. J., Ferguson, A. M. N., Barker, M. K., Irwin, M. J., Jablonka, P., Arimoto, N., 2012, MNRAS, 426, 3490
- Buitrago et al. (2008) Buitrago F., Trujillo I., Conselice C. J., Bouwens R. J., Dickinson M., Yan H., 2008, ApJ, 687, L61
- Cardelli et al. (1989) Cardelli J. A., Clayton G. C., Mathis J. S., 1989, ApJ, 345, 245
- Carlberg (1984) Carlberg R. G., 1984, ApJ, 286, 416
- Chiosi (2002) Chiosi C., 2002, in Fusco-Femiano R., Matteucci F., eds, Chemical Enrichment of Intracluster and Intergalactic Medium Vol. 253 of Astronomical Society of the Pacific Conference Series, Formation and Evolution of Elliptical Galaxies. (I). p. 285
- Coccato et al. (2010a) Coccato L., Arnaboldi M., Gerhard O., Freeman K. C., Ventimiglia G., Yasuda N., 2010a, A&A, 519, A95
- Coccato et al. (2010b) Coccato L., Gerhard O., Arnaboldi M., 2010b, MNRAS, 407, L26
- Corwin et al. (1994) Corwin Jr. H. G., Buta R. J., de Vaucouleurs G., 1994, AJ, 108, 2128
- Crnojević et al. (2010) Crnojević D., Grebel E. K., Koch A., 2010, A&A, 516, A85
- Crockett et al. (2012) Crockett R. M., Shabala S. S., Kaviraj S., Antonuccio-Delogu V., Silk J., Mutchler M., O’Connell R. W., Rejkuba M., Whitmore B. C., Windhorst R. A., 2012, MNRAS, 421, 1603
- Cutri et al. (2003) Cutri R. M., Skrutskie M. F., van Dyk S., Beichman C. A., Carpenter J. M., Chester T., Cambresy L., Evans T., et al. 2003, 2MASS All Sky Catalog of point sources.
- Daddi et al. (2005) Daddi E., Renzini A., Pirzkal N., Cimatti A., Malhotra S., Stiavelli M., Xu C., Pasquali A., Rhoads J. E., Brusa M., di Serego Alighieri S., Ferguson H. C., Koekemoer A. M., Moustakas L. A., Panagia N., Windhorst R. A., 2005, ApJ, 626, 680
- De Lucia et al. (2006) De Lucia G., Springel V., White S. D. M., Croton D., Kauffmann G., 2006, MNRAS, 366, 499
- de Vaucouleurs (1959) de Vaucouleurs G., 1959, Handbuch der Physik, 53, 311
- Dotter et al. (2008) Dotter A., Chaboyer B., Jevremović D., Kostov V., Baron E., Ferguson J. W., 2008, ApJS, 178, 89
- Dufour et al. (1979) Dufour R. J., Harvel C. A., Martins D. M., Schiffer III F. H., Talent D. L., Wells D. C., van den Bergh S., Talbot Jr. R. J., 1979, AJ, 84, 284
- Ferguson et al. (2002) Ferguson A. M. N., Irwin M. J., Ibata R. A., Lewis G. F., Tanvir N. R., 2002, AJ, 124, 1452
- Girardi et al. (2010) Girardi L., Williams B. F., Gilbert K. M., Rosenfield P., Dalcanton J. J., Marigo P., Boyer M. L., Dolphin A., Weisz D. R., Melbourne J., Olsen K. A. G., Seth A. C., Skillman E., 2010, ApJ, 724, 1030
- Glatt et al. (2008) Glatt K., Grebel E. K., Sabbi E., Gallagher J. S., Nota A., Sirianni M., Clementini G., Tosi M., et al. 2008, AJ, 136, 1703
- Greene et al. (2012) Greene J. E., Murphy J. D., Comerford J. M., Gebhardt K., Adams J. J., 2012, ApJ, 750, 32
- Greisen & Calabretta (2002) Greisen E. W., Calabretta M. R., 2002, A&A, 395, 1061
- Harris (2010b) Harris G. L. H., 2010b, PASA, 27, 475
- Harris et al. (2012) Harris G. L. H., Gómez M., Harris W. E., Johnston K., Kazemzadeh F., Kerzendorf W., Geisler D., Woodley K. A., 2012, AJ, 143, 84
- Harris & Harris (2000) Harris G. L. H., Harris W. E., 2000, AJ, 120, 2423
- Harris et al. (1999) Harris G. L. H., Harris W. E., Poole G. B., 1999, AJ, 117, 855
- Harris et al. (2010a) Harris G. L. H., Rejkuba M., Harris W. E., 2010a, PASA, 27, 457
- Harris & Harris (2002) Harris W. E., Harris G. L. H., 2002, AJ, 123, 3108
- Harris et al. (2007b) Harris W. E., Harris G. L. H., Layden A. C., Stetson P. B., 2007b, AJ, 134, 43
- Harris et al. (2007a) Harris W. E., Harris G. L. H., Layden A. C., Wehner E. M. H., 2007a, ApJ, 666, 903
- Haynes et al. (1983) Haynes R. F., Cannon R. D., Ekers R. D., 1983, Proceedings of the Astronomical Society of Australia, 5, 241
- Ibata et al. (2007) Ibata R., Martin N. F., Irwin M., Chapman S., Ferguson A. M. N., Lewis G. F., McConnachie A. W., 2007, ApJ, 671, 1591
- Irwin & Lewis (2001) Irwin M., Lewis J., 2001, NewA Rev., 45, 105
- Irwin (1985) Irwin M. J., 1985, MNRAS, 214, 575
- Irwin (1997) Irwin M. J., 1997, Detectors and data analysis techniques for wide field optical imaging.. p. 35
- Irwin et al. (2004) Irwin M. J., Lewis J., Hodgkin S., Bunclark P., Evans D., McMahon R., Emerson J. P., Stewart M., Beard S., 2004, in P. J. Quinn & A. Bridger ed., Society of Photo-Optical Instrumentation Engineers (SPIE) Conference Series Vol. 5493 of Society of Photo-Optical Instrumentation Engineers (SPIE) Conference Series, VISTA data flow system: pipeline processing for WFCAM and VISTA. p. 411
- Israel (1998) Israel F. P., 1998, A&A Rev., 8, 237
- Janowiecki et al. (2010) Janowiecki S., Mihos J. C., Harding P., Feldmeier J. J., Rudick C., Morrison H., 2010, ApJ, 715, 972
- Kauffmann et al. (1993) Kauffmann G., White S. D. M., Guiderdoni B., 1993, MNRAS, 264, 201
- Kaviraj et al. (2009) Kaviraj S., Devriendt J. E. G., Ferreras I., Yi S. K., Silk J., 2009, A&A, 503, 445
- Kawata & Gibson (2003) Kawata D., Gibson B. K., 2003, MNRAS, 340, 908
- Kobayashi (2004) Kobayashi C., 2004, MNRAS, 347, 740
- La Barbera et al. (2012) La Barbera F., Ferreras I., de Carvalho R. R., Bruzual G., Charlot S., Pasquali A., Merlin E., 2012, MNRAS, 426, 2300
- Landolt (1992) Landolt A. U., 1992, AJ, 104, 340
- Larson (1974) Larson R. B., 1974, MNRAS, 169, 229
- Le Fèvre et al. (2003) Le Fèvre O., Saisse M., Mancini D., Brau-Nogue S., Caputi O., Castinel L., D’Odorico S., Garilli B., Kissler-Patig M., Lucuix C., Mancini G., Pauget A., Sciarretta G., Scodeggio M., Tresse L., Vettolani G., 2003, in Iye M., Moorwood A. F. M., eds, Society of Photo-Optical Instrumentation Engineers (SPIE) Conference Series Vol. 4841 of Society of Photo-Optical Instrumentation Engineers (SPIE) Conference Series, Commissioning and performances of the VLT-VIMOS instrument. pp 1670–1681
- Lee et al. (1993) Lee M. G., Freedman W. L., Madore B. F., 1993, ApJ, 417, 553
- Madore et al. (2009) Madore B. F., Mager V., Freedman W. L., 2009, ApJ, 690, 389
- Malin et al. (1983) Malin D. F., Quinn P. J., Graham J. A., 1983, ApJ, 272, L5
- Marleau et al. (2000) Marleau F. R., Graham J. R., Liu M. C., Charlot S., 2000, AJ, 120, 1779
- Matteucci (1984) Matteucci F., 1984, The Messenger, 36, 17
- McConnachie et al. (2009) McConnachie A. W., Irwin M. J., Ibata R. A., Dubinski J., Widrow L. M., Martin N. F., Côté P., Dotter A. L., et al. 2009, Nature, 461, 66
- Naab et al. (2009) Naab T., Johansson P. H., Ostriker J. P., 2009, ApJ, 699, L178
- Naab et al. (2007) Naab T., Johansson P. H., Ostriker J. P., Efstathiou G., 2007, ApJ, 658, 710
- Oser et al. (2012) Oser L., Naab T., Ostriker J. P., Johansson P. H., 2012, ApJ, 744, 63
- Oser et al. (2010) Oser L., Ostriker J. P., Naab T., Johansson P. H., Burkert A., 2010, ApJ, 725, 2312
- Peng et al. (2004a) Peng E. W., Ford H. C., Freeman K. C., 2004a, ApJS, 150, 367
- Peng et al. (2004b) Peng E. W., Ford H. C., Freeman K. C., 2004b, ApJ, 602, 685
- Peng et al. (2002) Peng E. W., Ford H. C., Freeman K. C., White R. L., 2002, AJ, 124, 3144
- Rejkuba et al. (2005) Rejkuba M., Greggio L., Harris W. E., Harris G. L. H., Peng E. W., 2005, ApJ, 631, 262
- Rejkuba et al. (2011) Rejkuba M., Harris W. E., Greggio L., Harris G. L. H., 2011, A&A, 526, A123
- Rejkuba et al. (2001) Rejkuba M., Minniti D., Silva D. R., Bedding T. R., 2001, A&A, 379, 781
- Rejkuba et al. (2003) Rejkuba M., Minniti D., Silva D. R., Bedding T. R., 2003, A&A, 411, 351
- Rizzi et al. (2007) Rizzi L., Tully R. B., Makarov D., Makarova L., Dolphin A. E., Sakai S., Shaya E. J., 2007, ApJ, 661, 815
- Robin et al. (2003) Robin A. C., Reylé C., Derrière S., Picaud S., 2003, A&A, 409, 523
- Salaris et al. (1993) Salaris M., Chieffi A., Straniero O., 1993, ApJ, 414, 580
- Schlegel et al. (1998) Schlegel D. J., Finkbeiner D. P., Davis M., 1998, ApJ, 500, 525
- Sersic (1968) Sersic J. L., 1968, Atlas de galaxias australes
- Soria et al. (1996) Soria R., Mould J. R., Watson A. M., Gallagher III J. S., Ballester G. E., Burrows C. J., Casertano S., Clarke J. T., et al. 1996, ApJ, 465, 79
- Spolaor et al. (2010a) Spolaor M., Hau G. K. T., Forbes D. A., Couch W. J., 2010a, MNRAS, 408, 254
- Spolaor et al. (2010b) Spolaor M., Kobayashi C., Forbes D. A., Couch W. J., Hau G. K. T., 2010b, MNRAS, 408, 272
- Stetson (1987) Stetson P. B., 1987, PASP, 99, 191
- Stetson (1993) Stetson P. B., 1993, in C. J. Butler & I. Elliott ed., IAU Colloq. 136: Stellar Photometry - Current Techniques and Future Developments Further Progress in CCD Photometry. p. 291
- Stetson (1994) Stetson P. B., 1994, PASP, 106, 250
- Tal & van Dokkum (2011) Tal T., van Dokkum P. G., 2011, ApJ, 731, 89
- Tal et al. (2009) Tal T., van Dokkum P. G., Nelan J., Bezanson R., 2009, AJ, 138, 1417
- Thomas et al. (2005) Thomas D., Maraston C., Bender R., Mendes de Oliveira C., 2005, ApJ, 621, 673
- Trujillo et al. (2006) Trujillo I., Förster Schreiber N. M., Rudnick G., Barden M., Franx M., Rix H.-W., Caldwell J. A. R., McIntosh D. H., Toft S., Häussler B., 2006, ApJ, 650, 18
- van den Bergh (1976) van den Bergh S., 1976, ApJ, 208, 673
- VandenBerg et al. (2006) VandenBerg D. A., Bergbusch P. A., Dowler P. D., 2006, ApJS, 162, 375
- VandenBerg et al. (2000) VandenBerg D. A., Swenson F. J., Rogers F. J., Iglesias C. A., Alexander D. R., 2000, ApJ, 532, 430
- Weijmans et al. (2009) Weijmans A.-M., Cappellari M., Bacon R., de Zeeuw P. T., Emsellem E., Falcón-Barroso J., Kuntschner H., McDermid R. M., van den Bosch R. C. E., van de Ven G., 2009, MNRAS, 398, 561
- Weil et al. (1997) Weil M. L., Bland-Hawthorn J., Malin D. F., 1997, ApJ, 490, 664
- Woodley & Gómez (2010c) Woodley K. A., Gómez M., 2010c, PASA, 27, 379
- Woodley et al. (2010b) Woodley K. A., Gómez M., Harris W. E., Geisler D., Harris G. L. H., 2010b, AJ, 139, 1871
- Woodley et al. (2007) Woodley K. A., Harris W. E., Beasley M. A., Peng E. W., Bridges T. J., Forbes D. A., Harris G. L. H., 2007, AJ, 134, 494
- Woodley et al. (2010a) Woodley K. A., Harris W. E., Puzia T. H., Gómez M., Harris G. L. H., Geisler D., 2010a, ApJ, 708, 1335