Host Star Properties and Transit Exclusion for the HD 38529 Planetary System
Abstract
The transit signature of exoplanets provides an avenue through which characterization of exoplanetary properties may be undertaken, such as studies of mean density, structure, and atmospheric composition. The Transit Ephemeris Refinement and Monitoring Survey (TERMS) is a program to expand the catalog of transiting planets around bright host stars by refining the orbits of known planets discovered with the radial velocity technique. Here we present results for the HD 38529 system. We determine fundamental properties of the host star through direct interferometric measurements of the radius and through spectroscopic analysis. We provide new radial velocity measurements that are used to improve the Keplerian solution for the two known planets, and we find no evidence for a previously postulated third planet. We also present 12 years of precision robotic photometry of HD 38529 that demonstrate the inner planet does not transit and the host star exhibits cyclic variations in seasonal mean brightness with a timescale of approximately six years.
Subject headings:
planetary systems – techniques: photometric – techniques: radial velocities – stars: individual (HD 38529)1. Introduction
The study of transiting exoplanets has undergone a remarkable evolution since the first transit detection in HD 209458b (Charbonneau et al., 2000; Henry et al., 2000). Projects such as the Hungarian Automated Telescope Network (HATNet) (Bakos et al., 2004), and SuperWASP (Pollacco et al., 2006) are routinely detecting new transiting planets. Results from the NASA Kepler mission are breaking new ground by discovering planets that are smaller and at longer orbital periods than those accessible from ground-based surveys (Borucki et al., 2011a, b). However, the most important transiting planets for follow-up observations and characterization of atmospheres continue to be those discovered first by the radial velocity (RV) method, because of the bias towards bright host stars. The Transit Ephemeris Refinement and Monitoring Survey (TERMS) seeks to provide more of these opportunites through orbital refinement (Kane et al., 2009), particularly for planets in eccentric orbits with higher transit probabilities (Kane & von Braun, 2008). TERMS also allows the study of long-term variability of the host star such that it can be correlated with the stellar magnetic activity cycle in the context of being a planet-host (Dragomir et al., 2012).
Multi-planet systems present particularly interesting cases since studying the dynamical interaction of the planets is an additional advantage to refining the orbits. One such TERMS target is the planetary system orbiting HD 38529, whose planets have been discovered via precision RV measurements. The inner planet is in a day orbit and was discovered by Fischer et al. (2001). The second planet, in a year orbit, was discovered by Fischer et al. (2003). The system was further investigated in the context of multi-planet systems by Wittenmyer et al. (2009) and Wright et al. (2009), both of whom provided new RV data and revised orbits for the planets. Benedict et al. (2010) furthered the studies of the system by providing new RV data as well as Hubble Space Telescope astrometry. Their analysis indicated that there may be an additional planet located at an orbital period of days, though this was not confirmed by their observations and they encouraged further study to help resolve the issue.
| Value | Value | ||
|---|---|---|---|
| Parameter | Spectroscopic | Interferometric | Reference |
| (mas) | this work (§2.1) | ||
| (mas) | this work (§2.1) | ||
| Luminosity (L⊙) | this work (§2.2) | ||
| Radius (R⊙) | this work (§3.2, §2.1) | ||
| (K) | this work (§3.2, §2.2) | ||
| Fe/H | this work (§3.2) | ||
| (km s-1) | this work (§3.2) | ||
| this work (§3.2) | |||
| Mass (M⊙) | this work (§3.2) | ||
| Age (Gyr) | this work (§3.2) |
In this paper we present an exhaustive analysis of both the host star and the planets in the HD 38529 system. We performed interferometric observations of the host star using the CHARA Array to determine a direct measurement of the radius, which we compare with that derived from an analysis of high-resolution spectra. We provide new RV data for the system, improving the orbits of the planets and greatly extending the time baseline. Our analysis of the combined data finds no evidence for a third planet located near 194 days. From these new data, we calculate an accurate transit ephemeris and predict the parameters of a potential transit of HD 38529b. We present 12 years of precision photometry of HD 38529 acquired with an automated photoelectric telescope (APT) at Fairborn Observatory. These observations rule out a transit of the inner planet. Furthermore, we demonstrate that the host star exhibits a cyclic brightness variation on a timescale of approximately six years which is correlated with the S-index derived from our Keck I spectra.
2. Fundamental Stellar Parameters
2.1. Stellar Radius
HD 38529 was observed during three nights in November 2012 using the Georgia State University Center for High Angular Resolution Astronomy (CHARA) interferometric array (ten Brummelaar et al., 2005). Our observational methods and strategy are described in detail in von Braun et al. (2012) and Boyajian et al. (2012b) and references therein. We used two of CHARA’s longest baselines (S1E1 and E1W1) to perform our observations in -band with the CHARA Classic beam combiner (Sturmann et al., 2003; ten Brummelaar et al., 2005) in single-baseline mode. We obtained 3, 1, and 2 observations (brackets) during the nights of 3, 4, and 12 November 2012, each of which contains approximately 2.5 minutes of integration and 1.5 minutes of telescope slewing per object (target and calibrator). To remove the influence of atmospheric and instrumental systematics, interferometric observations consist of bracketed sequences of object and calibrator stars, chosen to be near-point-like sources of similar brightness as HD 38529 and located at small angular distances from it. We originally used both HD 37077 and HD 36777 as calibrators but eliminated the latter due to the presence of a second fringe packet in each observation, indicating that HD 36777 may be an unresolved binary.
To protect against unknown systematics in interferometric data, we ordinarily require the use of at least two calibrators, two baselines, and data obtained during at least two nights (Boyajian et al., 2012a, b; von Braun et al., 2011a, b, 2012). Thus, we added 12 archival CHARA -band brackets obtained in 2005 using the S1E1 baseline and HD 43318 as calibrator, published by Baines et al. (2008).
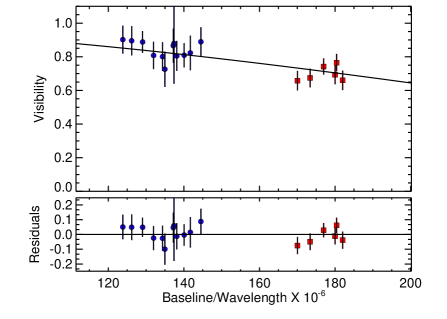
The uniform disk and limb-darkened angular diameters ( and , respectively; see Table 1) are found by fitting the calibrated visibility measurements (Figure 1) to the respective functions for each relation. These functions may be described as -order Bessel functions of the angular diameter of the star, the projected distance between the two telescopes, and the wavelength of observation (see equations 2 and 4 of Hanbury Brown et al. (1974)). Visibility is the normalized amplitude of the correlation of the light from two telescopes. It is a unitless number ranging from 0 to 1, where 0 implies no correlation and 1 implies perfect correlation. An unresolved source would have a perfect correlation of 1.0 independent of the distance between the telescopes (baseline). A resolved object will show a decrease in visibility with increasing baseline length. The shape of the visibility versus baseline is a function of the topology of the observed object (the Fourier Transform of the object’s shape). For a uniform disk this function is a Bessel function, and for this paper, we use a simple model for limb-darkening variation of a uniform disk. The visibility of any source is reduced by a non-perfect interferometer, and the point-like calibrators are needed to calibrate out the loss of coherence caused by instrumental effects.
We use the linear limb-darkening coefficient from the ATLAS models in Claret (2000) for stellar = 5500 K and = 4.0 to convert from to . The uncertainties in the adopted limb darkening coefficient amount to 0.2% when modifying the adopted gravity by 0.5 dex or the adopted by 200K, well within the errors of our diameter estimate.
Our interferometric measurements yield the following values for HD 38529’s angular diameters: milliarcseconds (mas) and mas (Table 1). Combined with the direct distance measurement from van Leeuwen (2007) of pc, we derive a stellar radius for HD 38529 of , which is consistent with calculated by Baines et al. (2008).
2.2. Stellar Effective Temperature and Luminosity
To calculate HD 38529’s effective temperature and luminosity, we produce a spectral energy distribution (SED) fit based on the spectral templates in Pickles (1998) to photometry from Johnson et al. (1966), Cousins (1962), Argue (1966), Mermilliod (1986), Hauck & Mermilliod (1998), Olsen (1993), Cutri et al. (2003), McClure & Forrester (1981), and Golay (1972). We furthermore use the distance calculated in van Leeuwen (2007) and set interstellar reddening to zero.
From the SED fit, we calculate the value of HD38529’s stellar bolometric flux to be erg cm-2 s-1 and, consequently, its luminosity . The calculated effective temperature for HD 38529 is K (see Table 1).
3. Refining the Planetary Orbits
Here we present the new RV data and the revised orbital solution for the HD 38529 system. We combine this with the derived host star properties to determine an accurate transit ephemeris for HD 38529b.
3.1. Spectra Acquisition
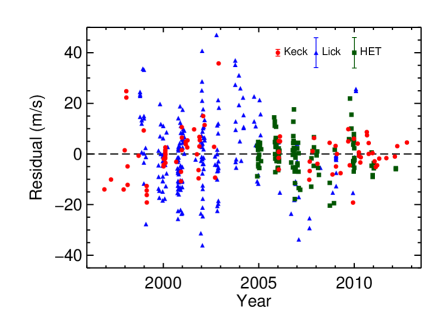
The RV data for HD 38529 presented here comprise 436 measurements and were acquired from 3 instruments/telescopes: the High Resolution Spectrograph (Tull, 1998) on the Hobby-Eberly Telescope (HET), the Hamilton Echelle Spectrograph (Vogt, 1987) on the 3.0m Shane Telescope at Lick Observatory, and the HIRES echelle spectrometer (Vogt et al., 1994) on the 10.0m Keck I telescope. Shown in Table 2 are a subset of the full dataset, available in the electronic version of this paper. The fourth column in Table 2 indicates the six independent datasets that form the combined data, two each from HET, Lick, and Keck. The data sources are as follows: HET data from Benedict et al. (2010); new HET data presented here; Keck data from Wright et al. (2009); Keck data from Wright et al. (2009) before 2009 September 15, new Keck data presented here thereafter; Lick data from Wright et al. (2009); Lick data from Wright et al. (2009) before 2009 September 15, new Lick data presented here thereafter. The division of the Lick data into two separate datasets is necessitated by a change in the dewar resulting in different CCD response characteristics. The offsets between these datasets are accounted for in the Keplerian orbital fitting described below.
| Date | RV | Dataset‡ | |
|---|---|---|---|
| (JD – 2440000) | (m s-1) | (m s-1) | |
| 13341.779899 | -105.27 | 7.77 | 1 |
| 13341.898484 | -118.43 | 7.25 | 1 |
| 13355.845730 | -102.05 | 7.34 | 1 |
| 13357.859630 | -105.27 | 7.48 | 1 |
| 13358.724097 | -87.82 | 7.11 | 1 |
| 13359.729188 | -82.07 | 8.70 | 1 |
| 13360.849520 | -65.85 | 7.80 | 1 |
| 13365.817387 | 1.45 | 7.73 | 1 |
| 13367.812640 | -20.41 | 9.48 | 1 |
| 15095.967984 | 33.82 | 6.08 | 2 |
| 15115.906428 | -45.13 | 6.09 | 2 |
| 15141.862009 | 34.65 | 6.05 | 2 |
| 15142.942977 | 2.05 | 5.64 | 2 |
| 15175.755713 | -66.65 | 5.90 | 2 |
| 15175.758488 | -68.20 | 5.60 | 2 |
| 15176.860583 | -44.69 | 5.07 | 2 |
| 15182.725710 | 38.24 | 4.68 | 2 |
| 15185.724484 | -15.63 | 5.29 | 2 |
| 10418.959317 | 75.60 | 1.32 | 3 |
| 10545.771238 | 12.67 | 1.35 | 3 |
| 10787.014317 | -69.45 | 1.40 | 3 |
| 10807.061991 | -70.45 | 1.30 | 3 |
| 10837.758229 | -111.32 | 1.50 | 3 |
| 10838.784387 | -113.34 | 1.43 | 3 |
| 10861.729653 | -30.86 | 1.42 | 3 |
| 10862.725174 | -41.86 | 1.46 | 3 |
| 11073.058843 | -64.92 | 1.32 | 3 |
| 13750.837303 | 32.41 | 1.18 | 4 |
| 13750.837905 | 32.48 | 1.32 | 4 |
| 13750.839132 | 27.87 | 1.02 | 4 |
| 13751.878079 | 49.46 | 0.99 | 4 |
| 13752.884016 | 47.48 | 0.92 | 4 |
| 13753.895081 | 33.16 | 0.98 | 4 |
| 13775.747373 | -5.19 | 0.91 | 4 |
| 13776.880150 | 10.45 | 0.87 | 4 |
| 14336.130035 | 261.65 | 1.11 | 4 |
| 11101.015625 | -101.58 | 6.57 | 5 |
| 11101.035156 | -111.09 | 6.40 | 5 |
| 11102.014648 | -88.30 | 6.17 | 5 |
| 11102.032227 | -87.47 | 6.68 | 5 |
| 11131.912109 | -91.36 | 5.99 | 5 |
| 11131.930664 | -79.77 | 7.06 | 5 |
| 11132.928711 | -67.59 | 6.02 | 5 |
| 11154.808594 | -140.06 | 6.89 | 5 |
| 11173.906250 | -104.89 | 10.69 | 5 |
| 12267.809570 | 143.48 | 3.88 | 6 |
| 12267.818359 | 150.79 | 3.86 | 6 |
| 12298.721680 | 103.71 | 4.99 | 6 |
| 12298.751953 | 113.82 | 5.33 | 6 |
| 12298.785156 | 105.67 | 5.06 | 6 |
| 12298.815430 | 93.78 | 6.53 | 6 |
| 12299.695312 | 110.60 | 4.16 | 6 |
| 12335.657227 | 206.29 | 4.74 | 6 |
| 12534.970703 | 31.96 | 4.15 | 6 |
3.2. SME Analysis
For additional insight into the properties of the host star, we used Spectroscopy Made Easy (Valenti & Piskunov, 1996) to fit high-resolution Keck spectra of HD 38529. The methodology of this technique, including application of the wavelength intervals and line data, are described in more detail by Valenti & Fischer (2005). We further constrained the surface gravity using Yonsei-Yale (Y2) stellar structure models (Demarque et al., 2004) and revised Hipparcos parallaxes (van Leeuwen, 2007) with the iterative method of Valenti et al. (2009). The resulting stellar parameters are listed in Table 1 along with the directly measured parameters from §2. The SME derived parameters are effective temperature, surface gravity, iron abundance, projected rotational velocity, mass, radius, and age. These properties are consistent with a slightly metal-rich, mid-G sub-giant. There are other literature sources that have analyzed the abundances in HD 38529, namely: Gonzalez et al. (2001), Zhao et al. (2002), Bodaghee et al. (2003), Ecuvillon et al. (2006), Gilli et al. (2006), Takeda et al. (2005), Delgado Mena et al. (2010), Brugamyer et al. (2011), Kang et al. (2011), Petigura & Marcy (2011). These catalogs contain FeH values measured with a variety of telescopes, techniques, and stellar models, and the determinations span the range of 0.28–0.46 dex with a mean of 0.38 dex and a median of 0.40 dex. These findings are consistent with the results of Valenti & Fischer (2005), where the average error for FeH is dex.
The stellar radius is an essential parameter for estimating the depth and duration of a planetary transit. Although the spectroscopic and interferometric derived temeperatures are consistent with each other, the radii are not. This difference is a result of the SME luminosity, which uses bolometric corrections. These corrections can sometimes be unreliable for evolved stars such as HD 38529 and, in this case, is underestimated compared with the luminosity derived from the SED fit and parallax. Since a similar is found from the two techniques, this results in a reduced radius estimate. As described in §3.5, we adopt the interferometric radius for the purposes of estimating the predicted transit properties.
3.3. Keplerian Orbital Solution
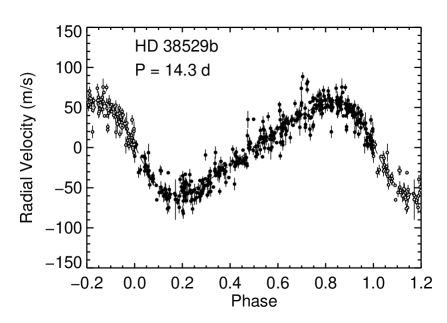
We fit a two-planet Keplerian orbital solution to the RV data using the partially linearized, least-squares fitting procedure described in Wright & Howard (2009) and estimated parameter uncertainties using the BOOTTRAN bootstrapping routines described in Wang et al. (2012). Table 3 lists the resulting parameters for the two-planet orbital solution. The data and orbital solutions are shown separately for the b and c planets in Figure 2, along with the residual velocities with respect to the best 2-planet orbital solution. The improved mass estimate for planet c combined with the Fine Guidance Sensor (FGS) astrometry of Benedict et al. (2010) yields a true mass estimate of . As noted by Benedict et al. (2010), this lies within the brown dwarf mass regime.
| Parameter | Value |
|---|---|
| HD 38529 b | |
| (days) | |
| (JD – 2,440,000) | |
| (JD – 2,440,000) | |
| (m s-1) | |
| (deg) | |
| sin () | |
| (AU) | |
| HD 38529 c | |
| (days) | |
| (JD – 2,440,000) | |
| (m s-1) | |
| (deg) | |
| sin () | |
| (AU) | |
| System Properties | |
| (m s-1) | |
| Measurements and Model | |
| 436 | |
| rms (m s-1) | 11.76 |
| 11.67 | |

The fit required five additional free parameters due to the offsets between the six independent datasets. The offsets with respect to the observations acquired with HET dataset 2 (the new HET data presented in this paper, see §3.1) are , , , , and m s-1 for datasets 1, 3, 4, 5, and 6 respectively. As shown in Table 3, the and rms scatter of the residuals are relatively large. The major contributor to the calculated value are the Keck data whose uncertainties are significantly smaller than those associated with the Lick and HET data. Specifically, the Keck rms scatter of 8.6 m s-1 exceeds its internal error, which has a median value of 1.3 m s-1. This indicates that there is a stellar noise component to the overall noise level which is not accounted for in the fit. The causes of the stellar noise, including pulsations and star spot activity, are discussed in detail by Benedict et al. (2010). Another hypothesis is that of an additional planet with an amplitude of m s-1. We explain in the following section that our data do not support detection of such an additional planet.
3.4. A Third Planet?
Benedict et al. (2010) utilize their results to speculate on evidence for a third planet in the system. Thus, we also consider this possibility from our analysis since our RV data comprise a substantially larger dataset. As reported by Benedict et al. (2010), a coplanar orbital solution is only stable if the third planet has a period within the window of days and an eccentricity of , or a period larger than their RV data baseline ( years). For this reason, we focused our search for the third planet within the period window of days and constrained the eccentricity to be .
We first searched for strong periodic signals in the residuals of the two-planet Keplerian solution by fitting sinusoids to the residuals at different periods within days (with 0.4 day step in period). The results are plotted as the solid line in Figure 3. We then estimated the false positive probability to see if any of the strong peaks are significant. We define the false positive probability for a peak with a certain amplitude as the probability that a signal with amplitude is generated by the residuals by chance. We generated 1000 sets of simulated residuals by scrambling the true residuals (and their associated errors, with replacements), and then searched for the peak with largest amplitude within the day window for each of the 1000 scrambled data sets. These 1000 amplitudes provide approximately the distribution of amplitudes arising purely from random noise in the residuals. Any peak in Figure 3 that has an amplitude smaller than 950 (95%) of these 1000 amplitudes is thus considered having false positive probability of . This is marked by the top dashed line in Figure 3 and similarly for the and lines.
As shown in Figure 3, no peak has a false positive probability of less than 5%, and there are just two with less than 10% at 119 days and 164 days. The highest peak at 164 days has a false positive probability of 6.8%. We see no significant peak around 194 days as reported by Benedict et al. (2010). We then performed 3-planet Keplerian fit with our RV data within the day window and with the constraint that the eccentricity must be smaller than 0.3. We found that indeed the best-fit is near 164 days, with (also true if we force the third planet to be on a circular orbit; best-fit if no constraint on is required). The of this fit is 9.58, and an f-test suggests that the 3-planet model provides a better fit though having 5 more parameters. However, the rms for this fit is 11.92 m s-1, i.e., adding a third planet does not reduce the rms of the fit. Combining with the fact that this signal at days does not have lower than 5% false positive probability, we cannot conclude that our data have detected a third planet in the HD 38529 system.
We note here that including or excluding this third planet does not affect our transit exclusion analysis in the following sections, because the changes in the orbital parameters for both HD 38529b or c, after adding the third planet, are smaller than their error bars listed in Table 3.

3.5. Transit Ephemeris Refinement
From the stellar and planetary properties listed in Tables 1 and 3, we compute a refined transit ephemeris for HD 38529b. We use the directly measured radius of the host star determined from our CHARA observations. We approximate the radius of the planet as , based upon the mass-radius relationship described by Kane & Gelino (2012). These properties lead to a predicted transit duration of 0.33 days and a predicted transit depth of 0.17% or 0.0018 mag. Kane & von Braun (2008) show how the probability of a planetary transit is a strong function of both the eccentricity and the argument of periastron. The periastron argument of HD 38529 is particularly well-aligned for transit probability enhancement since it is quite close to the optimal angle of . Combined with the eccentricity, this results in a transit probability of 12.8%. However, if the planet were in a circular orbit, the duration would be increased to 0.43 days but the probability would be reduced to 9.5%.
The calculation of the transit mid-point shown in Table 3 was performed with a Monte-Carlo bootstrap, which propagates the uncertainty in this orbital parameter to the time of the transit. The resulting uncertainty in the transit mid-point is . As such, the transit window is dominated by the predicted duration rather than the mid-point uncertainty, making it a suitable candidate for photometric follow-up (Kane et al., 2009). Thus, we compute a revised transit ephemeris from the orbital fit, which we utilize in the following sections.
4. Photometric Observations
We have acquired 1106 photometric observations of HD 38529 on 992 nights between 2000 November 28 and 2012 March 31, all with the T11 0.80 m Automated Photoelectric Telescope (APT) at Fairborn Observatory in Arizona. The T11 APT, one of several such telescopes operated at Fairborn by Tennessee State University, is equipped with a two-channel precision photometer that uses a dichroic filter and two EMI 9124QB bi-alkali photomultiplier tubes to separate and simultaneously measure the Strömgren and pass bands. We programmed the APT to make differential brightness measurements of our program star HD 38529 (P, , , G4 IV) with respect to the two comparison stars HD 38145 (C1, , , F0 V) and HD 40259 (C2, , , F0 V). From the raw counts in both pass bands, we compute the differential magnitudes , , and , correct them for atmospheric extinction, and transform them to the Strömgren system. To improve our photometric precision, we combine the differential and observations into a single passband, which we indicate with the subscript . Furthermore, we compute the differential magnitudes of HD 38529 against the mean brightness of the two comparison stars. The resulting precision of the individual differential magnitudes ranges between mag and mag on good nights, as determined from the nightly scatter in the differential magnitudes of the constant comparison stars. Further details of our automatic telescopes, precision photometers, and observing and data reduction procedures can be found in Henry (1999) and Eaton et al. (2003) and references therein.
The resulting 1106 differential magnitudes, spanning 12 consecutive observing seasons, are summarized in Table 4 and plotted in the top panel of Figure 4, after normalization to bring the seasonal means to a common level indicated by the horizonatal line in the top panel. The normalization removes season-to-season variability in HD 38529 perhaps caused by a starspot cycle in this mildly active star (see below). The scatter in the normalized data from their grand mean is mag (standard deviation). This is slightly larger than our typical measurement precision given above, suggesting low-amplitude, night-to-night variability in HD 38529.

| Observing | Julian Date Range | Sigma | Full Amplitude | |||||
|---|---|---|---|---|---|---|---|---|
| Season | (HJD 2,400,000) | (mag) | (days) | (mag) | (mag) | (mag) | (mag) | |
| (1) | (2) | (3) | (4) | (5) | (6) | (7) | (8) | (9) |
| 2000–01 | 47 | 51877–51997 | 0.00181 | |||||
| 2001–02 | 88 | 52169–52368 | 0.00190 | |||||
| 2002–03 | 76 | 52532–52732 | 0.00219 | aaTime of mid-transit. | ||||
| 2003–04 | 95 | 52894–53094 | 0.00166 | |||||
| 2004–05 | 103 | 53258–53462 | 0.00138 | |||||
| 2005–06 | 101 | 53627–53827 | 0.00175 | |||||
| 2006–07 | 118 | 53996–54194 | 0.00177 | aaPeriodogram analysis gave half of the quoted period, implying the star had spots on both hemispheres at those epochs. We doubled the photometric periods and their errors in these cases to get . | ||||
| 2007–08 | 110 | 54370–54556 | 0.00187 | aaPeriodogram analysis gave half of the quoted period, implying the star had spots on both hemispheres at those epochs. We doubled the photometric periods and their errors in these cases to get . | ||||
| 2008–09 | 104 | 54734–54919 | 0.00198 | |||||
| 2009–10 | 86 | 55092–55284 | 0.00189 | |||||
| 2010–11 | 95 | 55459–55650 | 0.00184 | |||||
| 2011–12 | 83 | 55830–56018 | 0.00157 |
The normalized observations from all 12 observing seasons are replotted in the middle panel of Figure 4, phased with the 14.3 day planetary orbital period of HD 38529b and the time of mid transit () from Table 3. A least-squares sinusoidal fit to the phased data gives a formal semi-amplitude of just mag, which limits any periodic brightness variability of the star on the orbital period to a very small fraction of one milli-magnitude (mmag). This rules out the possibility that the 14.3-day radial velocity variations are simply jitter induced by stellar activity, as has been documented in slightly more active stars, for instance, by Queloz et al. (2001), Paulson et al. (2004), and Boisse et al. (2012). Instead, the lack of photometric variability confirms that the radial velocity variations in HD 38529 result from true planetary reflex motion.
The photometric observations within phase units of mid-transit are plotted with an expanded scale in the lower panel of Figure 4. The solid curve shows predicted transit phase (0.0), depth ( mag), and duration ( phase units) of a central transit, all computed from the stellar radius in Table 1 and the orbital elements of HD 38529b in Table 3. The vertical dotted lines give the uncertainty in the timing of the transit window, based on the uncertainties in the stellar radius and the improved orbital elements from Tables 1 & 3, respectively. Our data set contains 1084 photometric observations that lie outside the predicted transit time (solid curve); these have a mean of mag. There are 22 observations that fall in transit; these have a mean of mag. The difference is our “observed transit depth,” mag in the sense that the mean of the transit points is slightly brighter than the mean of the out-of-transit observations but are, nevertheless, consistent with zero to four decimal places. As the lower panel shows, we have sufficient data around predicted transit times to rule out transits to a depth of mag.
It has been suggested by Anglada-Escudé et al. (2010) that planetary systems in 2:1 orbital resonance can be mistaken for a single planet in an eccentric orbit. If planet b has an orbital period that is half of the derived day period, then it would have an even higher transit probability and thus a higher chance of being detected in the photometric data. We performed a search through the 12-year photometric data set for periodic transits around 7.155 days and around 14.3 days. No transits were detected at or near either period. Although a dynamical model of a 2:1 resonance would lead to aperiodic transit times, the complete phase coverage of our photometric observations over a range of periods around 14.3 days leads us to conclude that such transits are ruled out.
As noted above, the scatter in the normalized data set is slightly larger than the expected measurement precision, suggesting the presence of small starspots on HD 38529. Starspots on the photospheres of solar-type stars allow the possibility of direct determination of stellar rotation periods from rotational modulation in the visibility of the spots and the consequent variability in the star’s brightness (see, e.g., Simpson et al., 2010). Spots can also produce periodic radial velocity variations that can mimic the presence of a planetary companion. Therefore, we performed periodogram analyses for each of the 12 seasons of normalized photometry plotted in the top panel of Figure 4 and, indeed, found very low-amplitude periodic brightness variations in 8 of the 12 observing seasons. Similar analyses of the twelve seasonal datasets evinced no significant periodicity in the comparison stars. Figure 5 shows a sample frequency spectrum and phase curve for Season 5. Complete results are given in columns 5 & 6 of Table 4. The seasonal photometric periods scatter about their mean with a standard deviation of day. The weighted mean of the 8 photometric periods is days, which we take to be our best determination of the star’s rotation period. This period is based on far more observations than the preliminary periods of 35.7 and 31.6 days given by Fischer et al. (2003) and Benedict et al. (2010), respectively. The seasonal peak-to-peak amplitudes in column 6 range between 0.002 to 0.004 mag, indicating spot filling factors of only a few tenths of one percent. Both the low level of spottedness and the fact that the stellar rotation period is distinctly different from the 14-day radial velocity period and its harmonics demonstrates that stellar activity (spots and plages) is not the source of the 14-day radial velocity period.

If the inclination of HD 38529’s rotation axis is near , so that approximately equals the equatorial rotation velocity, , then the stellar radius and projected rotational velocity from Table 1 result in a rotation period of days, essentially identical to our observed value of days. This implies a very high inclination for the stellar rotation axis and increases the probability of transits of HD 38529b, assuming the stellar equatorial and planetary orbital planes are aligned. Moutou et al. (2011) have shown, for instance, that the orbital planes of the hot jupiters HAT-P-8b, HAT-P-9b, HAT-P-16b, & HAT-P-23b are all closely aligned with the stellar rotation axis. In the same paper, Moutou et al. (2011) examined 37 exoplanetary systems that have accurately measured spin-orbit angles and found that spin-orbit misalignment occurs primarily for stars with K (spectral class F6 and hotter). Thus, the orbital geometry, the high stellar inclination, and the likelihood of spin-orbit alignment are all favorable for transits of HD 38529b, making our non-detection particularly disappointing.
Finally, we examine long-term variability in HD 38529’s Ca II H and K indices and APT photometry to look for evidence of magnetic cycles that might induce apparent radial velocity variations and so mimic the presence of a long-period planet. Both H and K emission and brightness variability are good proxies for stellar magnetic activity (see, e.g., Baliunas et al., 1995, 1998; Lockwood et al., 2007, and references therein). In the top panel of Figure 6, we plot seasonal means of the Mount Wilson S-index derived from our Keck I RV spectra as described in Wright et al. (2004) and Isaacson & Fischer (2010). Despite a couple of observing seasons without Keck H and K measurements, clear variability is seen on a timescale of several years. In panels 2 & 3, we plot the 12 seasonal mean and differential magnitudes (Table 4) without any normalization, as was applied to the differential magnitudes in Figure 4. These two lightcurves show that HD 38529 varies in brightness by several mmag from year-to-year with respect to both comparison stars C1 and C2. The bottom panel of Figure 6 plots the yearly mean comparison star differential magnitudes. The number in the lower left corner of each panel gives the range of the seasonal means in magnitudes; the number in the lower right corner gives the standard deviation of the seasonal means with respect to their grand mean, shown by the horizontal dotted line in each panel. The standard deviation of the observations is only 0.00038 mag, indicating that both comparison stars have excellent long-term photometric stability. Therefore, the short- and long-term variability evident in the and light curves must be intrinsic to HD 38529.

We see cyclic variation in both the H and K and APT observations plotted in Figure 6. Simple least-squares, sine-fit periodogram analyses of the H and K, , and means give periods of , , and years, respectively, all indentical within their uncertainties. Futhermore, the brightness of the star and the strength of the H and K emission vary directly in phase with each other. The cycle timescale and amplitudes of the H and K and photometric observations are typical of similar long-term cycles seen in a large sample of solar-type stars being measured with the APTs (see Henry, 1999; Lockwood et al., 2007; Hall et al., 2009) and are analogous to solar irradiance variations measured for over three decades with space-based radiometers (see, e.g., Watson & Hudson, 1981; Frohlich, 2012). The direct correlation of long-term brightness and magnetic activity in HD 38529 is in the same sense as the correlation between solar irradiance and S-index. Despite the similarities in age and spectral class of the Sun (4.6 Gyr, G2) and HD 38529 (4.4 Gyr, G5), the amplitudes of the S-index and brightness variability are larger in HD 38529 by factors of approximately 2 and 5, respectively (see, e.g. Lockwood et al., 2007, their Fig. 2). This is due to the fact that HD 38529 is a more massive, evolved subgiant (Table 1) with a deeper convection zone.
The radial velocity period of HD 38529c is 2134.9 days (Table 3) or 5.85 years, very close to the spot-cycle timescale of 6.2 years. This raises the question that the radial velocity variations attributed to HD 38529c may, instead, originate from the stellar magnetic cycle. As mentioned above, starspots in active stars have been found to induce radial velocity variations on stellar rotation timescales. Over the past 15 years or so, several authors have discussed the mechanisms by which long-term (decadal) magnetic cycles might be the source of long-term radial velocity variations (e.g., Saar & Donahue, 1997; Saar & Fischer, 2000; Santos et al., 2010). Recently, Lovis et al. (2011) analyzed a sample of 304 FGK stars from the HARPS high-precision planet-search sample, looking for possible correlations of stellar activity cycles with radial velocity and spectral line-shape parameters. They confirmed that stellar magnetic cycles can induce long-period, low-amplitude radial velocity variations with amplitudes up to 25 m s-1 in the more active stars. For HD 38529c, however, its radial velocity semi-amplitude of 171 m s-1 makes it immune to this type of false positive.
5. Conclusions
With the discovery of extrasolar planets, characterization has become an important pursuit and is intrinsically linked to the understanding of the host star properties. Thus, even relatively bright stars, such as HD 38529, are worthy of further scrutiny in order to gain insight into properties of the planets hosted by the star. Here we have performed just such a task by presenting the most accurate properties of the star HD 38529 so far produced. Direct measurements of stellar radii via interferometry provide an essential test of stellar models and validation of radii derived from spectroscopy. In this case, we measure a radius of 2.578 R⊙ for HD 38529, which is consistent with a slightly metal-rich mid-G sub-giant. The new RV data for the star are used to calculate a new Keplerian orbital solution for the system that enables us to place significant limits on a previously postulated third planet. Combining our mass estimate for the c component with the FGS astrometry of Benedict et al. (2010) allows us to confirm that this object does lie within the brown dwarf mass regime. The refined transit ephemeris from the Keplerian orbital solution is combined with 12 years of precision photometry to demonstrate the variability of the host star and the dispositive null detection of transits for HD 38529b. The importance of this study is clear since the combination and inter-dependence of all these effects leads to a greatly improved understanding of the system as a whole. The TERMS project is systematically proceeding to provide such characterization of the planetary systems known to orbit the brightest stars in the sky.
Acknowledgements
The Center for Exoplanets and Habitable Worlds is supported by the Pennsylvania State University, the Eberly College of Science, and the Pennsylvania Space Grant Consortium. S.R.K and N.R.H. acknowledge financial support from the National Science Foundation through grant AST-1109662. G.W.H. acknowledges support from NASA, NSF, Tennessee State University, and the State of Tennessee through its Centers of Excellence program. The HET is a joint project of the University of Texas at Austin, the Pennsylvania State University, Stanford University, Ludwig-Maximilians-Universität München, and Georg-August-Universität Göttingen. The HET is named in honor of its principal benefactors, William P. Hobby and Robert E. Eberly.
References
- Anglada-Escudé et al. (2010) Anglada-Escudé, G., López-Morales, M., Chambers, J.E., 2010, ApJ, 709, 168
- Argue (1966) Argue, A.N. 1966, MNRAS, 133, 475
- Baines et al. (2008) Baines, E.K., McAlister, H.A., ten Brummelaar, T.A., Turner, N.H., Sturmann, J., Sturmann, L., Goldfinger, P.J., Ridgway, S.T. 2008, ApJ, 680, 728
- Bakos et al. (2004) Bakos, G., Noyes, R.W., Kovács, G., Stanek, K.Z., Sasselov, D.D., Domsa, I. 2004, PASP, 116, 266
- Baliunas et al. (1995) Baliunas, S.L., et al. 1995, ApJ, 438, 269
- Baliunas et al. (1998) Baliunas, S.L., Donahue, R.A., Soon, W., Henry, G.W. 1998, in The 10th Cambridge Workshop on Cool Stars, Stellar Systems, and the Sun, ASP Conf. Ser. Vol. 154, eds. R. A. Donahue and J. A. Bookbinder (San Francisco: ASP), p. 153.
- Benedict et al. (2010) Benedict, G.F., McArthur, B.E., Bean, J.L., Barnes, R., Harrison, T.E., Hatzes, A., Martioli, E., Nelan, E.P., 2010, ApJ, 139, 1844
- Bodaghee et al. (2003) Bodaghee, A., Santos, N.C., Israelian, G., Mayor, M. 2003, A&A, 404, 715
- Boisse et al. (2012) Boisse, I., Bonfils, X., Santos, N.C. 2012, A&A, 545, A109
- Borucki et al. (2011a) Borucki, W.J., et al. 2011, ApJ, 728, 117
- Borucki et al. (2011b) Borucki, W.J., et al. 2011, ApJ, 736, 19
- Boyajian et al. (2012a) Boyajian, T.S., et al. 2012a, ApJ, 746, 101
- Boyajian et al. (2012b) Boyajian, T.S., et al. 2012b, ApJ, 757, 112
- Brugamyer et al. (2011) Brugamyer, E., Dodson-Robinson, S.E., Cochran, W.D., Sneden, C. 2011, ApJ, 738, 97
- Charbonneau et al. (2000) Charbonneau, D., Brown, T.M., Latham, D.W., Mayor, M. 2000, ApJ, 529, L45
- Claret (2000) Claret, A. 2000, A&A, 363, 1081
- Cousins (1962) Cousins, A.W.J. 1962, MNSSA, 21, 20
- Cutri et al. (2003) Cutri, R.M., et al. 2003, The IRSA 2MASS All-Sky Point Source Catalog, NASA/IPAC Infrared Science Archive
- Delgado Mena et al. (2010) Delgado Mena, E., Israelian, G., González Hernández, J.I., Bond, J.C., Santos, N.C., Udry, S., Mayor, M. 2010, ApJ, 725, 2349
- Demarque et al. (2004) Demarque, P., Woo., J., Kim, Y., Yi, S.K. 2004, ApJS, 155, 667
- Dragomir et al. (2012) Dragomir, D., et al. 2012, ApJ, 754, 37
- Eaton et al. (2003) Eaton, J.A., Henry, G.W., Fekel, F.C. 2003, in The Future of Small Telescopes in the New Millennium, Vol. II, The Telescopes We Use, ed. T. D. Oswalt (Dordrecht: Kluwer), 189
- Ecuvillon et al. (2006) Ecuvillon, A., Israelian, G., Santos, N.C., Mayor, M., Gilli, G. 2006, A&A, 449, 809
- Fischer et al. (2001) Fischer, D.A., Marcy, G.W., Butler, R.P., Vogt, S.S., Frink, S., Apps, K., 2001, ApJ, 551, 1107
- Fischer et al. (2003) Fischer, D.A., et al., 2003, ApJ, 586, 1394
- Frohlich (2012) Frohlich, C. 2012, Surv. Geophys., 33, 453
- Gilli et al. (2006) Gilli, G., Israelian, G., Ecuvillon, A., Santos, N.C., Mayor, M. 2006, A&A, 449, 723
- Golay (1972) Golay, M. 1972, Vistas Astron., 14, 13
- Gonzalez et al. (2001) Gonzalez, G., Brownlee, D., Ward, P. 2001, Icarus, 152, 185
- Hall et al. (2009) Hall, J.C., Henry, G.W., Lockwood, G.W., Skiff, B.A., Saar, S.H. 2009, AJ, 138, 312
- Hanbury Brown et al. (1974) Hanbury Brown, R., Davis, J., Lake, R.J.W., Thompson, R.J. 1974, MNRAS, 167, 475
- Hauck & Mermilliod (1998) Hauck, B., Mermilliod, M. 1998, A&AS, 129, 431
- Henry (1999) Henry, G.W., 1999, PASP, 111, 845
- Henry et al. (2000) Henry, G.W., Marcy, G.W., Butler, R.P., Vogt, S.S. 2000, ApJ, 529, L41
- Isaacson & Fischer (2010) Isaacson, H., Fischer, D. 2010, ApJ, 725, 875
- Johnson et al. (1966) Johnson, H.L., Mitchell, R.I., Iriarte, B., Wisniewski, W.Z. 1966, CoLPL, 4, 99
- Lockwood et al. (2007) Lockwood, G.W., Skiff, B.A., Henry, G.W., Henry, S.M., Radick, R.R., Baliunas, S.L., Donahue, R.A., Soon, W. 2007, ApJS, 171, 260
- Kane & von Braun (2008) Kane, S.R., von Braun, K. 2008, ApJ, 689, 492
- Kane et al. (2009) Kane, S.R., Mahadevan, S., von Braun, K., Laughlin, G., Ciardi, D.R. 2009, PASP, 121, 1386
- Kane & Gelino (2012) Kane, S.R., Gelino, D.M. 2012, PASP, 124, 323
- Kang et al. (2011) Kang, W., Lee, S-G., Kim, K-M. 2011, ApJ, 736, 87
- Lovis et al. (2011) Lovis, C., et al. 2011, A&A, submitted (arXiv:1107.5325)
- McClure & Forrester (1981) McClure, R.D., Forrester, W.T. 1981, PDAO, 15, 439
- Mermilliod (1986) Mermilliod, J.-C. 1986, Catalogue of Eggen’s UBV data
- Moutou et al. (2011) Moutou, C., et al. 2011, A&A, 533, A113
- Paulson et al. (2004) Paulson, D.B., Saar, S.H., Cochran, W.D., Henry, G.W. 2004, AJ, 127, 1644
- Petigura & Marcy (2011) Petigura, E.A., Marcy, G.W. 2011, ApJ, 735, 41
- Pickles (1998) Pickles, A.J. 1998, PASP, 110, 863
- Queloz et al. (2001) Queloz, D., et al. 2001, A&A, 379, 279
- Olsen (1993) Olsen, E.H. 1993, A&AS, 102, 89
- Pollacco et al. (2006) Pollacco, D.L., et al. 2006, PASP, 118, 1407
- Saar & Donahue (1997) Saar, S.H., Donahue, R.A. 1997, ApJ, 485, 319
- Saar & Fischer (2000) Saar, S.H., Fischer, D. 2000, ApJ, 534, L105
- Santos et al. (2010) Santos, N.C., da Silva, J.G., Lovis, C., Melo, C. 2010, A&A, 511, A54
- Simpson et al. (2010) Simpson, E.K., Baliunas, S.L., Henry, G.W., Watson, C.A. 2010, MNRAS, 408, 1666
- Sturmann et al. (2003) Sturmann, J., ten Brummelaar, T.A., Ridgway, S.T., Shure, M.A., Safizadeh, N., Sturmann, L., Turner, N.H., McAlister, H.A. 2003, SPIE, 4838, 1208
- Takeda et al. (2005) Takeda, Y., Hashimoto, O., Taguchi, H., Yoshioka, K., Takada-Hidai, M., Saito, Y., Honda, S. 2005, PASJ, 57, 751
- ten Brummelaar et al. (2005) ten Brummelaar, T.A., et al. 2005, ApJ, 628, 453
- Tull (1998) Tull, R.G. 1998, Proc. SPIE, 3355, 387
- Valenti & Piskunov (1996) Valenti, J.A., Piskunov, N. 1996, A&AS, 118, 595
- Valenti & Fischer (2005) Valenti, J.A., Fischer, D.A. 2005, ApJS, 159, 141
- Valenti et al. (2009) Valenti, J.A., et al. 2009, ApJ, 702, 989
- van Leeuwen (2007) van Leeuwen, F. 2007, A&A, 474, 653
- Vogt (1987) Vogt, S.S. 1987, PASP, 99, 1214
- Vogt et al. (1994) Vogt, S.S., et al. 1994, Proc. SPIE, 2198, 362
- von Braun et al. (2011a) von Braun, K., et al. 2011a, ApJ, 729, L26
- von Braun et al. (2011b) von Braun, K., et al. 2011b, ApJ, 740, 49
- von Braun et al. (2012) von Braun, K., et al. 2012, ApJ, 753, 171
- Wang et al. (2012) Wang, S.X., et al. 2012, ApJ, 761, 46
- Watson & Hudson (1981) Willson, R.C., Hudson, H.S. 1981, ApJ, 244, L185
- Wittenmyer et al. (2009) Wittenmyer, R.A., Endl, M., Cochran, W.D., Levison, H.F., Henry, G.W. 2009, ApJS, 182, 97
- Wright et al. (2004) Wright, J.T., Marcy, G.W., Butler, R.P., Vogt, S.S. 2004, ApJS, 152, 261
- Wright & Howard (2009) Wright, J.T., Howard, A.W. 2009, ApJS, 182, 205
- Wright et al. (2009) Wright, J.T., Upadhyay, S., Marcy, G.W., Fischer, D.A., Ford, E.B., Johnson, J.A. 2009, ApJ, 693, 1084
- Zhao et al. (2002) Zhao, G., Chen, Y.Q., Qiu, H.M., Li, Z.W. 2002, AJ, 124, 2224