RXTE and Swift observations of SWIFT J1729.93437
Abstract
We analyse RXTE and Swift observations of SWIFT J1729.93437 after its outburst from 2010 July 20 to 2010 August 12. We calculate a spin frequency and spin frequency derivative of Hz and Hz/s respectively from the quadratic fit of the pulse arrival times.The quadratic fit residuals fit well to a circular orbital model with a period of days and a mass function of about , but they can also be explained by a torque noise strength of Hz sec-2. Pulse profiles switch from double-peaked to single-peaked as the source flux continues to decrease. We find that the pulse shape generally shows no strong energy dependence. The hardness ratios reveal that the source becomes softer with decreasing flux. We construct a single spectrum from all the available RXTE and Swift observations. We find that adding an Fe line complex feature around 6.51 keV slightly improves the spectral fit. We also find that Fe line flux correlates with X-ray flux which might indicate the origin of the Fe emission as the source itself rather than the Galactic ridge.
keywords:
accretion, accretion discs - stars:neutron - pulsars:individual: SWIFT J1729.9-34371 Introduction
SWIFT J1729.93437 is a transient X-ray pulsar discovered during all-sky monitoring with the Swift Burst Alert Telescope (BAT) on 2010 July 13 (Markwardt et al. 2010a). At the same time, Rossi X-ray Timing Explorer (RXTE) Proportional Counter Array (PCA) monitoring scans of the Galactic centre region confirmed a gradual increase in flux from a position consistent with the Swift position of the source (RA = 262.53746, Dec. = 34.61239). Consecutive RXTEPCA pointings identified SWIFT J1729.93437 as a pulsar with 530 s pulsations (Markwardt et al. 2010b). Markwardt et al.(2010b) also suggested that the X-ray spectrum of the source is compatible with basic X-ray pulsar spectra, modelled by an absorbed power law with a high energy cut-off.
In this paper, we analyse RXTE and Swift observations of SWIFT J1729.93437 and examine the spectral and timing properties of its outburst from 2010 July 20 to 2010 August 12 (MJD 55397 MJD 55420). In Section 2, we describe the observations that we analyse. In Section 3 and 4, we present our timing and spectral analysis results. In Section 5, we discuss our results and conclude.
2 Observations
2.1 RXTE
11 pointing RXTEPCA observations of SWIFT J1729.93437 were performed between 2010 July 20 and 2010 August 8. The total exposure time is about 42 ks. PCA consisted of five co-aligned identical proportional counter units (PCUs) (Jahoda et al. 1996) each having an effective area of approximately 1300 . The energy range of PCA was from 2 to 60 keV, with an energy resolution of 18 per cent at 6 keV. The field of view (FOV) at full width at half-maximum (FWHM) was about 1. Generally, various PCUs were turned off during PCA observations. The responses of PCU0 and PCU1 were not well known due to loss of their propane layers. Furthermore, the responses of the top anode layers were modeled better than the other layers. Although the number of active PCUs during the observations of SWIFT J1729.93437 varied between one and three, we select only data from the top anode layer of PCU2 because of the reasons mentioned above.
The standard software tools of HEASOFT v.6.11 are used for the PCA data analysis. Data is filtered by selecting times
when the elevation angle is greater than 10, the offset from the source is less than 0.02 and the electron
contamination of PCU2 is less than 0.1. The background extraction for spectra and light curves are done by using the latest
PCA background estimator models supplied by the RXTE Guest Observer Facility (GOF), EPOCH 5C. During the extraction
of spectra, Standard2f mode data is considered with 128 energy channels and 16-s time resolution. Relevant response matrices
for spectra are created by PCARSP V.11.7.1. Furthermore we construct pulse phase resolved spectra with the tool
FASEBIN Rev.1.8 by using Good Xenon mode event data and 125 s time resolution event files
(E_125us_64M_0_1s) when Good Xenon mode data is not available. From these spectra, we generate energy resolved pulse
profiles by obtaining the count rates per phase bin with the tool FBSSUM. The 1 s binned 3-20 keV light curves are
produced from Good Xenon and E_125us_64M_0_1s events.
2.2 SWIFT
After the discovery of SWIFT J1729.93437 by the SwiftBAT (Barthelmy et al. 2005) all-sky monitoring on 2010
July 13 (Markwardt et al. 2010a), a total of 11 follow-up X-ray Telescope (XRT; Burrows et al. 2005) observations
(each 3 ks) were carried out between 2010 July 20 and 2010 August 12. XRT is a focusing instrument on board the
Swift satellite (Gehrels et al. 2004) which operates between 0.2 and 10 keV energy range. XRT has an effective area
of 110 at 1.5 keV with a spatial resolution of 18 and the FOV of .
Operation mode of XRT switches between photon-counting (PC), imaging and timing depending on the brightness of the observed
source. Pointing observations of SWIFT J1729.93437 are in the PC mode. Screened event files are produced by the
XRTDAS v.2.7.0 standard data pipeline package XRTPIPELINE v.0.12.6. Standard grade filtering (0-12) is applied
to PC mode data.
The spectral extraction is carried out by filtering appropriate regions using XSELECT v.2.4b. For the observations
in which the XRT count rate is high enough (above 0.5 cts/s) to produce event pile-up, source region is selected to be
annular. We compared the observed and nominal point spread function (PSF) (Vaughan et al. 2006) and decided the size of
the core affected in order to determine the radius of the inner circle of the annulus. For this purpose, we first modelled
the outer wings () of the PSF with a King function which has typical parameter values for XRT
(Moretti et al. 2005). Then the model is extrapolated to the inner region for comparison with the observed PSF and the size
of the piled-up region is determined from the deviation point between the data and the model. For the brightest observations
an exclusion region of radius is sufficient to correct pile-up. For low count rate observations a circular
region of radius 47 is selected for the source spectral extraction. Source regions are centred on the position
determined with XRTCENTROID v.0.2.9. A circular source-free region with 140 radius is selected for the
background spectral extraction. Resulting spectral files are grouped to require at least 50 counts per bin using the ftool
GRPPHA v.3.0.1, for the statistics to be applicable. We used the latest response matrix file (version v013)
and created individual ancillary response files using the tool XRTMKARF v.0.5.9 with the exposure map produced by
XRTEXPOMAP v.0.2.7. Spectral analysis is performed using XSPEC v.12.7.0.
For the timing analysis, arrival times of XRT events are first corrected to the Solar system barycenter by using the tool
BARYCORR v.1.11. Then, background-subtracted XRT light curves in the 0.210 keV energy range; corrected for pile-up,
PSF losses and vignetting; are extracted by using the highest possible time resolution (2.51 s) for PC mode data.
3 Timing Analysis
3.1 Timing Solution

For the timing analysis, we use 1 s binned RXTEPCA and 2.51 s binned SwiftXRT light curves of the source. To illustrate the temporal variation of the pulse phase averaged count rate of the source, in Fig. 1, we present 530 s binned versions of these light curves. These background subtracted light curves are also corrected to the barycenter of the Solar system.
In order to estimate pulse periods of the source, the RXTEPCA time series is folded on statistically independent trial periods (Leahy et al. 1983). Template pulse profiles are formed from these observations by folding the data on the period giving maximum . Then the barycentred SwiftXRT time series are also folded over the best period obtained from RXTE. Pulse profiles consisting of 20 phase bins are represented by their Fourier harmonics (Deeter & Boynton 1985). Using cross-correlation of pulses between template and in each observation, we obtain the pulse arrival times.
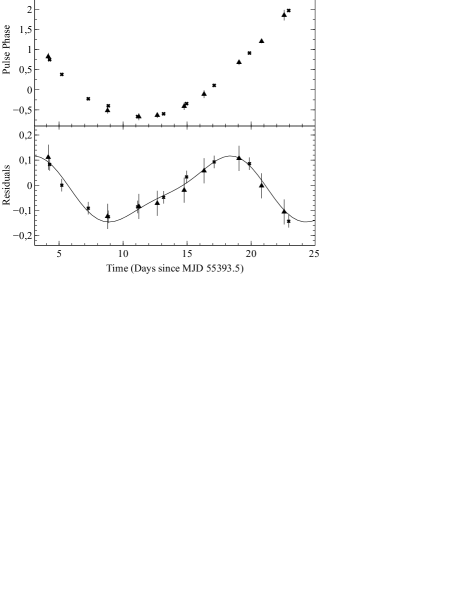
We are able to connect all the pulse arrival times of the observations in phase over the whole observation time span. Following the approach of Deeter et al. (1981), we find that it is possible to fit the pulse arrival times to the second order polynomial,
| (1) |
where is the pulse phase offset found from the pulse timing analysis, is the epoch for folding; is the residual phase offset at to; is the correction to the pulse frequency at time ; , being the pulse frequency derivative, is the second derivative of the pulse phase. In Fig. 2, we present the pulse phases and the residuals of this quadratic fit.
In Fig. 3, we show typical SwiftXRT and RXTEPCA pulse profiles. As seen from this figure, the Swift pulse has larger error bars and less signal to noise ratio relative to the RXTE pulse. In the pulse timing analysis we find that the error bars of the pulse phases of RXTE and Swift are inversely correlated with the signal to noise ratio of the pulses of each observation.
| Timing Solution Parameter | Value |
|---|---|
| Timing Epoch (MJD) | |
| Frequency (Hz) | |
| Frequency Derivative (Hz.s-1) | |
| Circular Orbital Model Parameter | Value |
| Orbital Epoch (MJD) | |
| (lt.s) | |
| Orbital Period (days) |
The residuals shown in Fig. 2 fit well to a sinusoidal function with a period of 15.3(2) days. This corresponds to a circular orbital model, parameters of which are listed in Table 1. This circular model has a reduced of 1.0. Using an elliptical model we find an upper limit for the eccentricity as 0.6 (see bottom panel of Fig. 2). In this case, reduced is found to be 0.4. This small reduced value indicates that the elliptical orbital model ”over-fits” data.
The residuals of the quadratic can alternatively express the noise process due to random torque fluctuations (Bildsten et al. 1997, Baykal et al. 2007). In order to estimate the noise strength, we fit a cubic polynomial to the residuals of the pulse arrival times. The observed time series is simulated by the Monte Carlo technique for a unit white noise strength defined as and fitted to a cubic polynomial in time. Then the square of the third order polynomial term is divided into the value from Monte Carlo simulations (Deeter 1984, Cordes 1980). The torque noise strength is obtained as Hz sec-2. This value of noise strength estimate is comparable with those of other accretion powered sources such as wind accretors e.g. Vela X1, 4U 153852 and GX 3012 which has the values changing between and Hz s-2 (Bildsten et al. 1997). Her X1 and 4U 162667, which are disc accretors with low mass companions, have shown pulse frequency derivatives consistent with noise strengths to Hz sec-2 (Bildsten et al. 1997). Therefore residuals of quadratic fit can also be associated with torque noise fluctuation of the source.
3.2 Pulse Profiles and Hardness Ratios

A double-peaked pulse profile is observed in the first five RXTEPCA observations of SWIFT J1729.93437 (see panel (A) of Fig. 4); however one peak loses its intensity starting from the middle of the observation on MJD 55406.7 (see panel (B) Fig. 4) as the source flux continues to decrease after the burst. The peak value of 210 keV unabsorbed flux is erg cms-1 on MJD 55398.7, during its gradual decrease it reaches erg cms-1 on MJD 55408.5, when the shape of the pulse profile changes (see panel (C) Fig. 4). The minimum flux observed for the last RXTEPCA observation on MJD 55416.4 is erg cms-1. These flux values are calculated from the model flux of individual spectral fitting of each observation.


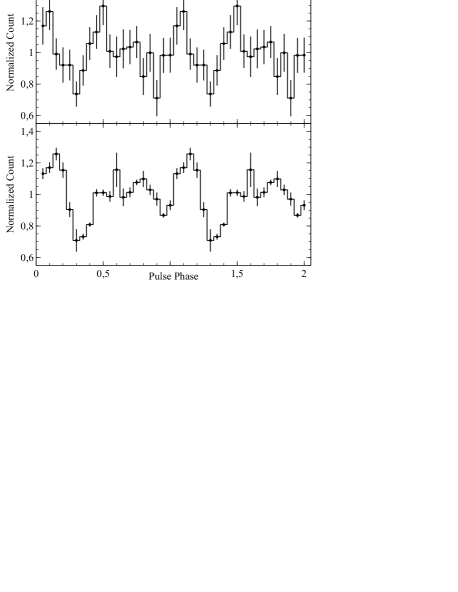
To search for a possible energy dependence of the pulse shape change, we construct pulse profiles in five energy bands, i.e. 38, 813, 1318, 1825 and 2560 keV. Two examples for the energy resolved pulse profiles, one for double-peaked and one for single-peaked, are given in Fig. 5. We find that 813 keV and 1318 keV pulses are stronger (they have higher pulse fraction) than the 38 keV and 1825 keV pulses in all observations. In 2560 keV the pulse fraction noticeably drops. The pulse shape shows no strong energy dependence except for the two observations on MJD 55400.78 (ID:95044-05-02-00 see Fig. 5) and MJD 55404.63 (ID:95044-05-02-02). In these two exceptions the secondary peak around pulse phase 0.3 loses its intensity at the 1825 keV energy band.


We construct hardness ratio plots from the energy resolved light curves. Daily averaged count rates from 38, 813, 1318 and 1825 keV light curves are used to plot hardness ratios HR1: 813 keV/38 keV and HR2: 1825 keV/1318 keV over time (see left panels of Fig. 6). HR1 shows a noticeable evolution with respect to time, it remains almost constant at a value until MJD 55406.7 and a gradual decrease starts after the sixth observation. The interval with constant HR1 correspond to times when the pulse profile is double-peaked, where as the decreasing interval of HR1 coincides with the times when the pulse profile is single-peaked. Nevertheless, it should be noted that the pulse profiles show no significant variation in the corresponding energy bands (see Fig. 5). Furthermore, 530 s binned hardness ratios are plotted over the total count rate in 325 keV band (see right panels of Fig. 6). A noticeable correlation is again observed for HR1. As the source flux decreases during the ongoing decline of the outburst, the emitted radiation becomes softer.
4 Spectral Analysis
4.1 Overall Spectrum
| Parameter | Value | |
| for XRT | 1.00 (fixed) | |
| for PCA | ||
| cm | ||
| Norm. | (cts cms-1) | |
| (keV) | ||
| (keV) | ||
| (keV) | ||
| Norm. | (cts cms-1) | |
| Unabs. | erg cms | |
| Unabs. | erg cms | |
| Reduced (dof) | 1.09 (187) |
A preliminary spectral analysis for the first pointed observations of SWIFT J1729.93437 was performed by Markwardt
et al. (2010b). In this paper, we extend the spectral study by using all the available observations of the source defined
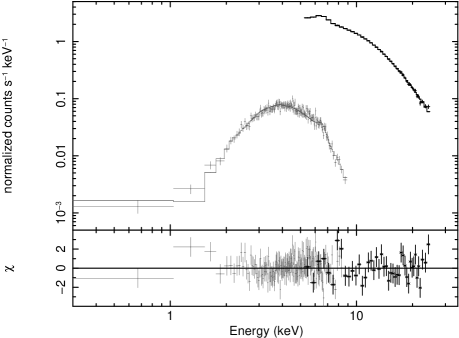
in Section 2. Basically, the spectra can be modelled by a power law with a high energy cut-off and photoelectric absorption
as it is suggested by Markwardt et al. (2010b). Among the several models that describe the cut-off power law, the best fit
is achieved by CUTOFFPL model in XSPEC. An additional Gaussian component is also required for a weak Fe
emission line around 6.4 keV. During the simultaneous fitting of SwiftXRT and RXTEPCA spectra we included
a multiplicative constant factor in the model to account for the normalization uncertainty between the two instruments. The
data and its best fit are plotted in Fig. 7 and the corresponding spectral parameters are given in
Table 2.
The energy ranges for the simultaneous spectral analysis are initially selected to be 0.39.3 keV for the XRT spectrum and 325 keV for the PCA spectrum. Individually these spectra have similar shapes that can be modelled with the same models, apart from an offset in absolute flux calibration. However individual modelling of the data from different instruments yields different absorption parameters due to different instrumental band-passes (Markwardt et al. 2010b). During the simultaneous fitting trials we observe large residuals for the first energy bins of the PCA spectrum although the fit is adequate for the XRT spectrum. Therefore we exclude energies below 5 keV for the PCA spectrum, since the XRT spectrum has more spectral energy bins in soft X-rays.
The FOV of PCA is large and SWIFT J1729.93437 is near the Galactic ridge. The thermal emission from the ridge is usually known to contaminate the spectral count rates of the source. During the analysis of the first PCA observation, the weak line at 6.6 keV reported by Markwardt et al. (2010b) was suggested to be a contamination, since it could not be resolved in the spectrum of the first XRT observation. We tried to handle this issue in overall PCA spectrum with fixed additive Galactic ridge models. We confirm that the flux of the source is two orders of magnitude bigger than the flux of the Galactic ridge (Valinia & Marshall 1998) therefore we conclude that the contamination could be small enough to be neglected. Furthermore; addition of the Gaussian model component for the Fe line improves the individual fit of the 0.39.3 keV XRT spectrum after combining data from all XRT observations by reducing the reduced from 1.08 (d.o.f. ) to 0.98 (d.o.f. ). The F-test probability that this improvement is achieved just by chance is . Therefore we suggest that the Fe emission originates from SWIFT J1729.93437. The line energy found for the source is shifted from the neutral value of Fe K (6.4 keV), which may be a consequence of an excess of ionization.

In accretion powered pulsars, the Fe K line is produced by the reprocessing of the hard X-ray emission in the
relatively low ionized and cool matter surrounding the pulsar. The correlation of the iron line intensity and the continuum
intensity in many sources (e.g. Vela X1: Ohashi et al 1984, GX 3012: Leahy et al. 1989) is specified to be the evidence
for the fluorescence of X-ray continuum by the cold material. As the continuum intensity increases the illumination of the
matter increases and the line intensity strengthens. We measure Fe line flux values from the individual RXTE
observations of SWIFT J1729.93437 by using the CFLUX model in XSPEC and find that they correlate with the
source flux values (see Fig. 8). In Fig. 8 the dotted line represents the linear fits to the data, with a
slope of . The Pearson product-moment correlation coefficient between Fe line flux and unabsorbed source
flux at 210 keV is 0.96. The null-hypothesis probability calculated from the Student’s t-distribution (two-tailed) is
. This correlation also confirms the origin of the Fe emission.
4.2 Pulse Phase Resolved Spectra
We construct pulse phase resolved spectra of SWIFT J1729.93437 from the first three RXTEPCA observations. There are
two motivations to the data selection. First, the brightest of the observations are selected to ensure the best
signal-to-noise ratio possible. Second, the selected observations are the only ones that have 256 channels Good Xenon event
mode data available, which is required for the FASEBIN tool. The timing solution found for the source in Section 3.1
is appended to the timing files of the FASEBIN tool for correct phase-binning. The pulse period is divided into five
equal segments resulting in 2.1 ks exposure time for each phase bin spectrum.
We model 325 keV spectra with the same models used for the overall spectrum in the previous section. As we do not observe any significant change in the Hydrogen column density () and the Fe line energy during the preliminary fitting trials, we fixed these parameters during the analysis in order to better constrain the other parameters of the fits. The photon index and the folding energy of the high energy cut-off () are found to be varying within pulse phases (see Fig. 9). The phase dependence of photon index is in anti-correlation with the pulsed flux. The Pearson product-moment correlation coefficient between pulsed flux and photon index values is and the corresponding null-hypothesis probability (two-tailed) is 0.06. The null-hypothesis probability of this anti-correlation is quite significant but our results still indicate that the softest emission is observed at the un-pulsed phase around 0.05; from which we might suggest a possible physical relation between the parameters. The values show a similar trend as the photon index values, which means softer spectra have higher cut-off energies. The Pearson product-moment correlation coefficient between and photon index values is 0.96 and the corresponding null-hypothesis probability (two-tailed) is 0.01. Although the correlation analysis indicates a strong dependence between the parameters, one should note that the uncertainties in the parameters are not taken into account during this analysis. When the large uncertainties in values are taken into account the data is consistent with a constant value of keV. Therefore it is difficult to infer a clear variation of the with the pulse phase, suggesting a rather marginal detection.

5 Summary and Discussion
In this paper, we study timing and spectral properties of SWIFT J1729.93437 using RXTE and Swift observations of its outburst from 2010 July 20 through 2010 August 12 (MJD 55397 MJD 55420). From these observations with a time span of days, we find that arrival times can be fit to a quadratic. From this fit, we calculate a spin frequency and spin frequency derivative of Hz and Hz/s respectively. The residuals of the quadratic is further found to fit a circular orbital model with lt.s and an orbital period of 15.3(2) days. We also try an elliptical model and find an upper limit for eccentricity as 0.60. However, this model over-fits the data with a reduced of 0.40. Future observations might help to refine orbital parameters of the source.
Using this value, we find the mass function () to be about . An orbital period of 15.3 days and a spin period of 533.76 s puts the source in line with the accretion powered pulsars with supergiant companions, in the Corbet diagram (Drave et al. 2012, Corbet 1984). On the other hand, the small mass function obtained from the circular orbital model should be an indication of a small orbital inclination angle. If the circular orbital model is preferred as the model fitting the residuals of the quadratic fit, this indicates that we observe the binary system nearly edge-on.
Alternatively the residuals of the quadratic fit can be explained by a torque noise strength of Hz sec-2. This value is quite consistent with other accreting X-ray binaries (Baykal & Ögelman 1993, Bildsten et al. 1997). Future observations are needed to understand the exact nature of the source.
Initially, a double-peaked pulse profile is observed in the light curves of the source. Then we find that one peak loses its intensity starting from the middle of the observation on MJD 55406.7 as the source flux continues to decrease after the burst. To study the energy dependence and temporal variability of the pulse profiles, we construct pulse profiles with five different energy bands shown in Fig. 5. We observe stronger pulses in the 813 keV and 1318 keV energy bands but generally the pulse shape shows no strong energy dependence. Double to single peak transition seen in this source might be due to a sharp decline in the intensity of the radiation coming from the fan beam, since the formation of fan beam strongly depends on the luminosity of the source as for EXO 2030+375 (Parmar et al. 1989) and GX 1+4 (Paul et al. 1997). However lack of significant energy dependence of the pulse profiles makes the fan beam explanation implausible since fan beams are expected to be spectrally harder than pencil beams.
In order to have a basic understanding of spectral variability of the whole observations, we study hardness ratios of the source. From the hardness ratio plots (see Fig. 6), we suggest that the emitted radiation becomes softer as the source flux decreases during the ongoing decline of the outburst. The similar spectral softening with decreasing flux was reported before for 1A 0535+262, A 1118616, SWIFT J1626.65156, XTE J0658073 and GRO J100857 using hardness-intensity relations (Reig & Nespoli, 2013).
To extend the preliminary spectral analysis of Markwardt et al. (2010b), we also construct a single spectrum from all the available RXTE and Swift observations (see Fig. 7 and Table 2). We find that adding an Fe line complex feature with a peak at 6.51 keV slightly improves the spectral fit. We discuss that this Fe line feature is more likely originated from the source as the galactic ridge emission is too weak to explain this emission alone. We also measure Fe line flux values from the individual RXTE observations of the source and find that they correlate with the source flux values (see Fig. 8). This correlation confirms the origin of the Fe emission as the source itself rather than the galactic ridge.
We perform pulse phase resolved spectral analysis of the source using the first three RXTE observations. From this analysis, we find a marginal evidence of a variation of the photon index and the folding energy of the high energy cut-off with the pulse phase (see Fig. 9).
Acknowledgements
We acknowledge support from TÜBİTAK, the Scientific and Technological Research Council of Turkey through the research project TBAG 109T748.
References
- [1] Barthelmy S. D., Barbier L. M., Cummings J. R. et al., 2005, Space Sci. Rev., 120, 143
- [2] Baykal A., İnam S. Ç., Stark M. J., Heffner C. M., Erkoca A. E., Swank J. H., 2007, MNRAS, 374, 1108
- [3] Baykal, A.; Ögelman, H., 1993, A&A, 267, 119
- [4] Bildsten L. et al., 1997, ApJS, 113, 367
- [5] Burrows D. N., Hill J. E., Nousek J. A. et al., 2005, Space Sci. Rev., 120, 165
- [6] Corbet R. H. D., 1984, A&A, 141, 91
- [7] Cordes J. M., 1980, ApJ, 237, 216
- [8] Deeter J. E., Boynton P. E., Pravdo S. H., 1981, ApJ, 247, 1003
- [9] Deeter J. E., 1984, ApJ, 281, 482
- [10] Deeter J. E., Boynton P. E., 1985, in Hayakawa S., Nagase F., eds, Proc. Inuyama Workshop: Timing Studies of X-Ray Sources. Nagoya Univ., Nagoya, p. 29
- [11] Drave S.P., Bird A.J., Townsend L.J., Hill A.B., McBride V.A., Sguera V., Bazzano A., Clark D.J., 2012, A&A, 539, 21
- [12] Gehrels N., Chincarini G., Giommi P. et al., 2004, ApJ, 611, 1005
- [13] Jahoda K., Swank J. H., Giles A. B., Stark M. J., Strohmayer T., Zhang W., Morgan E. H., 1996, Proc. SPIE, 2808, 59
- [14] Leahy D. A., Darbro W., Elsner R. F., Weisskopf M. C., Kahn S., Sutherland P. G., Grindlay J. E., 1983, ApJ, 266, 160
- [15] Leahy D. A., Matsuoka M., Kawai N. and Makino F., 1989, MNRAS, 236, 603
- [16] Markwardt C. B., Krimm H. A., Swank J. H., 2010a, Atel 2747
- [17] Markwardt C. B., Krimm H. A., Swank J. H., 2010b, Atel 2749
- [18] Moretti A., Campana S., Mineo, T. et al., 2005, SPIE, 5898, 360
- [19] Ohashi T., Inoue H., Koyama K. et al., 1984, PASJ, 36, 699
- [20] Parmar A.N., White N.E., Stella L., 1989, ApJ, 338, 373
- [21] Paul B., Agrawal P.C., Rao A.R., Manchanda R.K., 1997, A&A, 319, 507
- [22] Reig P., Nespoli E., 2013, A&A, 551, A1
- [23] Valinia A., Marshall F. E., 1998, ApJ, 505, 134
- [24] Vaughan S., Goad M. R., Beardmore A. P. et al., 2006, ApJ, 638, 920