Soliton dynamics in the multiphoton plasma regime
Solitary waves have consistently captured the imagination of scientists, ranging from fundamental breakthroughs in spectroscopy and metrology enabled by supercontinuum light, to gap solitons for dispersionless slow-light, and discrete spatial solitons in lattices, amongst others. Recent progress in strong-field atomic physics include impressive demonstrations of attosecond pulses and high-harmonic generation via photoionization of free-electrons in gases at extreme intensities of 1014 W/cm2. Here we report the first phase-resolved observations of femtosecond optical solitons in a semiconductor microchip, with multiphoton ionization at picojoule energies and 1010 W/cm2 intensities. The dramatic nonlinearity leads to picojoule observations of free-electron-induced blue-shift at 1016 cm-3 carrier densities and self-chirped femtosecond soliton acceleration. Furthermore, we evidence the time-gated dynamics of soliton splitting on-chip, and the suppression of soliton recurrence due to fast free-electron dynamics. These observations in the highly dispersive slow-light media reveal a rich set of physics governing ultralow-power nonlinear photon-plasma dynamics.
I Introduction
Recent advances in nonlinear optics have seen rapid developments spanning from single cycle plasma interactions goulielmakis2008single , chip-scale parametric frequency conversion combReview ; osgood_midIR ; corcoranTHG , to slow-light enhanced nonlinearities eggletonNaturePhysics2006 ; baba_nature2008 , discrete spatial solitonsfleischer2003 , and temporal cloaking fridman2012 in the past few years. Solitons are a special class of nonlinear waves arising from the interplay of dispersion and nonlinear effects dauxoisBook ; ilan2010band ; kivsharBook . Soliton-based phenomena give rise to optical rogue waves jalaliNature07 , pulse compression gaetaScience03 , Raman-dispersive wave interaction skryabin2003soliton , self-similarity dudleyNP2007 , and supercontinuum optical sources, enabling key applications in spectroscopy and metrology dudleyRMP .
In parallel to these developments, strong-field atomic physicists have adopted concepts from the plasma community, leading to powerful physical insight and subsequent demonstrations of attosecond pulses and high-harmonic generation via photoionization of free-electrons in gases goulielmakis2008single ; macklin1993high ; corkum1993plasma . Many of these experiments focus on the tunneling regime of atomic gases macklin1993high ; goulielmakis2008single ; DiMauroNP2010 with guided wave tunnel ionization of noble species only recently demonstrated holzer2011ionization ; fedotov2007ionization . Exploration of the complementary process of multiphoton plasma generation often involves ultraviolet and extreme ultraviolet sources with complex detection schemes goulielmakis2008single ; mcpherson1987studies . These experiments, moreover, typically occur at 1014 W/cm2 intensity levels for sub-100 fs pulses.
The semiconductor chip-scale platform alternatively presents large nonlinearities along with strong field localization to enable record low power observations and scalable optoelectronic integration. Recent efforts on ultrafast pulses in microchip devices include the first temporal measurements of solitons on-chip colman2010 ; tanNComms2010 , inferred indirectly through intrinsically-symmetric intensity correlations karle2011direct or estimated from spectral measurements ding2010time .
Here we report the first phase-resolved spectroscopy of ultrafast optical solitons in slow-light photonic crystals. The optically-gated spectrograms evidence the first observations of: (1) chip-scale dynamical soliton pulse splitting with temporally-flat phase, (2) self-induced pulse acceleration due to multiphoton carrier plasma and non-adiabatic chirp, and (3) suppression of soliton recurrence due to fast free-electron dynamics in our GaInP media. The strong light confinement and light-matter interaction enable the observations at 10 pJ and picosecond pulses, yielding 1010 W/cm2 intensities, in a 1.5-mm photonic lattice. The novel coupled soliton-plasma dynamics in the semiconductor are rigorously examined in a modified nonlinear Schrödinger framework including auxiliary carrier evolution, providing strong agreement based on experimentally measured parameters without any fitting. The observations are described by uniting concepts of ultrafast nonlinear solitons, high-field atomic physics, and semiconductor physics. Twelve sets of dispersive propagation conditions are characterized and a scaling law derived for soliton compression on-chip, incorporating Kerr, three-photon absorption and free carrier nonlinearities, and slow-light dispersive characteristics. A minimum pulse duration of 440 fs is achieved in our higher-order soliton compression with a 20.1 pJ, 2.3 ps input pulse, exhibiting a precise phase balance between slow-light-enhanced Kerr self-phase modulation and strong group velocity dispersion in our microchip. Beyond these measurements, our approach provides an exploration into a new regime of light-plasma interaction.
II Soliton dynamics in the multiphoton plasma regime
II.1 Sample group velocity dispersion and frequency-resolved optical gating
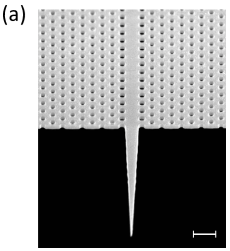
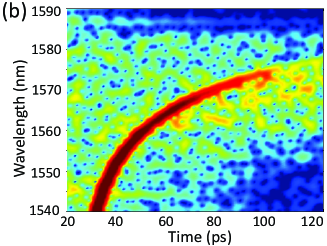
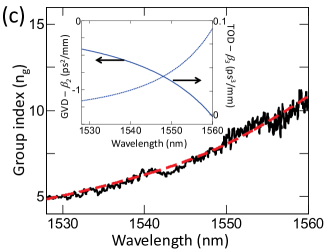
Figure 1(a) illustrates the GaInP photonic crystal membranes examined, with a hexagonal lattice constant a of 475 nm, 0.18a hole radius and a 195 nm thickness, and a line-defect dielectric that forms the photonic crystal waveguide. The dispersion is engineered by tuning the innermost hole radii to 0.21a. The 1.5-mm photonic crystal waveguide includes integrated mode-adapters tranAPL09 to reduce the total input-output chip insertion losses to 13 dB and suppress facet Fabry-Perot oscillations (see Supplementary Information). Figure 1(b) indicates the waveguide dispersion properties measured via the phase-shift method. Figure 1(c) shows the group index, , increasing from 5 to 12 in the range of interest. The dashed line indicates band structure calculations employed to compute the dispersion and modal area mpbCode . Figure 1(c)(inset) shows the group-velocity dispersion (GVD, ) and third-order dispersion () coefficients of the device. The group velocity dispersion is anomalous and on the order of ps2/mm across the range of interest. We emphasize third-order dispersion plays a negligible role here, and is included for completeness. The GaInP material selection has negligible red-shift Raman effects in contrast to solitons in amorphous materials such as glass. Moreover, in contrast to nonlinear waves in silicon tanNComms2010 ; ding2010time ; zhang2007optical ; monat2009 where two-photon absorption greatly restricts the full range of dynamics, GaInP has a large 1.9-eV band gap to completely suppress any two-photon absorption (of 1550-nm photons) and has negligible residual effects from band tail absorption husko2009_OptExp . The three-photon GaInP material employed combrie2009 enables the fine balance between the soliton propagation and plasma regimes.
Photo-induced plasmas are characterized by the Keldysh parameter, , where is the ionization potential and the ponderomotive energy keldysh1965ionization . defines the multiphoton regime, whereas corresponds to a tunneling dominated process. In the experiments presented here 5 - 6, well into the multiphoton plasma regime. This is largely due to the four orders of magnitude reduced intensities (1010 W/cm2) required to ionize the semiconductor media compared to gases (1014 W/cm2) macklin1993high ; goulielmakis2008single ; DiMauroNP2010 ; holzer2011ionization ; fedotov2007ionization .
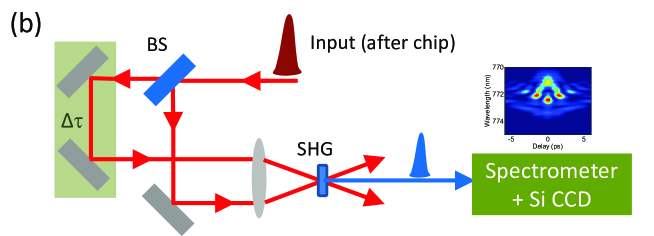
For ultrashort pulse characterization we constructed a 25 fJ phase-sensitive second-harmonic-generation (SHG) FROG apparatus (see Methods). Frequency-resolved optical gating (FROG) trebinoBook ; thesisXing or spectral-phase interferometry pasquaziNP2011 enables the complete pulse intensity and phase retrieval in both spectral and temporal domains, covering supercontinuum dudleyRMP and attosecond DiMauroNP2010 ; mairesse2005atto pulse regimes. In order to guarantee fidelity of the pulses collected off-chip, our experiments with the cryogenic detectors exclude erbium-doped fiber amplifiers and are externally intensity-attenuated to avoid any modification of the pulse properties.
II.2 Soliton dynamics in the presence of plasma: acceleration and temporal splitting
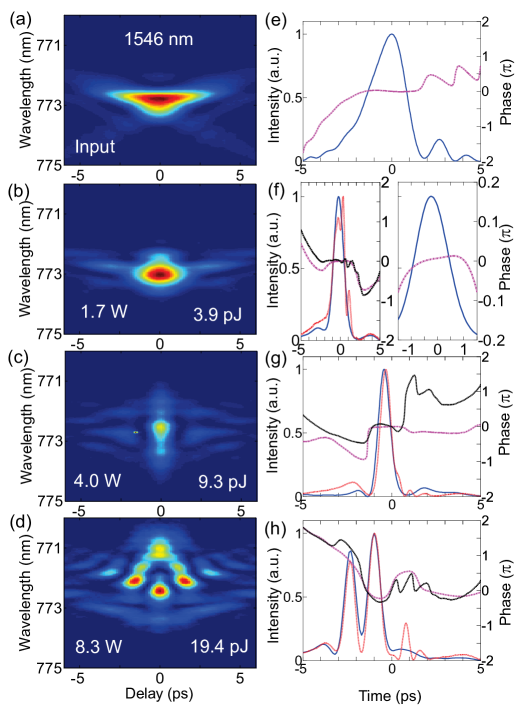
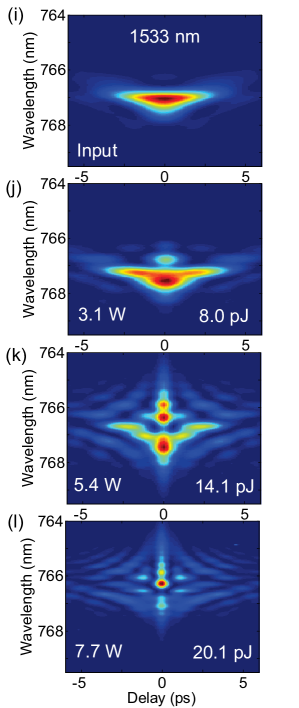
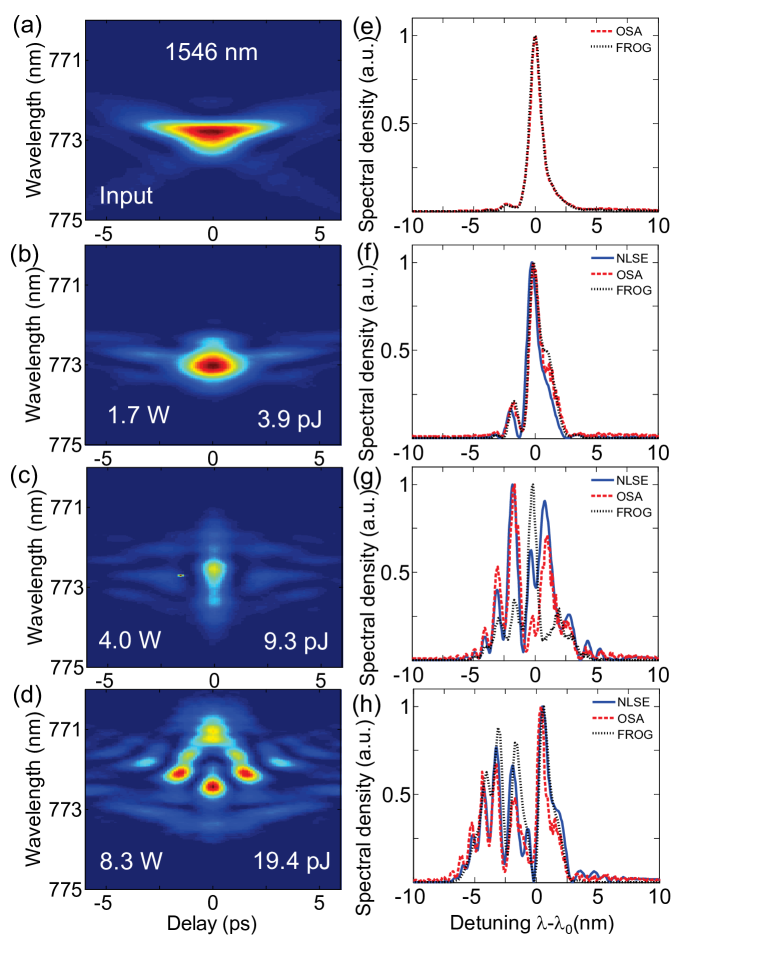
First we characterized the pulse evolution in the waveguide with FROG as a function of input pulse energy for a broad array of dispersion and nonlinear properties. We highlight three cases demonstrating the unique aspects of nonlinear pulse evolution. We first focus on the 1546 nm case ( = 7.2, = -0.75 ps2/mm), near the band edge, which exhibits the greatest diversity of nonlinear pulse dynamics. Figs. 2 (a)-(d) show experimental FROG traces of the input pulse and at three different pulse energies. Figs. 2 (e)-(h) immediately to the right are the retrieved temporal intensity (solid blue) and phase (dashed magenta) of the FROG traces, with retrieved optical gating errors less than 0.005 in all cases demonstrated (see Methods). Fig. 2(i)-(l) are the corresponding 2D spectrograms for pulse centered at 1533.5 nm. The spectral properties exhibit higher-frequency components generated by the free-electrons. Fig. 2(f) shows the maximum temporal compression to 770 fs at 1546 nm (compression factor . The right panel shows a magnified view of the output pulse phase which illustrates the phase is flat and uniform within 0.1 radians or less, confirming for the first time the presence of the chip-scale optical soliton with its phase in the highly-dispersive nonlinear media.
Next we examine higher-order soliton evolution near the photonic crystal band edge. Soliton propagation is determined by two length scales agrawalNLoptics , the nonlinear length ) [with the effective nonlinear parameter defined by husko2009_OptExp and as the pulse peak power] and the dispersion length [where , as the pulse width (FWHM), here =2.3 ps, and for hyperbolic secant pulses]. The soliton number defines the conditions for soliton propagation. Let us first consider the canonical case of GVD and SPM only, i.e. neglecting higher-order effects. When =1 in this simple case, the pulse propagates without dispersing as a fundamental soliton due to a precise balance of GVD and SPM. When 1 in the simple case, the higher-order solitary pulse evolves recurrently by first compressing, then splitting temporally before regaining its initial shape after a soliton period . In contrast to these simple dynamics, in our semiconductor media the soliton propagation dynamics are governed by a complex nonlinear regime involving an intrapulse non-adiabatic free-carrier plasma (with absorptive and dispersive terms) generated from three-photon absorption, giving rise to the composite temporal and spectral features in the 2D spectrograms of Figure 2.
To discern the roles of each of these effects, we model the pulse propagation with a nonlinear Schrödinger equation (NLSE) Bhat_PRE2001 that captures the underlying perturbed Bloch lattice with an envelope function, including dispersive slow light, free-carrier dynamics (density ), three-photon absorption, and higher-order effects. The full model employed here (detailed in the Methods) contrasts with the simple integrable NLSE which neglects losses, gain, and any higher-order dispersion. Importantly, free-electrons exhibit distinct ionization and loss dynamics in the two plasma (multiphoton versus tunneling) regimes. Here in the multiphoton regime the free-electron absorption is proportional to , whereas in the tunneling regime (not present here), loss is proportional to the ionization rate saleh2011theory ; fedotov2007ionization . These dynamics are included in the model. The high-sensitivity FROG captures the exact pulse shape and phase of the input pulses, which subsequently serves as the initial launch pulse conditions into the NLSE. The resulting NLSE predicted intensity (dashed red) and solitary phase (dash-dot black) are presented in Figs. 2(f)-(h). Since FROG only gives the relative time, we temporally offset the FROG traces to overlap the NLSE for direct comparison. With all parameters precisely determined from experimental measurements, e.g. with no free parameters, we observe a strong agreement between the femtojoule-resolution measurements and the NLSE model across the diverse array of pulse energies and center frequencies.
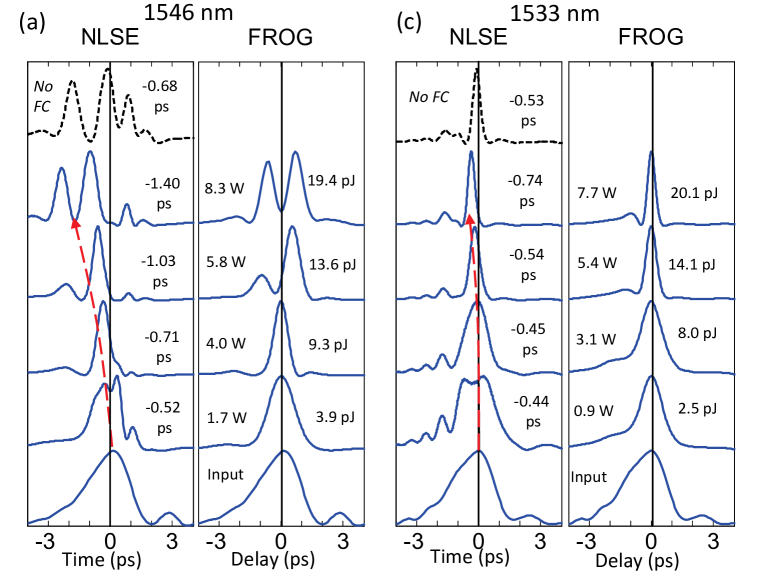
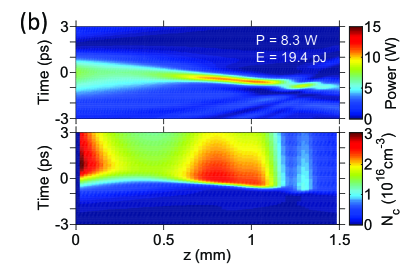
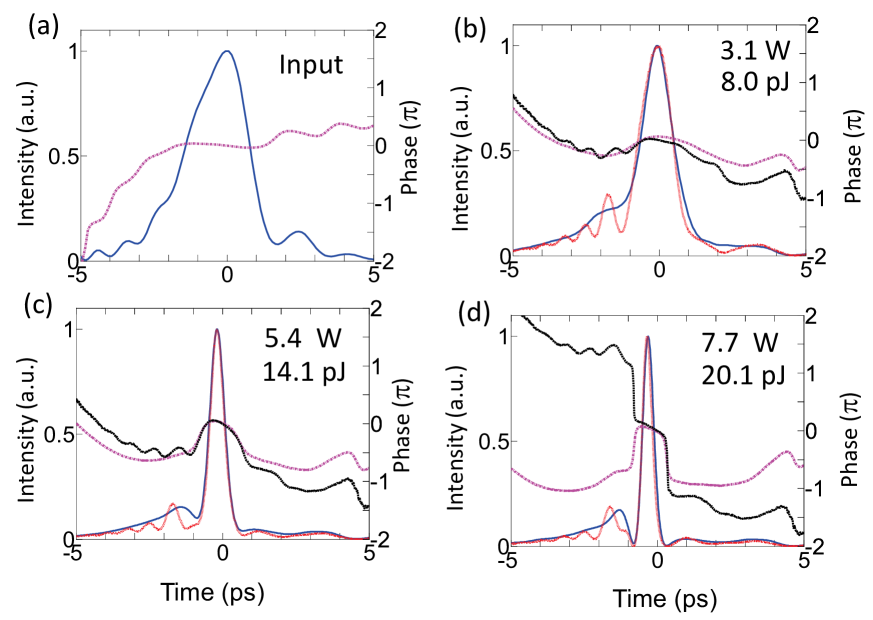
Examining further the soliton temporal dynamics, we illustrate both the FROG and NLSE at 1546 nm and 1533.5 nm for varying pulse energies in Fig. 3(a). As we increase the pulse energy, the center of the pulse, defined by the first-order moment, forward shifts from 0 ps to -1.4 ps, indicating for the first time that the 19.4 pJ (8.3 W) pulse accelerates as it travels along the slow-light photonic crystal. The black dashed line indicates simulations with suppressed free-carrier effects ( =0) at 19.4 pJ (8.3 W). The pulse center shifts noticeably less in this case, with a difference of 0.68 ps, confirming the origin of the soliton acceleration and its accompanying blue-shift is free-carrier plasma. Fig. 3(b) shows the modeled pulse intensity and generated carrier population along the waveguide, with these frequencies near the band edge. Fig. 3(b) indeed indicates the self-induced blue-shift – or a self-induced frequency-chirp – is strongest near the input of the photonic crystal and at the location of largest pulse compression, correlating with the locations of highest powers and therefore generated free-electrons. These effects clearly arise from the non-adiabatic generation of a carrier plasma within the soliton itself. We additionally confirmed that third-order dispersion is negligible (not pictured here) in this regime by comparing it on and off in the model, indicating the acceleration is due completely to the generated plasma. The suppressed third-order-dispersion model further indicates the residual temporal shift is due to a small initial chirp in the pulses. This is in stark contrast with above-band-gap carrier-injection derived from adiabatic processes that shift the bands themselves (see Supplementary Information) leonard2002ultrafast ; kampfrath2010ultrafast .
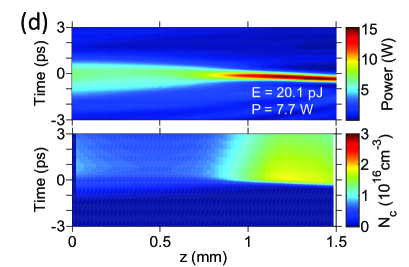
Next we tune the soliton frequencies further away from the band edge, with an example 1533.5 nm case ( = 5.4, = -0.49 ps2/mm) shown in Fig. 3(c). Though the input pulses are nearly identical, the pulse evolution is distinct due to a reduced dispersion and faster group velocity, and therefore weaker nonlinear and free-carrier plasma effects, compared to the 1546 nm case. Full phase retrieval of the 2D spectrograms at 1533.5 nm, similar to Fig. 2, are detailed in the Supplementary Information. Examining the temporal intensity, Fig. 3(c) indicates a minimum duration of 440 fs (, 330 fs shorter than the 1546 nm ( =2.4) case due to the larger injected soliton number (=3.5) for optimal compression at this dispersion and sample length. The 1533.5 nm pulse also experiences less acceleration due to smaller self-induced frequency-chirp and free-carrier effects, as illustrated in Fig. 3(d), confirming the robustness of the soliton acceleration mechanism under different nonlinear, dispersion, and input pulse conditions.
II.3 Periodic soliton recurrence and suppression in the presence of free-electron plasma
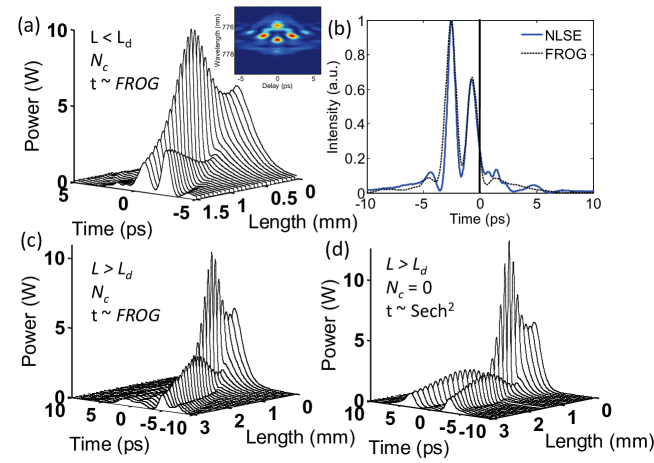
Dynamical solitons, in the balance of Kerr nonlinearity with anomalous dispersion, exhibit periodic recurrence – the soliton breakup, collision and re-merging kiblerNature2012 ; wuPRL2007 – in a Fermi-Pasta-Ulam lattice. Here we examine soliton dynamics at 1555 nm ( = 9.3, = -1.1 ps2/mm) for the higher-order solitons in the presence of free-carriers and nonlinear absorption. Figure 4(a) shows the experimentally captured FROG trace at 14.8 pJ (6.3 W) alongside NLSE modeling of the pulse propagation, including auxiliary free-electron non-instantaneous dynamics. The higher-order ultrafast soliton evolves by first compressing to a minimum duration, then splitting temporally, with the accelerated pulse induced by the multiphoton plasma. Fig. 4(b) shows the measured temporal trace in comparison with the NLSE simulations at the waveguide output, with remarkable agreement between experiment and theory.
Based on the high-fidelity of our model, we next consider numerically the case of a sample with twice the length , such that . Given the input soliton number of =3.2, we expect the pulse to have nearly reformed since the simulated sample length mm is greater than the soliton period mm agrawalNLoptics . Fig. 4(c), however, clearly demonstrates irreversible blue-shifting of the pulse energy, thereby breaking the symmetry of the optical pulse periodic evolution such that soliton recurrence is not possible in the presence of a plasma. The dominant loss mechanism at large peak powers is three-photon absorption, with a much smaller contribution from free-carrier absorption. Further to this point, in Fig. 4(d) we illustrate the pulses with suppressed free-carrier effects (=0) while retaining three-photon absorption and an ideal hyperbolic secant input. These figures exhibit recovery of the pulse symmetry without temporal shifts, illustrating the sizable contribution of the multiphoton plasma to the nonlinear dynamics. Though the temporal shape is symmetric, the higher-order periodic evolution is suppressed in this case due to three-photon absorption lowering soliton number . Indeed here three-photon absorption is the ultimate limit to loss in the multiphoton regime, in contrast to carrier generation dominating in the tunneling regime. The strong contrast of panel (d) with the other panels demonstrates the suppression of periodic recurrence in the presence of free-carrier dynamics. We note that materials with large two-photon absorption such as silicon cannot exhibit these dynamics at similar wavelengths and across the full range of pulse energies.
II.4 Temporal compression in multiphoton plasma materials
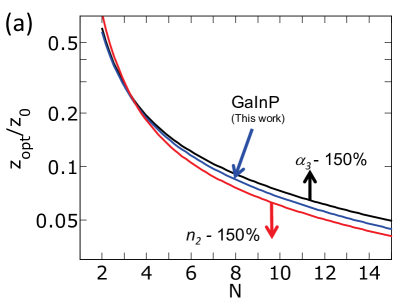
In soliton pulse compression schemes, it is important to consider the point of optimal temporal narrowing, . Fig. 5(a) highlights the ratio of optimal length to soliton period versus soliton number in GaInP computed via NLSE. The results include the slow-light modified Kerr, three-photon and free-carriers, and can be cast by the following fitted relation:
| (1) |
In the experimental case of 1546 nm maximum compression was achieved at , corresponding to 0.37. This yields an estimate of of 1.37 mm, in solid agreement with the effective sample length of of 1.35 mm at this wavelength. To discern the role of the nonlinear effects and in the compression dynamics, we investigate a 50% larger (same base ) and (same base ), indicated by the lines above and below the experimental case, respectively. As shown, a larger effective () causes the vs. curve to move downwards (upwards), e.g. decreasing (increasing) the length scale of compression, and indicating that desired compression effects can be achieved at lower (higher) intensities. Thus different effective nonlinearities will have different scalings due to enhanced or suppressed compression dynamics. For soliton compression in semiconductor media it is clearly important to consider the balance between Kerr and nonlinear absorption.
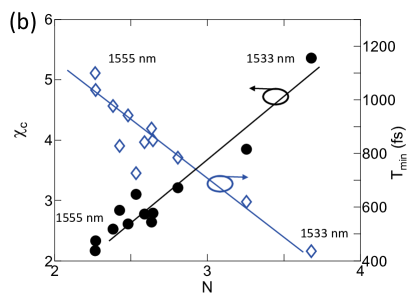
We next carried out measurements to determine the minimum pulse duration for twelve different wavelengths, mapping the dispersion conditions across a broad range of slow group velocity regions. Fig. 5(b) summarizes these results at the achieved compression factor versus the measured soliton number at the minimum temporal duration. At slower group velocities (longer wavelengths), the ultrafast compression scales monotonically with , along with the minimum pulse duration approaching 440 fs from a 2.3 ps pulse input at 1533.5 nm (input pulse parameters detailed in the Supplementary Information). Larger values corresponds to greater compression factors, as expected, with all of the wavelengths examined experiencing a compression of at least . The principles of dispersion engineering could allow for uniform and to create broadband soliton compression baba_nature2008 ; corcoranTHG .
================================================================
III Conclusion
We have demonstrated soliton dynamics in the multiphoton plasma regime in highly-nonlinear, highly-dispersive, photonic crystal lattices. We observed phase-balanced optical solitons, dynamical pulse splitting, solitary pulse acceleration due to self-induced frequency-chirp, in addition to the suppression of soliton recurrence due to fast carrier dynamics via frequency-resolved optical gating spectroscopy. Higher-order soliton compression down to 440 fs from 2.3 ps was observed at 20.1 pJ in 1.5-mm device lengths. We characterized soliton compression at twelve sets of dispersion values and derived a scaling for compression and soliton number in semiconductors. The demonstrated ultra-low energies (10s of pJ) and intensities ( 1010 W/cm2) are six and four orders of magnitude smaller, respectively, than required in recent amorphous materials for significant plasma photoionization and densities holzer2011ionization ; fedotov2007ionization and even smaller than that of attosecond extreme ultraviolet radiation in gases goulielmakis2008single . These observations of strong light-matter interaction at pJ energies in nanophotonic architectures advance our understanding of nonlinear wave propagation and open key new research pathways towards fundamental studies of multiphoton light-plasma interactions.
Acknowledgements
The authors thank James F. McMillan, Jie Gao, Matthew Marko, and Xiujian Li for useful discussions, and Keren Bergman for the autocorrelator. C.A.H. performed the measurements and numerical simulations. J.Z. assisted in the building of the FROG setup. P.C. and S.C. prepared the samples and nanofabrication, and P.C. assisted in the modeling. A.D.R. and C.W.W. supervised the project. C.A.H., A.D.R., and C.W.W. wrote the manuscript. All authors confirm the advances described in the paper. The work is partially funded by the National Science Foundation, under ECCS-1102257, DGE-1069240, and ECCS-0747787, and the 7th Framework Program of the European Commission program COPERNICUS (www.copernicusproject.eu). The authors declare no competing financial interests. Correspondence and requests for materials should be addressed to C.A.H. and C.W.W.
Methods
Experimental pulse characterization
In the soliton measurements, we employed a mode-locked fiber laser (PolarOnyx) delivering nearly transform-limited 2.3 ps pulses at a 39 MHz repetition rate. The source is tunable from 1533.5 to 1568 nm. We characterized the input pulses with the FROG, experimentally verifying that the time-bandwidth product approaches the Fourier-limit of hyperbolic secant pulses (= 0.315) within 5%. The power input into the photonic crystal waveguide is attenuated with a polarizer and half-wave plate, thereby preventing misalignment and undesirable modification of the pulse shape. Importantly, the pulses collected from the end facet of the photonic crystal waveguide were input directly into the FROG to guarantee accurate measurement of the pulse, e.g. no amplification stage.
The second-harmonic (SHG) FROG apparatus consisted of a lab-built interferometer with a thin BBO crystal (1 mm) and a high-sensitivity grating spectrometer (Horiba) with a cryogenically-cooled deep-depletion 1024 256 Si CCD array. The spectral resolution was 20 pm while the delay time step was varied between 100 to 200 fs, depending on the pulse duration. The FROG can detect pulses as little as 25 fJ pulse energies (1 W off-chip average power). The results were computed on a 256 256 grid and with retrieved FROG gate errors below 0.005 in all cases reported here. The FROG algorithm retrieves the pulse temporal and spectral properties, including a direct determination of the phase without any approximations. The FROG output data were compared with an optical spectrum analyzer (OSA), to ensure robust pulse retrieval of the FROG algorithm. The output pulses were too weak to measure with an autocorrelator (AC) here. The low FROG retrieval errors and good match to the spectral features indicate proper retrieval.
Nonlinear Schrödinger equation (NLSE) model
The NLSE model is described by Bhat_PRE2001 :
| (2) |
This includes third-order dispersion , linear propagation loss , effective slow-light three-photon nonlinear absorption husko2009_OptExp , effective nonlinear parameter , and generated carrier density with associated free-carrier dispersion and absorption . The auxiliary carrier equation induces a non-instantaneous response through the carrier lifetime . The free-carrier dispersion coefficient includes group index scaling: . Here is m2 based on established data for GaAs lasers and scaled with the group index. We solve the NLSE model employing an implicit Crank-Nicolson split-step method. Parameters are obtained directly from experimental measurements or calculated as required (such as ) colman2010 ; mpbCode . The bulk Kerr = 0.5710-17 m2/W sheikBahae1990 and = 2.510-26 m3-W-2 wherrett1984 coefficients employed in the calculations are in agreement with well-known models. Third-order nonlinear effects and linear propagation loss are taken to increase with group velocity. Third-order dispersion, included in the model, contributes negligibly throughout the range of parameters examined here.
FROG characterization of launched pulses
Before examining the soliton dynamics in the photonic crystal waveguide at various wavelengths, we first characterized the input pulse with the FROG apparatus. We observed solid agreement between the experimental and retrieved FROG traces as shown in the Supplementary Information. Comparison of autocorrelation traces between the FROG and a conventional autocorrelator (FemtoChrome) shows one-to-one matching of the launched pulses; comparison of spectral lineshapes between the FROG and an optical spectrum analyzer shows near identical matching. FROG retrieves the pulse temporal intensity and phase, information unavailable from autocorrelation or an optical spectrum analyzer alone (detailed in the Supplementary Information). The slight pulse asymmetry, for example, is obscured in the autocorrelation trace. The pulse phase is nearly flat, indicating near transform-limited performance. Pulses at other wavelengths exhibit similar characteristics.
Supplementary Information
Linear properties of the photonic crystal waveguide
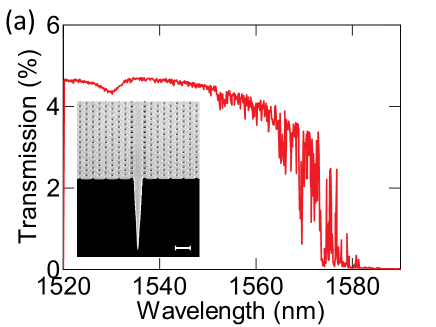
The transmission of the 1.5-mm photonic crystal (PhC) waveguide is illustrated in Fig. S1(a). Total insertion loss (before and after coupling optics) is estimated to be 13 dB at 1530 nm (group index = 5), including 10 dB attributable to the coupling optics, and 1 dB propagation loss at this wavelength. Carefully designed integrated mode-adapters reduce waveguide coupling losses to 2 dB (insertion) and suppress Fabry-Perot oscillations from facet reflections as shown in the inset of Fig. S1(a) tranAPL09 . The linear loss is = 10 dB/cm at 1540 nm, scaled linearly with baba_nature2008 ; monat2009 . The small feature at 1530 nm is the onset of the higher-order waveguide mode coupling. The energy coupled into the PhC is estimated by assuming symmetric coupling loss (input and output) except for a factor accounting of mode mismatch on the input side (lens to waveguide) that we do not have at the output since is measured with a free space power meter. This enables us to calculate the factor between the measured average power at input (output) and the value of the average power at the beginning (end) of the waveguide. Pulse energy is obtained by dividing by the repetition ratio. As noted in the main body, a slight dip is present in the group index at 1545 nm, implying a small deviation in the local dispersion . This gives rise the the spreading near =2.5 in Fig. 5(b) corresponding to that wavelength region.
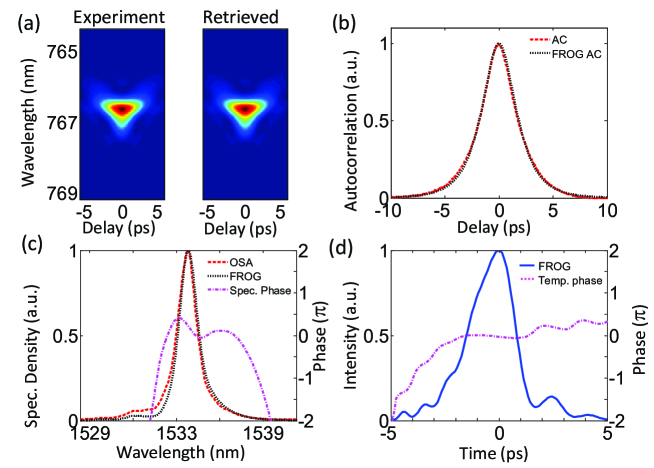
Frequency-resolved optical gating (FROG) pulse
Fig. S1(b) shows the frequency-resolved optical gating (FROG) setup used in the experiments. With the FROG technique, one is able to completely characterize the pulse, including intensity and phase information in both the spectral and temporal domains. We employed a second-harmonic FROG (SHG FROG) technique detailed in the Methods. The equation governing the second-harmonic generation SHG-FROG is:
| (3) |
where is the measured pulse, is the electric field and the phase. The spectrograms are processed numerically to retrieve the pulse information trebinoBook . Fig. S2(a) compares the experimental and retrieved spectrograms of typical input pulse measured by the FROG, here at 1533.5 nm. Figs. S2(b) and (c) indicate the FROG autocorrelation and spectrum compared with independent measurements with a commercial autocorrelator (Femtochrome) and optical spectrum analyzer (OSA), respectively. Fig. S2(d) shows the temporal intensity and phase retrieved from the FROG measurement, information unavailable from typical autocorrelation and OSA measurements. The pulse phase is flat across the pulse, indicating near-transform limited input pulses.
Frequency-resolved optical gating of chip-scale ultrafast solitons at 1533.5 nm and 1546 nm
Fig. S3 shows the retrieved FROG intensity (blue line) and phase (magenta) at 1533.5 nm ( = 5.4, =-0.49 ps2/mm). The nonlinear Schrödinger equation results are presented in Figs. S3 (a)-(d) with predicted intensity (dashed red) and phase (dash-dot black). Since FROG only gives the relative time, we temporally offset the FROG traces to overlap the NLSE for direct comparison. All parameters precisely determined from experimental measurements, e.g. no free fitting parameters. Fig. S3(d) shows the maximum pulse compression to a minimum duration of 440 fs from 2.3 ps ( = 5.3) at 7.7 W (20.1 pJ, = 3.5), demonstrating higher-order soliton compression. The slight dip in the pulse phase at positive delay (temporal tail) is due to free-carrier blue-shift.
Figs. S4(a)-(d) show the FROG traces at 1546 nm as in the main paper. Figs. S4(e)-(h) compare the retrieved FROG spectral density (dotted black) and NLSE simulations (solid blue) to independent measurements with an optical spectrum analyzer (dashed red). The experimental and modeling results agree simultaneously in both the time (main text) and spectral domains shown here.
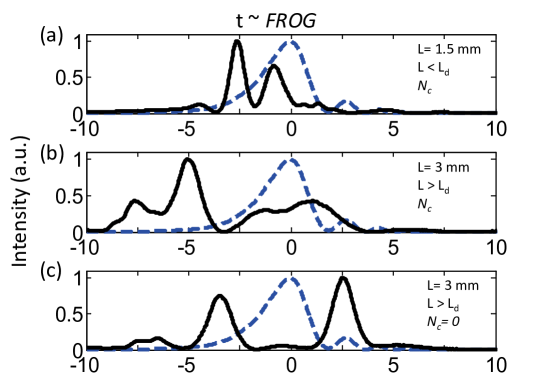
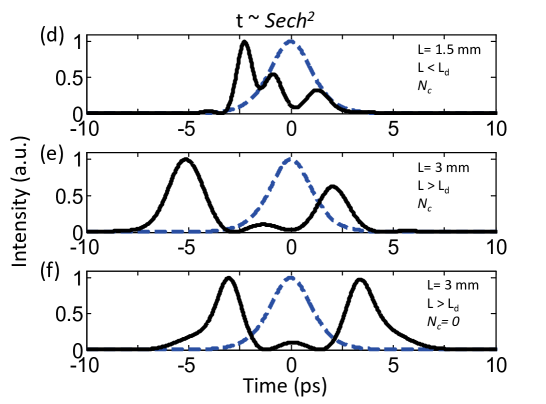
Periodic soliton recurrence and suppression in the presence of free-electron plasma: role of free-carriers and input pulse shape
In Fig. 4 of the main text, we demonstrated the suppression of periodic soliton recurrence in the presence of free-electron plasma. Fig. S5 shows additional details of the physics presented there. Fig. S5(a) shows the NLSE model of the experimental situation: = 1.5 mm and free carriers () as in the main paper. Fig. S5(b) shows that even with longer = 3 mm samples the pulse recurrence is clearly suppressed. Fig. S5(c) shows NLSE modeling in the absence of free-carriers (). The pulse splits temporally, but does not reform due to loss. In contrast to the FROG input pulses used in the simulations throughout the text thus far, Figs. S5(d)-(f) show NLSE models with chirp-free input pulses. Importantly, the same basic features are represented for both the FROG (a)-(c) and inputs (d)-(f), demonstrating soliton re-shaping of our experimental pulses.
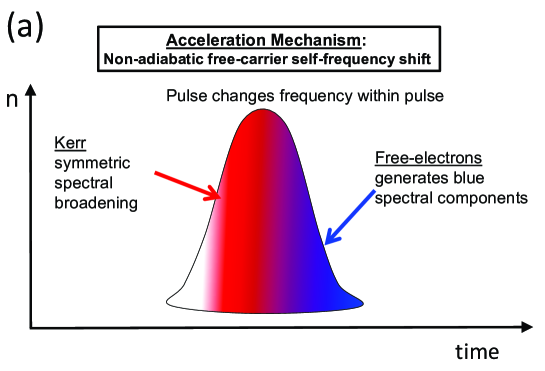
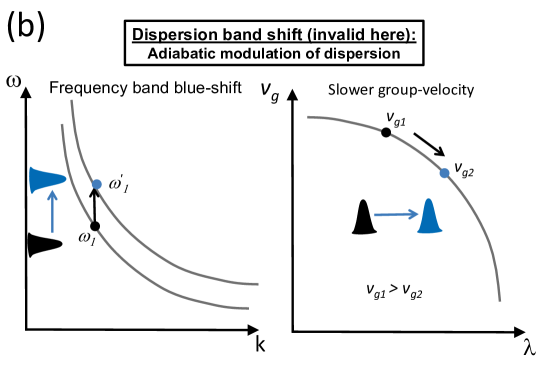
Pulse acceleration in a multiphoton plasma
The mechanism accelerating the pulse is a non-adiabatic generation of a free-carrier plasma via multiphoton absorption within the pulse inducing a blue frequency chirp. Fig. S6(a) shows a schematic of the self-induced free-carrier blue-shift and resulting acceleration of the pulse. The regions of largest plasma generation occur at the waveguide input as well as at points of maximum compression as shown in Fig. 3 of the main text. Moreover, we note that the dispersion bands themselves do not shift at our 10-pJ 1550-nm pulse energies, in contrast to other reports with Ti:sapphire pump-probe and carrier injection with above-band-gap 1 to 100 nJ pulse energies at 800-nm kampfrath2010ultrafast ; leonard2002ultrafast . Such a scenario, presented in Fig. S6(b), would only cause the light to shift slower group velocities, as has been shown in Ref. kampfrath2010ultrafast . Furthermore, this mechanism is not a deceleration, but rather a frequency conversion method to change the pulse central wavelength to a frequency with different propagation properties.
References
- (1)
- (2)
- (3)
- (4)
- (5) E. Goulielmakis, M. Schultze, M. Hofstetter, V. S. Yakovlev, J. Gagnon, M. Uiberacker, A. L. Aquila, E. Gullikson, D. T. Attwood, R. Kienberger, F. Krausz, and U. Kleineberg, “Single-cycle nonlinear optics,” Science 320, 1614–1617 (2008).
- (6) T. J. Kippenberg, R. Holzwarth, and S. A. Diddams, “Microresonator-based optical frequency combs,” Science 332, 555 (2011).
- (7) X. Liu, R. Osgood, Y. Vlasov, and W. Green, “Mid-infrared optical parametric amplifier using silicon nanophotonic waveguides,” Nature Photonics 4, 557–560 (2010).
- (8) B. Corcoran, C. Monat, C. Grillet, D. J. Moss, B. J. Eggleton, T. P. White, L. O’Faolain, and T. F. Krauss, “Green light emission in silicon through slow-light enhanced third-harmonic generation in photonic-crystal waveguides,” Nature Photonics 3, 206–210 (2009).
- (9) J. T. Mok, C. M. De Sterke, I. C. M. Littler, and B. Eggleton, “Dispersionless slow light using gap solitons,” Nature Physics 2, 775–780 (2006).
- (10) T. Baba, “Slow light in photonic crystals,” Nature Photonics 2, 465 (2008).
- (11) J. W. Fleischer, M. Segev, N. K. Efremidis, and D. N. Christodoulides, “Observation of two-dimensional discrete solitons in optically-induced nonlinear photonic lattices,” Nature 422, 147–150 (2003).
- (12) M. Fridman, A. Farsi, Y. Okawachi, and A. L. Gaeta, “Demonstration of temporal cloaking,” Nature 481, 62–65 (2012).
- (13) T. Dauxois and M. Peyrard, Physics of Solitons (Cambridge University Press, 2006).
- (14) B. Ilan and M. I. Weinstein, “Band-Edge Solitons, Nonlinear Schrödinger/Gross–Pitaevskii Equations, and Effective Media,” Multiscale Modeling and Simulation 8, 1055 (2010).
- (15) Y. S. Kivshar and G. P. Agrawal, Optical solitons: from fibers to photonic crystals (Academic Press San Diego, 2003).
- (16) D. R. Solli, C. Ropers, P. Koonath, and B. Jalali, “Optical rogue waves,” Nature 450, 1054–1057 (2007).
- (17) D. G. Ouzounov, F. R. Ahmad, D. Müller, N. Venkataraman, M. T. Gallagher, M. G. Thomas, J. Silcox, K. W. Koch, and A. L. Gaeta, “Generation of megawatt optical solitons in hollow-core photonic band-gap fibers,” Science 301, 1702 (2003).
- (18) D. V. Skryabin, F. Luan, J. C. Knight, and P. S. J. Russell, “Soliton self-frequency shift cancellation in photonic crystal fibers,” Science 301, 1705–1708 (2003).
- (19) J. M. Dudley, C. Finot, D. J. Richardson, and G. Millot, “Self-similarity in ultrafast nonlinear optics,” Nature Physics 3, 597–603 (2007).
- (20) J. M. Dudley, G. Genty, and S. Coen, “Supercontinuum generation in photonic crystal fiber,” Reviews of Modern Physics 78, 1135 (2006).
- (21) J. J. Macklin, J. D. Kmetec, and C. L. Gordon III, “High-order harmonic generation using intense femtosecond pulses,” Phys. Rev. Lett. 70, 766–769 (1993).
- (22) P. B. Corkum, “Plasma perspective on strong field multiphoton ionization,” Phys. Rev. Lett. 71, 1994–1997 (1993).
- (23) E. P. Power, A. M. March, F. Catoire, E. Sistrunk, K. Krushelnick, P. Agostini, and L. F. DiMauro, “XFROG phase measurement of threshold harmonics in a Keldysh-scaled system,” Nature Photonics 4, 352–356 (2010).
- (24) P. Hölzer, W. Chang, J. C. Travers, A. Nazarkin, J. Nold, N. Y. Joly, M. F. Saleh, F. Biancalana, and P. S. J. Russell, “Femtosecond nonlinear fiber optics in the ionization regime,” Phys. Rev. Lett. 107, 203,901 (2011).
- (25) A. B. Fedotov, E. E. Serebryannikov, and A. M. Zheltikov, “Ionization-induced blueshift of high-peak-power guided-wave ultrashort laser pulses in hollow-core photonic-crystal fibers,” Phys. Rev. A 76, 053,811 (2007).
- (26) A. McPherson, G. Gibson, H. Jara, U. Johann, T. S. Luk, I. A. McIntyre, K. Boyer, and C. K. Rhodes, “Studies of multiphoton production of vacuum-ultraviolet radiation in the rare gases,” JOSA B 4, 595–601 (1987).
- (27) P. Colman, C. Husko, S. Combrié, I. Sagnes, C. W. Wong, and A. De Rossi, “Observation of soliton pulse compression in photonic crystal waveguides,” Nature Photonics 4, 862 (2010).
- (28) D. T. H. Tan, P. C. Sun, and Y. Fainman, “Monolithic nonlinear pulse compressor on a silicon chip,” Nature Communications 1, 116 (2010).
- (29) T. Karle, P. Monnier, S. Combrié, A. De Rossi, F. Raineri, and R. Raj, “Direct observation of Temporal Solitons and Pulse acceleration in III-V semiconductor Photonic crystal waveguides,” in Slow and Fast Light (Optical Society of America, 2011).
- (30) W. Ding, A. V. Gorbach, W. J. Wadsworth, J. C. Knight, D. V. Skryabin, M. J. Strain, M. Sorel, and R. M. De La Rue, “Time and frequency domain measurements of solitons in subwavelength silicon waveguides using a cross-correlation technique,” Opt. Express 18, 26,625–26,630 (2010).
- (31) Q. V. Tran, S. Combrié, P. Colman, and A. De Rossi, “Photonic crystal membrane waveguides with low insertion losses,” App. Phys. Lett. 95, 061,105 (2009).
- (32) S. G. Johnson and J. D. Joannopoulos, “Block-iterative frequency-domain methods for Maxwell’s equations in a planewave basis,” Opt. Express 8, 173 (2001).
- (33) J. Zhang, Q. Lin, G. Piredda, R. W. Boyd, G. P. Agrawal, and P. M. Fauchet, “Optical solitons in a silicon waveguide,” Opt. Express 15, 7682–7688 (2007).
- (34) C. Monat, B. Corcoran, M. Ebnali-Heidari, C. Grillet, B. Eggleton, T. White, L. O’Faolain, and T. F. Krauss, “Slow light enhancement of nonlinear effects in silicon engineered photonic crystal waveguides,” Opt. Express 17, 2944 (2009).
- (35) C. Husko, S. Combrié, Q. Tran, F. Raineri, C. Wong, and A. De Rossi, “Non-trivial scaling of self-phase modulation and three-photon absorption in III-V photonic crystal waveguides,” Opt. Express 17, 22,442 (2009).
- (36) S. Combrié, Q. Tran, A. De Rossi, C. Husko, and P. Colman, “High quality GaInP nonlinear photonic crystals with minimized nonlinear absorption,” Appl. Phys. Lett. 95, 221,108 (2009).
- (37) L. V. Keldysh, “Ionization in the field of a strong electromagnetic wave,” Soviet Physics JETP 20(5) (1965).
- (38) R. Trebino, Frequency-resolved optical gating: the measurement of ultrashort laser pulses (Kluwer, 2002).
- (39) A. Xing, “Dispersion Properties of Photonic Crystal Waveguide,” Ph.D. thesis, University of California - Santa Barbara (2005).
- (40) A. Pasquazi, M. Peccianti, Y. Park, B. E. Little, S. T. Chu, R. Morandotti, J. Azaña, and D. J. Moss, “Sub-picosecond phase-sensitive optical pulse characterization on a chip,” Nature Photonics 5, 618 (2011).
- (41) Y. Mairesse and F. Quéré, “Frequency-resolved optical gating for complete reconstruction of attosecond bursts,” Phys. Rev. A 71, 11,401 (2005).
- (42) G. P. Agrawal, Nonlinear Fiber Optics (Academic, 2007).
- (43) N. A. R. Bhat and J. E. Sipe, “Optical pulse propagation in nonlinear photonic crystals,” Phys. Rev. E 64, 056,604 (2001).
- (44) M. F. Saleh, W. Chang, P. Hölzer, A. Nazarkin, J. C. Travers, N. Y. Joly, P. S. J. Russell, and F. Biancalana, “Theory of photoionization-induced blueshift of ultrashort solitons in gas-filled hollow-core photonic crystal fibers,” Phys. Rev. Lett. 107, 203,902 (2011).
- (45) S. W. Leonard, H. M. Van Driel, J. Schilling, and R. B. Wehrspohn, “Ultrafast band-edge tuning of a two-dimensional silicon photonic crystal via free-carrier injection,” Phys. Rev. B 66, 161,102 (2002).
- (46) T. Kampfrath, D. M. Beggs, T. P. White, A. Melloni, T. F. Krauss, and L. Kuipers, “Ultrafast adiabatic manipulation of slow light in a photonic crystal,” Phys. Rev. A 81(4), 043,837 (2010).
- (47) B. Kibler, J. Fatome, C. Finot, G. Millot, G. Genty, B. Wetzel, N. Akhmediev, F. Dias, and J. M. Dudley, “Observation of Kuznetsov-Ma soliton dynamics in optical fibre,” Nature Scientific Reports 2 (2012).
- (48) M. Wu and C. E. Patton, “Experimental observation of Fermi-Pasta-Ulam recurrence in a nonlinear feedback ring system,” Phys. Rev. Lett. 98(4), 47,202 (2007).
- (49) M. Sheik-Bahae, D. Hagan, and E. W. Van Stryland, “Dispersion and band-gap scaling of the electronic Kerr effect in solids associated with two-photon absorption,” Phys. Rev. Lett. 65, 96 (1990).
- (50) B. S. Wherrett, “Scaling rules for multiphoton interband absorption in semiconductors,” Opt. Soc. Am. B 1, 67 (1984).
- (51) S. Combrié, A. De Rossi, L. Morvan, S. Tonda, S. Cassette, D. Dolfi, and A. Talneau, “Time-delay measurement in singlemode, low-loss photonic crystal waveguides,” Elec. Letters 42, 86 (2006).