Pressure effects in hollow and solid iron oxide nanoparticles
Abstract
We report a study on the pressure response of the anisotropy energy of hollow and solid maghemite nanoparticles. The differences between the maghemite samples are understood in terms of size, magnetic anisotropy and shape of the particles. In particular, the differences between hollow and solid samples are due to the different shape of the nanoparticles and by comparing both pressure responses it is possible to conclude that the shell has a larger pressure response when compared to the core.
pacs:
75.30.Cr, 75.50.TtI Introduction
Pressure is a thermodynamical parameter on which changes in structural and magnetic properties are commonly observed. In the case of nanoparticles (NPs), pressure modifies the transition temperatureISI:000294484300134 , the susceptibility and magnetizationYukiPression ; YukiJMMM , the hysteresis cyclesYukiPression and the effective anisotropy energy barrierYukiAPL . The effect of pressure in the NPs core and surface is distinct, allowing disentanglement of core and shell magnetic properties. This is the case of the anisotropy energy barrier in spherical maghemite NPs; while at room pressure only an effective value can be obtained, with increasing pressure core and shell size have a different response and so does the effective anisotropy energy, such that core and shell components of the anisotropy energy can be extracted YukiAPL .
Core/shell models have been successfully used in the context of magnetic properties of maghemite NPs. These models often consider that the particles are constituted by a bulk-like core and a surface with distinct magnetic properties. In a seminal work, Coey described maghemite NPs as having a core with the bulk spin arrangement and a surface in which the spins are inclined at some angleCoey . The surface spins of maghemite NPs were lately shown to have spin-glass like properties Martinez . In the case of magnetization () measurements, surface is often considered as constituted by single paramagnetic and/or aniferromagnetic ions, whose contribution to is linear in field Angel_Ms . The origin of this surface magnetic behaviour is associated with incomplete coordination of superficial ions and to the likely occurrence of structural defects at the surface, as shown by experimental techniques and computer simulations (see for instance Ref. Berkowitz_prl2 ; Berkowitz_prb_model ; Oscar_prb ).
Since maghemite core and shell properties have a different pressure response, one can expect that maghemite particles with different geometry have a different behaviour with pressure, allowing a better insight on the magnetic properties of core and shell. Hollow maghemite NPs are an exotic and interesting system where the relevance of surface is enhanceddoi:10.1021/ja072574a ; PhysRevB.79.094419 . Accordingly, we investigate the effect of pressure in hollow maghemite NPs and we compare this effect with that observed in solid maghemite NPs obtained by polymeric-assisted synthesis and non-aqueous routes.
II Experimental
Three different samples were synthesized and studied: a sample composed of hollow iron oxide NPs capped by oleylamine, a sample composed of solid iron oxide NPs capped by oleic acid and a sample composed of solid iron oxide NPs dispersed in a polymer and forming a composite.
Hollow iron oxide NPs were obtained by the nanoscale Kirkendall effect following a previously reported proceduredoi:10.1021/ja072574a . Briefly, iron NPs were obtained by decomposition of iron pentacarbonyl in organic solvents containing amines. 10 ml of octadecene (C18H38) containing 0.67 mmol of oleylamine were heated inside a three-neck flask to 60 ∘C under vacuum for 30 min. While keeping the solution under argon, the temperature was raised to 200 ∘C. A precursor solution of 0.4 ml of Fe(CO)5 in 2 ml of octadecene was prepared separately under Ar. This was rapidly injected through a septum into the hot surfactant solution under vigorous stirring. The resulting solution was reacted for 20 min. Afterwards, to oxidize the formed iron NPs, 20 ml/min of a 20% oxygen mixture in argon were flowed through the heated flask over 2 h.
Solid -Fe2O3 NPs were obtained by decomposing iron pentacarbonyl in octadecene in the presence of an excess of oleic acid. The presence of equivalent or excess amounts of oleic acid in the precursor solution initially results in the formation of iron oleate, which decomposes directly into iron oxide. In a typical synthesis, a mixture of 10 ml of octadecene and 2 ml of oleic acid were heated inside a three-neck flask to 60 ∘C under vacuum for 30 min. While keeping the solution under argon, the temperature was raised to 280 ∘C. At this temperature 0.4 ml of Fe(CO)5 in 2 ml of octadecene were rapidly injected through a septum. The resulting solution was reacted for 20 min. The particle size was tuned by changing reaction time and the concentration of iron carbonyl injected.
Maghemite/polymer nanocomposites were prepared from iron/poly(4-vinylpyridine) (PVP) precursor compounds, following the procedure reported in Ref.Angel_Comp . The precursor was prepared by mixing a water:acetone solution of PVP with a RbBr-FeBr2-FeBr3 stock solution. The solution was evaporated at 40 ∘C to obtain a solid film. The precursor film was immersed in a 1 M NaOH solution for 1 h, washed with water and dried at 60 ∘C to obtain a polymer/NPs composite. Finally, the composite was annealed at 200 ∘C for 24 h. In the following, the three studied samples are identified as hollow, solid and polymer-grown.
The geometry, size and crystallographic structure of the NPs were characterized by transmission electron microscopy (TEM) and high-resolution TEM (HRTEM) using a Jeol 2010F field emission gun microscope with a 0.19 nm point to point resolution.
X-ray diffraction (XRD) measurements were performed at room temperature as a function of pressure up to 30 kbar using a cylindrical imaging plate diffractometer (Rigaku Co.) at the Photon Factory of the Institute of Materials Structure Science at the High Energy Accelerator Research Organization (KEK) SynchrotronPressure . The wavelength of the incident X-ray was Å. Pressure was applied using a diamond anvil cell, which consisted of two diamond anvils with flat tips of diameter 0.8 mm and a 0.3-mm-thick CuBe gasket. The pressure was calibrated by the ruby fluorescence methodPressureMethodRubi . The maghemite NPs and a few ruby crystals were held along with a pressure-transmitting medium (fluorinated oil, FC77, Sumitomo 3M Co., Ltd.) in a sample cavity of diameter 0.4 mm located at the center of the CuBe gasket. The analysis of the diffraction patterns was performed by Rietveld refinement using the FullProf package FullProf . The size effects were treated with the integral breadth method using the Voigt model for both the instrumental and intrinsic diffraction peak shape considering a Thompson-Cox-Hastings pseudo-Voigt convoluted with Axial divergence asymmetry function to describe the peak shape. The contribution of the finite size of the NPs crystallites to the peaks broadening was taken into account by an isotropic model yielding an average apparent size.
For the magnetic measurements, the pressure was generated by a piston-cylinder-type CuBe pressure cell that was designed to be inserted into a commercial superconducting quantum interference device (SQUID) magnetometer (Quantum Design, MPMS)MitoPressureCell . The maghemite NPs were held in the Teflon cell, which was installed in the pressure cell along with the pressure-transmitting medium (Apiezon-J oil) and a few pieces of superconductor tin used as a manometer. The pressure at liquid-helium temperature was estimated by the shift in the superconducting transition temperature of tinPressureMethod . The ac magnetic response was measured as a function of the temperature () and the frequency of the ac field (). Under an ac field () of 4.0 Oe, the in-phase (’) and out-of-phase (”) components of a series of first-order harmonic components, , were detected from the Fourier transform of the SQUID voltage, which was measured after modification of the phase delay due to the eddy current of CuBe at each frequency.
III Results and discussion
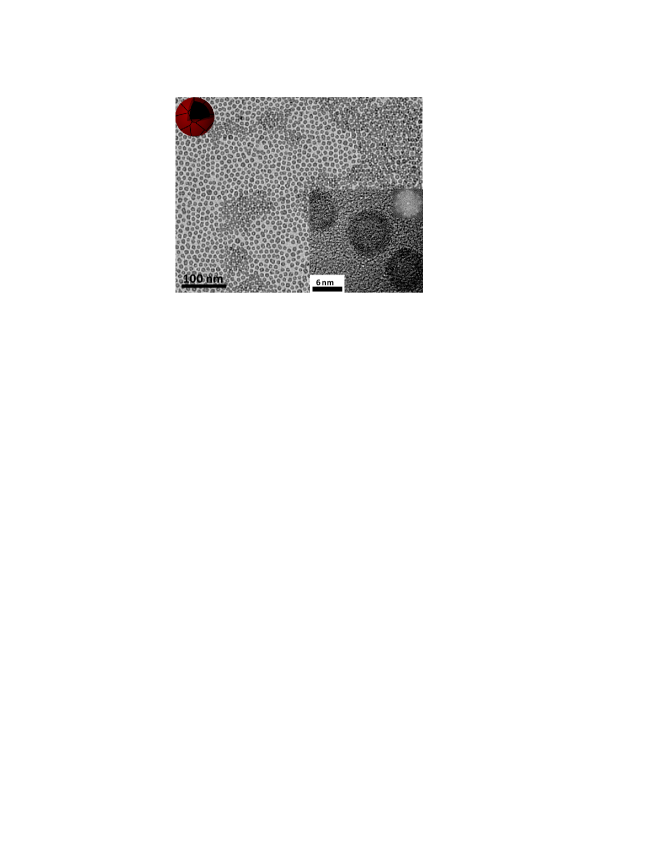
TEM micrographs of the hollow sample show the expected geometry of core/shell hollow/solid NPs with an average diameter of about 8 nm and a low size dispersion (Fig.1). The iron oxide shell has about 3 nm, being polycrystalline, as seen in the HRTEM micrographs and corresponding Fourier transform (Fig. 1, right inset). Accordingly, the NP structure can be depicted as a tectonic crust, as shown in Fig. 1, top-left inset.
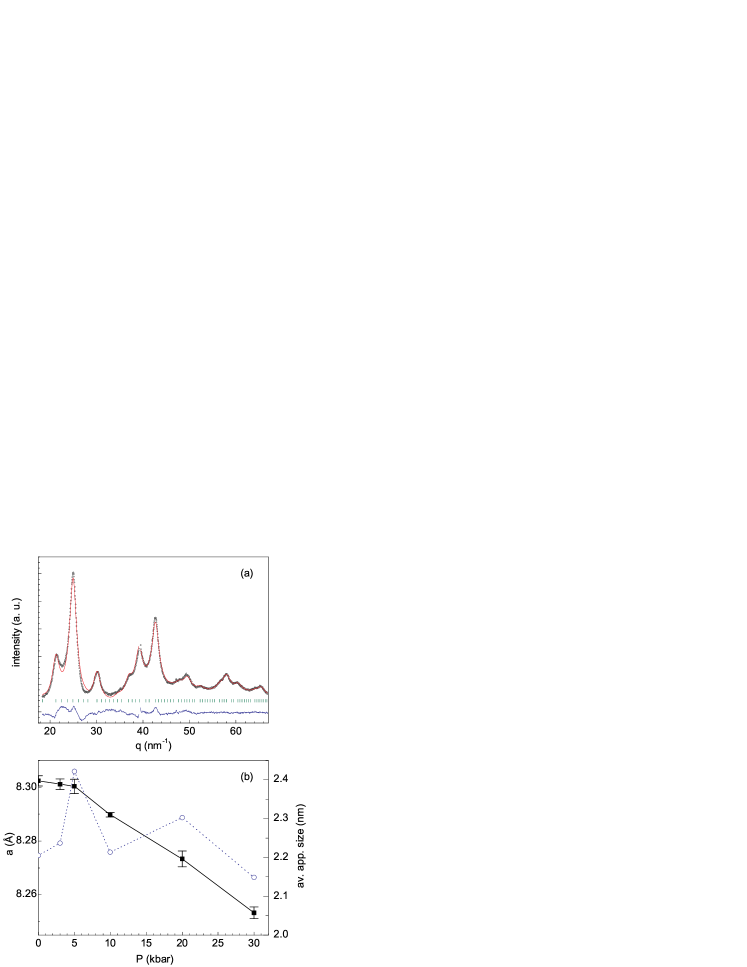
XRD patterns of the hollow sample show the existence of NPs with a spinel structure consistent with magnetite/maghemite [Fig.2(a)]. The patterns can be well reproduced by considering the space group and a peak broadening due to finite size effects. Fits with similar quality are obtained when considering different Fe/O stoichiometry although the best fit is obtained with a stoichiometry closer to magnetite than to maghemite. This result should be taken carefully, since the background is ill-defined making difficult a proper determination of the relative intensity of the peaks. In fact, previous spectroscopy studies suggest that the iron oxide is maghemite rather than magnetitedoi:10.1021/ja072574a . The contribution to the peak broadening due to strain is negligible compared to that of size. The average apparent size at room pressure is nm [Fig.2(b)], in good agreement with the nm crystalline domains observed by HRTEM. The cell parameter decreases monotonically with pressure, whereas the average apparent size has no defined trend having values in the 2.1 to 2.4 nm range (which is probably close to its error bar).
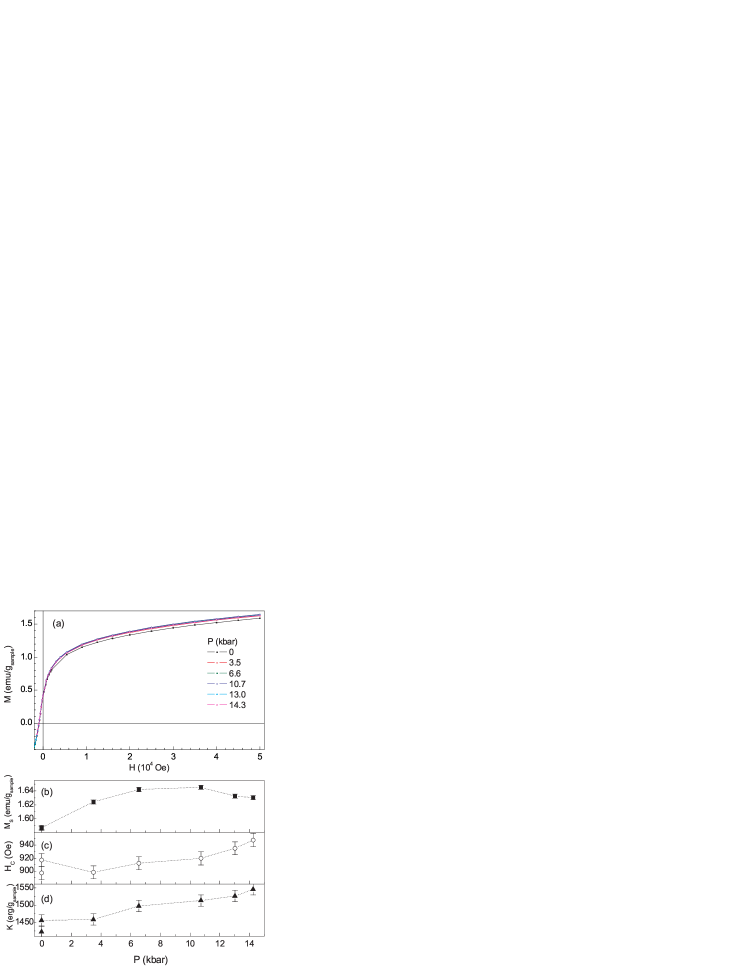
At low temperature, magnetization shows hysteresis with field [Fig.3(a)]. The coercive field and the magnetization at the maximum field used in the experiment (denoted as ) are pressure dependent, increasing and decreasing with pressure, respectively [Fig.3(b) and (c)]. Taking into account these two dependencies it is possible to evaluate the pressure dependence of the effective anisotropy constant , since . Despite the opposite trends of and , increases with pressure, anticipating a pressure dependence of the anisotropy energy barrier.
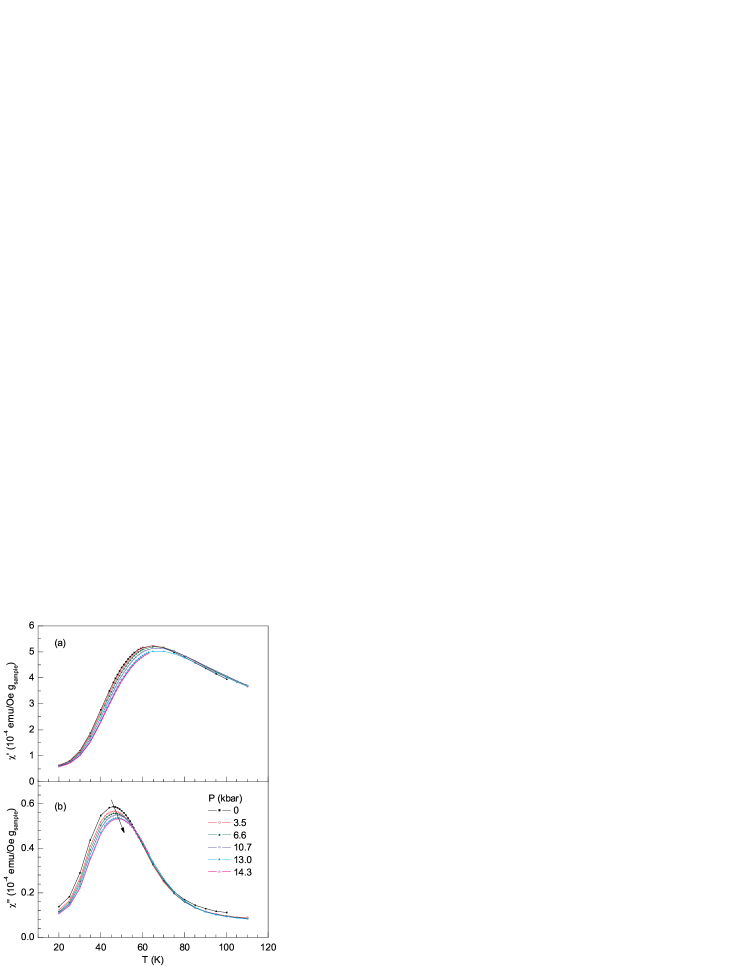
The temperature dependence of the ac susceptibility at room pressure of the hollow and solid sample shows the characteristic features of superparamagnetic NPs with a distribution of energy barriers undergoing an unblocking process as temperature increases from 20 to 100 K, showing a frequency () dependent maximum with temperature (blocking temperature ) at around K (Fig.4). With the increase of pressure, at a fixed frequency increases to higher temperatures.
At a given pressure, follows a Néel-Arrhenius relation, ) as usually found in superparamagnetic NPsNeel_arrhenius ; Brown . Here is a microscopic characteristic time, is the characteristic measurement time equal to and is the anisotropy energy barrier, usually expressed as the product between and the NPs average volume . From the Néel-Arrhenius relation, the pressure dependence of can be estimated (Fig.5). Qualitatively, the pressure dependence of is similar in the solid, hollow and polymer-grown maghemite NPs (, and ), increasing with pressure in the studied range. The increase of is in accordance with the increase of determined from the magnetization results.
A better insight on the relation between obtained for the three studied samples is obtained by plotting two of them as a function of the third (Fig.6). Since of the three samples was estimated at different pressure values, a simple interpolation procedure was applied. In the plot of Fig.6, the similitude between the pressure dependence is apparent as a linear dependence between of the solid NPs and those of the hollow and polymer-grown NPs. Interestingly, while is simply proportional to with the linear extrapolation crossing the (0,0) point, is proportional to with the linear extrapolation crossing the x-axis at a positive value, such that
| (1) |
This means that the pressure dependence of the polymer-grown NPs and that of the solid maghemite NPs has the same physical origin, differing only by a constant term reflecting the different value of both samples at ambient pressure, associated with their different and . On the other hand, the slope of the dependence is quite close to 1 while when extrapolates to zero, has still a non-zero contribution of the order of 627 K. In a first approximation, this can be regarded as the having two components; one component displaying a behavior similar to that of (the linear contribution) and a second component which is absent in (the non-zero contribution at ). By geometrical arguments, the component common to both solid and hollow sample is the surface, while the second component present in the solid sample and absent in the hollow one is the core. This suggests that associated with the surface has the most relevant pressure dependence while associated with the core has a relevant contribution at ambient pressure, being almost pressure independent.


IV Conclusions
In summary, it was shown that the anisotropy energy of solid maghemite NPs prepared by different routes of synthesis have a similar pressure dependence, while the anisotropy energy of solid and hollow maghemite NPs show different pressure dependence. This difference is due to the different geometry of the NPs and with the larger pressure response of the shell.
Acknowledgments
The Aveiro- Barcelona collaboration has been supported by the Integrated Spanish-Portuguese Action under the Grant No. AIB2010PT- 00099. The Aveiro-Zaragoza collaboration has been supported by the Integrated Spanish-Portuguese Action PT2009-0131. The work in Zaragoza has been supported by the research grants MAT2011-27233-C02-02, MAT2011-25991 and CONSOLIDER CSD2007-00010 from the Ministry of Education. The financial support of the CSIC and Spanish Ministerio de Ciencia e Innovación (PI201060E013) is also acknowledged. The work in Japan was supported by a Grant-in-Aid for Scientific Research (C) (No. 23550158) from the Ministry of Education, Culture, Sports, Science and Technology (MEXT), Japan. Ò. I. and A. L. acknowledge funding of the Spanish MICINN through Grant No. MAT2009-08667 and No. CSD2006-00012, and Catalan DIUE through project No. 2009SGR856. N. J. O. S. acknowledges FCT for Ciencia 2008 program.
Bibliography
References
- (1) T. Tajiri, S. Saisho, Y. Komorida, M. Mito, H. Deguchi, and A. Kohno, J. Appl. Phys. 110, 044307 (2011).
- (2) Y. Komorida, M. Mito, H. Deguchi, S. Takagi, A. Millán, and F. Palacio, J. Magn. Magn. Mater. 310, e800 (2007).
- (3) Y. Komorida, M. Mito, H. Deguchi, S. Takagi, A. Millán, N. J. O. Silva, M. A. Laguna, and F. Palacio, J. Magn. Magn. Mater. 322, 2117 (2010).
- (4) Y. Komorida, M. Mito, H. Deguchi, S. Takagi, A. Millán, N. J. O. Silva, and F. Palacio, Appl. Phys. Lett. 94, 202503 (2009).
- (5) J. M. D. Coey, Phys. Rev. Lett. 27, 1140 (1971).
- (6) B. Martínez, X. Obradors, L. Balcells, A. Rouanet, and C. Monty, Phys. Rev. Lett. 80, 181 (1998).
- (7) A. Millán, A. Urtizberea, F. Palacio, N. J. O. Silva, V. S. Amaral, E. Snoeck, and V. Serin, J. Magn. Magn. Mater. 312, L5 (2007a).
- (8) R. H. Kodama, A. E. Berkowitz, E. J. McNiff Jr., and S. Foner, Phys. Rev. Lett. 77, 394 (1996).
- (9) R. H. Kodama and A. E. Berkowitz, Phys. Rev. B. 59, 6321 (1999).
- (10) O. Iglesias and A. Labarta, Phys. Rev. B. 63, 184416 (2001).
- (11) A. Cabot, V. F. Puntes, E. Shevchenko, Y. Yin, L. Balcells, M. A. Marcus, S. M. Hughes, and A. P. Alivisatos, Journal of the American Chemical Society 129, 10358 (2007), eprint http://pubs.acs.org/doi/pdf/10.1021/ja072574a, URL http://pubs.acs.org/doi/abs/10.1021/ja072574a.
- (12) A. Cabot, A. P. Alivisatos, V. F. Puntes, L. Balcells, O. Iglesias, and A. Labarta, Phys. Rev. B 79, 094419 (2009), URL http://link.aps.org/doi/10.1103/PhysRevB.79.094419.
- (13) A. Millán, F. Palacio, A. Falqui, E. Snoeck, V. Serin, A. Bhattacharjee, V. Ksenofontov, P. Gütlich, and I. Gilbert, Acta Mater 55, 2210 (2007b).
- (14) A. Fujiwara, K. Ishii, T. Watanuki, H. Suematsuand, H. Nakao, K. Ohwada, Y. Fujii, Y. Murakami, T. Mori, H. Kawada, et al., J. Appl. Crystallogr. 33, 1241 (2000).
- (15) G. J. Piermarini, S. Block, J. D. Barnett, and R. A. Forman, J. Appl. Phys. 46, 2774 (1975).
- (16) J. Rodríguez-Carvajal, Physica B 192, 55 (1993).
- (17) M. Mito, J. Phys. Soc. Jpn. Suppl. A 76, 182 (2007).
- (18) L. D. Jennings and C. A. Swenson, Phys. Rev. 112, 31 (1958).
- (19) L. Néel, Ann. Geophys. 5, 99 (1949).
- (20) W. F. Brown Jr., Phys. Rev. 130, 1677 (1963).