A systematic survey for eruptive young stellar objects using mid-infrared photometry
Abstract
Accretion in young stellar objects (YSOs) is at least partially episodic, i.e. periods with high accretion rates (’bursts’) are interspersed by quiescent phases. These bursts manifest themselves as eruptive variability. Here we present a systematic survey for eruptive YSOs aiming to constrain the frequency of accretion bursts. We compare mid-infrared photometry from Spitzer and WISE separated by yr for two samples of YSOs, in nearby star forming regions and in the Galactic plane, each comprising about 4000 young sources. All objects for which the brightness at 3.6 and 4.5 is increased by at least 1 mag between the two epochs may be eruptive variables and burst candidates. For these objects, we carry out follow-up observations in the near-infrared. We discover two new eruptive variables in the Galactic plane which could be FU Ori-type objects, with K-band amplitudes of more than 1.5 mag. One object known to undergo an accretion burst, V2492 Cyg, is recovered by our search as well. In addition, the young star ISO-Oph-50, previously suspected to be an eruptive object, is found to be better explained by a disk with varying circumstellar obscuration. In total, the number of burst events in a sample of 4000 YSOs is 1-4. Assuming that all YSOs undergo episodic accretion, this constraint can be used to show that phases of strong accretion (yr-1) occur in intervals of about yr, most likely between 5000 and 50000 yr. This is consistent with the dynamical timescales for outflows, but not with the separations of emission knots in outflows, indicating that episodic accretion could either trigger or stop collimated large-scale outflows.
keywords:
stars: low-mass, brown dwarfs; stars: activity; stars: pre-main-sequence; accretion, accretion discs1 Introduction
Accretion flows from a circumstellar disk onto a young stellar object (YSO) play a key role in the early evolution of objects over a wide range of masses, from massive Herbig Ae/Be stars to brown dwarfs. Observations suggest that the accretion process is non-steady, with episodic bursts with high rates of mass accretion interspersed by significantly longer quiescent phases. The evidence for episodic accretion rests on three findings: 1) the fact that the luminosities of most protostars are dominated by internal radiation, not by heating due to accretion (e.g. Evans et al., 2009); 2) the discontinuities seen in protostellar outflows, which constitute a fossil record of the accretion history (e.g. Ioannidis & Froebrich, 2012); 3) the discovery of a small number of eruptive variables which are currently experiencing strongly enhanced accretion rates with respect to the typical YSOs, with FU Ori as the prototype (e.g. Hartmann & Kenyon, 1996; Reipurth & Aspin, 2010).
While the general idea of episodic accretion is well-established, the driving force of the bursts is not known yet. In general, these events are explained in the framework of various disk instabilities, e.g. thermal instabilities (see Bell & Lin, 1994, and references therein), gravitational instabilities (Vorobyov & Basu, 2005; Dunham & Vorobyov, 2012), or different types of magnetic instabilities (Armitage et al., 2001; Martin & Lubow, 2011; Zhu et al., 2009). In addition, various types of trigger events are discussed in this context, e.g. star-star encounters (Forgan & Rice, 2010), star-disk encounters (Pfalzner, 2008), tidal effects from a companion star (Bonnell & Bastien, 1992), or interactions between the disk and a massive planet (Lodato & Clarke, 2004; Clarke et al., 2005). These various scenarios lead to specific predictions regarding the frequency and properties of bursts.
Strong accretion bursts may also be a relevant factor in the context of planet formation and could have an impact on the architecture and frequency of planetary systems. For example, the length of the ’lulls’ between bursts may limit the efficiency of planet formation via disk fragmentation (Stamatellos et al., 2011). FU Ori-type bursts, caused by gravitational instabilities, have also been suggested as events that provide the transient shock heating needed to explain the formation of chondrules (e.g. Boley & Durisen, 2008).
In this context, it may be useful to see accretion eruptions as a weather-like phenomenon in the disk (’disk weather’): a process that affects the physics of the disk, but is to some extent random and occurs on timescales that are extremely short compared with the disk lifetime. Observational studies on large samples are essential to constrain the characteristics of this process and to guide the theoretical work. So far, however, most FU Ori-type and other bursts have been found serendipitously, which does not allow to put rigorous constraints on their frequency. The advent of wide-area, infrared surveys of large numbers of star forming regions makes systematic surveys for accretion bursts feasible. In this paper we present the results from such a survey. The goal is to derive an estimate of the frequency of bursts using two epochs of mid-infrared photometry provided by the Spitzer and the WISE satellites. We aim to probe the largest sample of YSOs that is available for such a comparison, in total about 8000 objects covering a wide range of masses and ages.
2 The approach
2.1 The data
We aim to constrain the frequency of accretion bursts by comparing two epochs of mid-infrared photometry from Spitzer and WISE (Wright et al., 2010). Two of the channels used by these satellites can be compared with each other: IRAC1 and WISE1 with central wavelengths at 3.4-3.6 as well as IRAC2 and WISE2 at 4.5-4.6. The differences in these two bands between the two telescopes are minor and can be neglected here as we are only interested in variability with large amplitudes. The epoch difference between the Spitzer and WISE observations depends on the area of the sky; the samples of YSOs used in this paper have been observed by Spitzer between 2003 and 2006, whereas most of the WISE data has been taken in 2010. Thus, the epoch differences in our samples are 4-7 yr, with a typical value of yr.
2.2 A simplified model for episodic accretion
With two epochs we can only test for a specific type of episodic accretion. We will search for objects undergoing a burst event with a rise time and a decline time , where and are assumed to be shorter and longer than our typical epoch difference of 5 yr, respectively. We also assume that any additional variability in YSOs is small compared with the events caused by the accretion bursts. These conditions are fulfilled for most, but not all, of the known FU Ori type objects. One exception is V1515 Cyg, one of the best-studies FU Ori objects, which exhibits a long rise time of about 20 yr (Clarke et al., 2005). In general, the known FU Oris show considerable diversity in their lightcurves which is not represented in this simple model. The quantity we are aiming to constrain is the typical interval between consecutive bursts. According to previous estimates, this interval is in the order of several thousands of years and thus much longer than the typical duration of a burst (Herbig, 1977; Hartmann & Kenyon, 1996).
When comparing two epochs of photometry, the burst interval can be crudely estimated as . Here is the epoch difference between the two observations, the sample size, the number of detected bursts in that sample, and the desired quantity. This simple relation serves as a useful starting point for the analysis; for a more accurate statistical evaluation we will use Monte-Carlo simulations (Sect. 5). It is clear that maximum information can be gained by maximising the sample size and the epoch difference. For our study the epoch difference is fix, i.e. the key is to make the sample as large as possible. For example, with yr, we need in the order of 1000 objects to have a substantial chance of detecting at least one event, if the interval between bursts is 5000 yr. Based on the expected intervals, we thus need to cover several thousands of young stars to be able to provide useful limits.
In the literature the quantity that is often used to describe episodic accretion is the ’duty cycle’, i.e. the fraction of time a YSO spends in the FU Ori state. Measuring the duty cycles requires knowledge of the duration of accretion bursts. Since the slow decline is much more difficult to constrain from direct observations than the fast rise of an accretion burst, we focus here on the burst interval rather than the duty cycle.
We note that with our approach we do not make an attempt to distinguish between the various types of accretion bursts presented in the literature, with FU Oris as the most extreme examples and EXors as smaller events (see Reipurth & Aspin, 2010). We are simply interested in any type of eruptive event in a YSO, which could be due to an increase in mass accretion rate.
2.3 Flux increase during accretion bursts
Objects undergoing an accretion burst manifest themselves as eruptive variables with strongly increased luminosities at all optical and infrared wavelengths. Assuming that all the gravitational energy from infalling material is converted to radiation, the additional luminosity from an accretion rate of yr-1, exceeds the solar luminosity by more than one order of magnitude (factor 15, assuming a star with and ). To evaluate how this additional energy is distributed across the spectrum, we used the Monte Carlo radiative transfer models discussed in detail in Scholz et al. (2006) (see also Robitaille et al. (2006) for more information). In short, the code is based on the following assumptions: 1) NextGen stellar atmospheres are used for the photospheric spectrum; 2) the grain size distribution in the disk follows a power law with an exponential decay for particles with sizes above 50 and a formal cutoff at 1 mm; 3) dust in regions close to the star is destroyed if the temperature is above the dust sublimation threshold; 4) the scaleheight of the disk increases with radius following ; 5) the accretion luminosity is split between disk and star, where the stellar part is distributed evenly over the stellar surface (i.e. no hot spots).
For the purposes of this paper, we do not aim to explore in detail the parameter space; instead we want to find a typical value for the flux increase in a given wavelength domain as a function of accretion rate. We also neglect the fact that a strong increase in the mass accretion rate will affect the structure of the disk. In Fig. 1 we show model SEDs for a prototypical Class I source (stellar mass 0.5, disk mass 0.1, envelope mass 2.0) and for a prototypical Class II source (stellar mass 0.5, disk mass 0.01, no envelope), for a range of accretion rates from 0.0 to yr-1. These figures illustrate that the flux increase at 2-5 compared with the zero accretion case is around one order of magnitude for accretion rates of yr-1 or larger.
Fig. 1 warrants two additional comments: 1) At all accretion rates, the amplitude is substantially larger for the Class II prototype. This is caused by the presence of an envelope in the Class I system, combined with its high photospheric luminosity, which is due to the inflated radius of the central source. The additional infrared flux from the envelope, heated by a brighter central source, ’drowns’ the contribution from the accretion, i.e. the relative flux increase due to accretion is smaller than in the Class II stage. 2) The model with the lowest fluxes corresponds to a (theoretical) accretion rate of zero. In practise, this model is indistinguishable from models with yr-1 or lower, values which are frequently measured for T Tauri stars (Natta et al., 2006). This illustrates that for most T Tauri stars accretion does not contribute significantly to the mid-infrared flux.

This exercise suggests that Class I and II sources whose accretion rate increases to yr-1 or more are expected to increase in brightness by at least 2.5 mag at near/mid-infrared wavelengths. In contrast, the typical, short-term, near/mid-infrared variations in large samples of YSOs, due to rotation, hot spots, and inner disk inhomogenities, are in the range of 0.1-0.6 mag (Morales-Calderón et al., 2011; Flaherty et al., 2012). In our Spitzer-WISE comparison we will therefore adopt a cutoff of 1.0 mag to select burst candidates. On one hand, this should avoid most of the other types of variability in these sources; on the other hand it should also select eruptions where the two epochs of photometry do not catch the maximum and minimum.
3 Identification of burst candidates
In the following section, we will discuss the selection of possible eruptive variables and thus burst candidates from archival Spitzer and WISE photometry, as well as the follow-up observations and their results.
3.1 The C2D catalogue
The ’Cores to Disks’ (C2D) Spitzer legacy program has provided a catalogue of YSO candidates for nearby molecular clouds and small cores, identified using near- and mid-infrared colour criteria (Evans et al., 2009). In total, the catalogue comprises 1478 sources from the subsamples CLOUDS, OFF-CLOUD, CORES, and STARS. We obtained this list from IPAC and searched for matches in the WISE all-sky catalogue (Wright et al., 2010). For 1323 objects a match was found within 2”, for the overwhelming majority of them the distance between Spitzer and WISE coordinates is well below 1”. 1301 of these objects have a robust detection in the Spitzer and WISE channels at 3.6 and 4.5 (signal-to-noise ratio for WISE, error % for Spitzer). 1296 of these are also robustly detected in the Spitzer channels at 5.8 and 8.0.
In Fig. 2 (left panel) we show the IRAC colour-colour plot for this sample. Two cumulations, around the origin and right of the origin of the diagram, are clearly seen and can be identified as the locus of the Class III (no disk) and II sources. The sample contains 115 objects with typical Class III colours (around the origin) and 324 with typical Class II colours (right of the origin). 249 objects are above the Class II box, which makes them good candidates for embedded Class I sources. The remaining sources are scattered around these areas. According to Evans et al. (2009), about one third of the CLOUDS subsample are in the early embedded stage (Class I or Flat).
In addition, Fig. 2 (right panel) shows the (J,J-K) colour magnitude diagram for the 1228 sources with 2MASS near-infrared photometry in the sample, to assess the properties of the central sources. Overplotted are the BCAH 1 Myr isochrones (Baraffe et al., 1998) which range from 0.02 to 1.4, for distances of 150 pc and 300 pc, bracketing the regions covered by C2D, and for , 10, and 20 mag. The comparison with the models illustrates that the sources cover the low-mass regime down to the substellar limit, including brown dwarfs at low extinctions, but only relatively few objects with . About two thirds to three quarters of the sample have extinctions below mag.


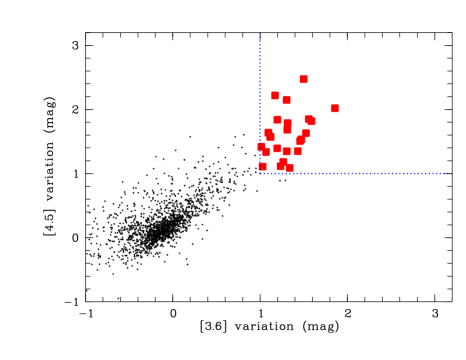
In Fig. 3 (left panel) we illustrate the selection of variables from this sample. The differences in the magnitudes at 3.6 and 4.5 between C2D and WISE show a clear cumulation around (0,0), as expected, because these bandpasses of IRAC and WISE are comparable. The objects of interest to us are located in the upper right corner. 23 sources are more than 1 mag brighter in WISE compared with C2D in the two bands, providing evidence for a substantial increase in the brightness. These objects are also overplotted in Fig. 2, as far as they have the required photometry (22 in the left panel, 20 in the right panel). They do not show an obvious bias in the (J,J-K) diagram, but most of them are above the Class II locus in the IRAC colour-colour plot, indicating that they may be embedded Class I sources.
All 23 highly variable sources were checked individually in the available images from WISE, Spitzer, and 2MASS. 5 of them are galaxies in 2MASS images and can be ruled out. For the remaining we obtained the C2D and WISE images at 3.6 and 4.5 and compared them. In at least 4 cases the flux increase in the WISE catalogue can be attributed to close neighbours that were not resolved with WISE, due to its significantly broader PSF (6” vs. 2”, see Wright et al. (2010)). For 8 others, the IRAC photometry is affected by saturation. 4 more are extended objects in the IRAC images and could be part of a protostellar outflow. For the remaining 2, no obvious reason for the flux difference in the C2D and WISE catalogues can be identified, but the images clearly show that the object did not become significantly brighter. Thus, none of the candidates from the C2D sample classifies as a burst candidate.
3.2 The Cluster catalogue
The second sample is derived from the catalogue of YSOs in clusters within 1 kpc published by Gutermuth et al. (2009). The list of 2548 objects has been selected based on Spitzer/IRAC and MIPS data using mid-infrared colour cuts. It covers 36 nearby clusters, star forming clouds, and young groups, including some overlap with the regions covered in the C2D sample. We obtained the catalogue from Vizier and cross-matched with the WISE database. 1796 objects have a WISE match within 2”, 1672 of them within 1”. 1745 have a robust detection (criteria as above) in the 3.6 and 4.5 channels of Spitzer and WISE, 1587 of them with additional data in the J- and K-band from 2MASS, 1642 of them with data in the two IRAC channels at 5.8 and 8.0. Note that 380 objects from the Cluster sample are also contained in the C2D sample.


As for the C2D sample, we show the IRAC colour-colour plot and the (J, J-K) near-infrared colour-magnitude diagram for this sample in Fig. 4. In contrast to the C2D sample, the Cluster objects do not contain a significant fraction of Class III sources, the majority is classified as Class II. Based on our diagram, we estimate that at least 1226 out of 1642 are Class II (75%), the classification provided by Gutermuth et al. (2009) yields an even higher fraction of 86%. About 15-20% objects in this sample are Class I.
In the near-infrared plot we show the 1 Myr BCAH isochrones for distances of 200 and 800 Myr, bracketing most of the objects in the sample, for three different extinctions. The plot demonstrates that the sample is dominated by low-mass stars at extinctions of mag. The sample includes substellar objects, but only for the regions with distances pc and low extinctions. In general, the characteristics of this sample make it comparable to the C2D sample.
Fig. 3 (right panel) shows the variability in the Cluster sample. 24 objects fulfill our variability criterion and have an increased brightness by mag in the WISE catalogue in the two bands. One of these objects has already been identified in the C2D sample. As before, these burst candidates were checked in the available images. Seven of them have close, usually brighter neighbours, which may have caused an apparent brightness increase. For 7 others the brightness in WISE is probably affected by the surrounding nebulosity. Four more are saturated in the Spitzer/IRAC images. We are left with 5 candidates which appear to be brighter in the WISE images and remain burst candidates. One of them, ISO-Oph-50 in the star forming region -Ophiuchus, has been suspected to be an outbursting young star by Alves de Oliveira & Casali (2008), due to a brightening by more than 1 mag over about a year, although it could also be a different type of variable (Alves de Oliveira et al., 2012) – see discussion in Sect. 4.1.
3.3 Complementary samples similar to C2D and Cluster
We carried out the same test as above in three smaller samples of YSOs, gathered from the literature.
According to Gutermuth et al. (2009), the Cluster sample covers all clusters within 1 kpc from the Lada & Lada (2003) census, with the exception of NGC2264 and the Orion Nebula Cluster. For NGC2264 there is a comprehensive catalogue of the Spitzer photometry available (Sung et al., 2009), which allows us to include it in this study. Out of the 490 cluster members identified by H photometry by Dahm & Simon (2005), 485 have a Spitzer counterpart within 3”. Out of these, 355 have a WISE counterpart within 3” with robust photometry (defined as in the other samples). From this list, 5 objects have increased their brightness in the two mid-infrared bands by at least 1 mag. Two of them have little H emission ( Å) and very low IRAC colours (I1-I2 ), which rules out that they harbour a disk. Two sit very close to bright stars (or multiple stars) which contaminate their WISE fluxes. One has a nearby equally bright neighbour which is not resolved in WISE. To sum up, none of the likely members of NGC2264 is a burst candidate.
For the nearby star forming region Taurus, Rebull et al. (2010) published a census of previously confirmed members and new candidate members based on Spitzer photometry. Combining their list of known and new objects and exluding a few without IRAC photometry yields 328 objects from which 236 have previously been known or have been classified by Rebull et al. (2010) as ’most believable’. From this sample of 328, 320 have robust photometry in the first two WISE bands. Only one of them is more than 1 mag brighter in the WISE photometry compared with the Spitzer magnitudes; this object, however, exhibits a ’halo’ and is probably a galaxy.
Another new sample of YSOs from Spitzer data has been published for the various clusters in the North American and Pelican Nebulae (Rebull et al., 2011). Their total sample comprises 1286 IRAC and MIPS-selected candidate YSOs, about half of them Class II. 1099 have reliable fluxes in the first two IRAC and WISE channels. From these, 935 objects have membership are most likely YSOs with flag ’A’ or ’B’ (Rebull et al., 2011). This ’A+B’ sample may still be affected by significant contamination by AGB stars, estimated to be between 5 and 25% by (Rebull et al., 2011). Conservatively subtracting about 20% reduces the total sample size to about 700.
Four objects fulfill our variability criterium (flux increase by more than 1 mag). One of them appears to be extended in the Spitzer images (and has membership flag ’C’), for another one the WISE photometry is contaminated by several neighbours. The remaining two are isolated and clearly brighter in the WISE images and remain candidates. One of them is the recently identified outbursting star V2492 Cyg (Covey et al., 2011) and has magnitude differences close to 3 mag at 3.6 and 4.5. This object became brighter between December 2009 and June 2010 (Kóspál et al., 2011) and was observed by WISE between June and September 2010, i.e. just after the burst.
Note that this region harbours two more known outbursting stars. The recently identified FU Ori candidate V2493 Cyg (Miller et al., 2011; Kóspál et al., 2011) increased its brightness between May and August 2010 and was observed at the end of May with WISE. We find a flux increase by 0.5 and 0.8 mag in the mid-infrared channels at 3.6 and 4.5, i.e. the Spitzer-WISE comparison may have captured the onset of the burst.
The well-known FU Ori star V1057 Cyg with an outburst in 1969 (Welin, 1971) is not contained in the Rebull et al. (2011) catalogue, presumably due to saturation: The star is listed in the WISE catalogue with 4.9 mag at 3.6 and -0.3 mag at 22, which is brighter than the upper limits in the colour-magnitude plots shown by Rebull et al. (2011).
All three additional samples discussed here show similar characteristics to the C2D and Cluster sample (similar mass range, similar extinction range, mostly Class II sources). Therefore it is legitimate to add them to the C2D and Cluster samples. In total, the sum of C2D, Cluster, NGC2264, Taurus, and North American/Pelican Nebulae, minus the objects which appear twice, comprises about 4000 objects, hereafter called sample A. This sample yields 7 candidate bursts, out of which 2 have been independently discovered elsewhere.
3.4 The Robitaille catalogue
Furthermore, we use the list of intrinsically red sources from Robitaille et al. (2008). This sample contains 18949 objects selected from the Glimpse I and II survey data (Benjamin et al., 2003; Churchwell et al., 2009). Robitaille et al. (2008) estimate that 50 % – 70 % of the objects are YSOs and 30 % – 50 % are AGB stars. The YSOs in the Robitaille list are expected to be more distant than 1 kpc and thus on average more massive than the sources covered in sample A. The Robitaille catalogue is in the following called sample B.
From the full sample we select only objects which have a detection at 3.6 and 4.5 m in Glimpse and WISE, whereby the positions in the two surveys do not differ by more than one arcsecond. This leaves 12961 targets. To make the sample as ’clean’ as possible, we only consider sources which are brighter than the completeness limit in this sample (11.5 mag at 3.6 m, 11.0 mag at 4.5 m) in both surveys. Here the completeness limit was determined as the peak in the 3.6 and 4.5 m magnitude distribution.
One potential issue of this sample is the high stellar density in the Galactic plane. Since the WISE survey has a larger point spread function than Spitzer, the presence of bright neighbour stars can cause an apparent increase in the brightness, when the two surveys are compared. To account for that, we exclude all objects that have a nearby Glimpse source (within 6” of the Robitaille object) that is bright enough to cause an increase of more than 0.1 mag in either the 3.6 or 4.5 m filter. This final sample contains 7101 objects, which are, as mentioned above, a mix of YSOs and AGB stars.
In Fig. 5 we show the usual IRAC colour-colour plot and (J,J-K) colour-magnitude diagram for a subsample of the Robitaille catalogue that is most likely to be dominated by YSOs (see Appendix A on the selection of this subsample). As in the other samples, most of the sources can be considered Class II based on their mid-infrared colours. As expected, the typical colours are larger than in sample A, indicating higher extinction.
Out of these 7101 sources, there are 77 objects which increase their brightness by more than one magnitude at 3.6 and 4.5 m (see Fig. 6) and are possible candidates for outbursting YSOs. 72 of them have a detection in the two WISE bands. As for the other samples, we checked the Spitzer and WISE images for all these candidates. For the clear majority of them (60/77) it turns out that they have neighbour star in 10” distance or less, which likely affects the WISE photometry. This indicates that the 6” criterion chosen in the preparation of the catalogue (see above) to account for the broad WISE PSF was slightly too conservative. In addition, there are 7 objects within a nebulosity. Again, this might cause problems in the WISE photometry. In all these cases the image comparison excludes that the objects are in fact significantly brighter in the WISE survey. The remaining 10 sources remain good candidates and require further evaluation.
Glimpse provides for a fraction of the total area multiple epochs of Spitzer photometry with baselines up to 1 yr, particularly in the additional Glimpse-II survey. Based on this information, the Glimpse catalogues exclude variable sources for their final merged photometry. The Robitaille list, on the other hand, uses the Glimpse-II first epoch photometry, and thus attempts to exclude as few variables as possible (Robitaille et al., 2008), making this sample suitable for our purposes.
In Appendix A we provide an estimate of the contamination by AGB stars in the Robitaille catalogue, both in the entire sample and in the subsample of variable sources. Among the variable candidates, the contamination is negligible. The total sample of 7101 objects should contain about 3700-3800 YSOs; the remaining sources are probably AGBs.


4 Follow-up observations
We summarise the results from the previous section and the selection of burst candidates in Table 1, As outlined above, about 130 of the objects in the samples considered here show the signature of a brightness eruption when comparing Spitzer and WISE photometry (listed as ’highly variable’ in Table 1), but most of them are clearly spurious based on an inspection of the images. To verify our candidates, we re-observed a subset of them in the near-infrared. This was particularly important for objects which are confirmed to be brighter in WISE after visual inspection (’burst candidates’). If any of these sources is indeed a burst (as defined in Sect. 2), we expect it to be several magnitudes brighter in the near-infrared compared with 2MASS. In total, we observed 20 from the highly variable objects, including 13 out of 17 burst candidates. By design, these observations also covered some of the spurious detections, to double-check our rejection based on visual examination.
| Sample | No. |
|---|---|
| C2D total (Sect. 3.1) | 1478 |
| – with WISE | 1301 |
| – highly variable | 23 |
| – burst candidates | 0 |
| Cluster total (Sect. 3.2) | 2548 |
| – with WISE | 1745 |
| – highly variable | 24 |
| – burst candidates | 5 |
| Complementary (Sect. 3.3) | |
| – NGC2264 with WISE | 355 |
| – Taurus with WISE | 320 |
| – NaP with WISE | 935 |
| – highly variable | 10 |
| – burst candidates | 2 |
| Robitaille, (Sect. 3.4) | 18949 |
| – cleaned, with WISE | 7101 |
| – highly variable | 77 |
| – burst candidates | 10 |
We used the 1.3 m telescope at the Cerro Tololo International Observatory with the instrument Andicam, a double-channel camera which allows us to take optical and near-infrared images simultaneously. The follow-up observations were taken as part of the SMARTS collaboration in program DUBLIN-11B-001 and DUBLIN-12A-001 (PI: A. Scholz). For all objects we obtained optical images in the R- and I-bands ( sec exposures) and near-infrared images in the J- and either K- or H-band ( sec in a 5-position dither pattern), but only the near-infrared images are used here, since most objects are embedded and hence invisible in the optical.
We carried out a standard image reduction, including sky subtraction and flatfielding, and aperture photometry. The near-infrared photometry was calibrated in comparison with 2-5 other stars in the images, which are listed in the 2MASS point-source catalogue. For about half of the objects the new photometry is consistent with the 2MASS values, i.e. the variation in the mid-infrared cannot be caused by a long-lasting eruptive event. Most of the remaining objects have only variations with mag, which is too little to qualify as an accretion burst according to our criterion (see Sect. 2). We list these excluded objects in Table 2. In particular, our follow-up observations confirmed that none of the highly variable objects seen as spurious in the visual inspection was misclassified.
| (J2000) | (J2000) | Sample | 3.6 | 4.5 | J2M | K2M | SMARTS photometry | Comments |
|---|---|---|---|---|---|---|---|---|
| 15 42 20.96 | -52 48 46.4 | A | 1.744 | 1.732 | 13.879 | 7.944 | J=13.9, K=8.0 (12-07-18) | |
| 15 42 31.06 | -52 47 16.9 | A | 2.814 | 1.250 | 9.636 | 7.390 | J=9.6, K=7.4 (12-07-18) | saturation in Spitzer |
| 16 31 33.84 | -24 04 46.8 | A | 1.010 | 1.624 | 12.526 | 10.049 | J=12.9, K=9.5 (12-05-02) | saturation in Spitzer |
| 18 29 01.76 | 00 29 47.3 | A | 1.210 | 2.393 | 11.170 | 9.215 | J=11.2, K=9.2 (12-05-08) | companion in WISE |
| 20 06 57.23 | 27 26 35.8 | A | 1.171 | 2.219 | - | - | J16.5, K15 (12-09-09) | |
| 06 07 29.50 | -06 24 45.3 | A | 1.094 | 1.639 | - | 13.962 | J16.5, K=13.4 (12-09-11) | variable1 |
| 14 32 27.34 | -60 56 26.9 | B | 1.685 | 1.524 | 14.695 | 12.263 | J=15.0, K=12.5 (12-06-04) | bright neighbour |
| 16 02 24.58 | -51 28 47.7 | B | 1.854 | 1.924 | 14.922 | 12.439 | J=14.7, K=12.1 (12-06-07) | bright neighbour2 |
| 14 50 13.85 | -59 03 54.8 | B | 2.272 | 2.583 | 13.433 | 12.035 | J=13.4, K=11.9 (12-06-22) | bright neighbour |
| 17 22 21.08 | -37 33 29.1 | B | 1.690 | 1.782 | 14.103 | 12.304 | J=14.5, K=12.4 (12-06-24) | bright neighbour |
| 16 17 36.21 | -50 56 01.8 | B | 1.136 | 1.106 | - | 10.974 | J16.5, K=11.4 (12-09-10) | neighbours |
| 16 38 15.17 | -47 48 24.4 | B | 1.113 | 1.593 | - | 11.140 | J16.5, K=13.1 (12-07-22) | variable1 |
| 18 15 13.88 | -17 21 06.0 | B | 1.078 | 1.407 | 12.488 | 11.625 | J=12.5, H=12.1 (12-08-05) | |
| 18 18 18.42 | -16 27 09.8 | B | 1.437 | 1.412 | - | 11.909 | J16.5, H15.0 (12-08-07) | |
| 18 53 58.11 | +01 43 44.4 | B | 1.240 | 1.655 | - | 12.702 | J16.5, K=13.5 (12-08-19) | variable1 |
| 18 57 47.12 | +03 30 16.9 | B | 1.232 | 1.457 | - | 13.393 | J15, K12 (12-08-20) | affected by clouds |
| 19 23 52.82 | +14 38 03.5 | B | 1.484 | 1.510 | - | 13.814 | J=15.6, K=12.9 (12-08-24) | neighbours |
1 variability does not match the typical signature of an accretion burst
2 object identification ambiguous, two sources in aperture
| (J2000) | (J2000) | Sample | 3.6 | 4.5 | J2M | K2M | Comments |
| 03 27 05.84 | +58 43 47.8 | A | 1.458 | 1.507 | - | 14.846 | in AFGL490 |
| 16 26 36.82 | -24 19 00.3 | A | 1.526 | 1.631 | 16.823 | 14.756 | ISO-Oph-50, Sect. 4.1 |
| 20 50 09.40 | +44 26 52.2 | A | 1.698 | 1.995 | - | 14.455 | Northamerica/Pelican |
| 20 51 26.23 | +44 05 23.9 | A | 2.911 | 2.903 | - | - | V2492 Cyg, Sect. 4.1 |
| 22 19 32.95 | +63 33 16.2 | A | 1.857 | 2.019 | 16.102 | - | in S140-North |
| 16 44 37.21 | -46 04 01.1 | B | 1.129 | 1.397 | - | 13.750 | 2M1644-4604, Sect. 4.1 |
| 15 11 13.68 | -59 02 36.1 | B | 1.050 | 1.289 | - | 12.541 | 2M1511-5902, Sect. 4.1 |
From the 17 burst candidates, we observed 13 and rejected 10 of them (contained in Table 2). The remaining 7 are listed in Table 3. Two objects not previously known are confirmed by our SMARTS photometry as eruptive variables and are good burst candidates: 2MASS J16443712-4604017 (hereafter 2M1644-4604) and 2MASS J15111357-5902366 (hereafter 2M1511-5902). These two objects, together with the two previously identified possible burst objects ISO-Oph-50 and V2592 Cyg, are discussed in more detail in Sect. 4.1. Three objects remain unconfirmed because they are too far north to be observed from Cerro Tololo. Given the fact that most of our candidates so far have been ruled out by follow-up observations, the likelihood that one of these three turns out to be bursts is fairly low.
4.1 Comments on specific objects
ISO-Oph-50: As pointed out in Sect. 3.2, one of the candidates from the Cluster sample, ISO-Oph-50 (or CFHTWIR-Oph 30) was previously suspected to be an outbursting YSO (Alves de Oliveira & Casali, 2008), maybe of EXor type. Alves de Oliveira et al. (2012) measure an optical spectral type of M3.25 for this object. In Table 4 we list the available photometry in the H-band (the band with the most measurements) for this object, including a new value obtained from our SMARTS imaging on August 8 2012. Out of 6 epochs, 3 are around mag, while the others are around mag. In addition, there is evidence for significant variability on short timescales of days and weeks (Alves de Oliveira & Casali, 2008). This behaviour is not comparable to typical stars undergoing accretion-related eruptions. EX Lupi, probably the best studied YSO with short-term and recurring accretion bursts of EXor-type, had 4 bursts in 9 years between 1995 and 2004, but all four were different in amplitudes. Taken together, the bursts lasted in total about 1 year, i.e. % of the entire time (Herbig, 2007). ISO-Oph-50 is much more often found in the bright state. Also, as noted by Alves de Oliveira et al. (2012), the object becomes bluer when fainter, which is not typical for accretion-related bursts. It can safely be concluded that this source is not an accretion burst, in particular not a FU Ori object.
Apart from the variability, the most remarkable feature of ISO-Oph-50 is its low luminosity. At the age and distance of the -Oph star forming region, a M3 star would be expected to have an H-band magnitude of 8-10, i.e. even with mag it would be brighter than mag, whereas the object is never observed to be brighter than mag. The luminosity of this source, estimated from the J-band magnitude, is (Alves de Oliveira, priv. comm), which is more than two orders of magnitude too low for this spectral type. Given that and the colour trend in the variability, the variability is likely related to the disk. We speculate that the most likely cause for the variations is an rotating, inhomogenuous edge-on disk. Alves de Oliveira et al. (2012) come to a similar conclusion, but also invoke the presence of a (hypothetical) companion to explain the variations. Monitoring with simultaneous measurements in multiple bands and detailed modeling is needed to constrain the nature of this source.
| Epoch | H (mag) | Comments |
|---|---|---|
| 1993-94 | 13.93 | Barsony et al. (1997) |
| Apr 1999 | 16.01 | 2MASS |
| Apr 2005 | 15.91 | UKIDSS/GCS |
| May 2005 | 15.9 | Alves de Oliveira et al. (2008) |
| Jun 2006 | 13.3-14.7 | Alves de Oliveira et al. (2008) |
| Aug 2012 | 14.1 | SMARTS (also, mag) |
V2492 Cyg: This object was already known in the literature as an outbursting protostar although it does not fit into the FU Ori category (Kóspál et al., 2011; Covey et al., 2011). It was confirmed by our Spitzer-WISE comparison. Its magnitude differences in the mid-infrared are almost 3 mag and very large compared with most of our other candidates. In optical and near-infrared bands Kóspál et al. (2011) report amplitudes of more than 5 mag.
2M1644-4604: As pointed out above, this object was identified as a new eruptive variable and possible accretion burst. The available photometry for the object is summarised in Table 5, including near-infrared data from the first data release from the VISTA/VVV survey (Saito et al., 2012). In Fig. 7 we show the spectral energy distribution pre- and post-burst, including our new datapoints from 2012. In near-infrared data from 2010-12 the source is much brighter than in 2MASS – more than 4 mag in J, more than 3 mag in H, and more than 2 mag in K. The near-infrared photometry indicates significant evolution from 2010 to 2012. In addition, the object has become more than 1 mag brighter at 3.6 and 4.5. The WISE flux at is slightly brighter than the 24 from Spitzer as well. The difference in magnitudes is increasing towards shorter wavelengths, i.e. the object became bluer during the burst. The near-infrared photometry indicates a position below the reddening path, i.e. it is indeed a likely YSO (see Appendix A). Spectroscopic follow-up observations are in preparation, to confirm its youth and to look for evidence of enhanced accretion.
| Epoch | Band | Magnitude | Comments |
| 1999-05-20 | J | 17.34 | 2MASS |
| 1999-05-20 | H | 16.06 | 2MASS |
| 1999-05-20 | Ks | 13.75 | 2MASS |
| 2010-05-09 | J | 13.32 | VVV |
| 2010-05-09 | H | 12.67 | VVV |
| 2010-08-18 | Ks | 11.49 | VVV |
| 2012-07-28 | J | 13.58 | SMARTS |
| 2012-07-28 | H | 11.71 | SMARTS |
| 2012-09-15 | J | 13.53 | SMARTS |
| 2012-09-15 | Ks | 10.42 | SMARTS |
| 2004-09-05 | 3.6 | 10.74 | Glimpse |
| 2004-09-05 | 4.5 | 10.11 | Glimpse |
| 2004-09-05 | 5.8 | 9.27 | Glimpse |
| 2004-09-05 | 8.0 | 8.80 | Glimpse |
| 2006-10-03 | 24 | 3.29 | Robitaille et al. (2008) |
| 2010-06-021 | 3.6 | 9.548 | WISE |
| 2010-06-021 | 4.5 | 8.644 | WISE |
| 2010-06-021 | 12 | 6.925 | WISE |
| 2010-06-021 | 22 | 3.071 | WISE |
1 Several epochs from 2010-06-02 to 2010-06-05
2M1511-5902: This is the second possible new accretion burst identified in our survey. We summarise the available photometry, including our own follow-up, in Table 6. The spectral energy distribution is plotted in Fig. 7. Comparing pre-2010 with 2010 datapoints, the object is 1.5 mag brighter in K-band, 1.1 mag at 3.6 and 1.3 mag at 4.5. This trend is also seen at 22-24. Between 2010 and 2012 the changes are marginal, i.e. the brightening appears to be persistent. Similar to 2M1644-4604, the colours indicate that this is indeed a YSO, but more follow-up observations are needed to confirm the nature of the source and to make sure that the brightening is indeed due to enhanced accretion.
| Epoch | Band | Magnitude | Comments |
|---|---|---|---|
| 1999-07-07 | J | 17.59 | 2MASS |
| 1999-05-07 | H | 16.03 | 2MASS |
| 1999-07-07 | Ks | 12.54 | 2MASS |
| 2010-04-11 | J | 16.64 | VVV |
| 2010-04-11 | H | 13.39 | VVV |
| 2010-08-14 | Ks | 11.09 | VVV |
| 2012-08-14 | J | 16.76 | SMARTS |
| 2012-08-14 | Ks | 10.86 | SMARTS |
| 2012-09-12 | Ks | 11.16 | SMARTS |
| 2004-03-12 | 3.6 | 9.21 | Glimpse |
| 2004-03-12 | 4.5 | 7.93 | Glimpse |
| 2004-03-12 | 5.8 | 6.91 | Glimpse |
| 2004-03-12 | 8.0 | 6.10 | Glimpse |
| 2006-04-11 | 24 | 4.41 | Robitaille et al. (2008) |
| 2010-02-211 | 3.6 | 8.148 | WISE |
| 2010-02-211 | 4.5 | 6.578 | WISE |
| 2010-02-211 | 12 | 4.811 | WISE |
| 2010-02-211 | 22 | 3.761 | WISE |
1 Several epochs from 2010-02-21 to 2010-02-23


5 The statistics of accretion bursts
In this paper we have systematically searched for eruptive variables that may be accretion bursts fulfilling specific conditions outlined in Sect. 2.2. We find 1 known accretion burst and three more possible bursts in sample A and 2 probable bursts in sample B. In the following sections we will use this result to derive constraints on the typical interval between bursts and compare with other constraints from theory and observations. We will treat sample A and B separately, because they are significantly different in terms of the typical ranges of stellar masses – while sample A is dominated by low-mass stars with masses around or below 1, objects in sample B are much further away and will therefore have on average masses higher than 1.
5.1 Statistical estimate of the burst frequency
For one burst out of 4000 stars and an epoch difference of 5 yr a crude estimate following the arguments given in Sect. 2.2 gives a burst interval of 20000 yr. To obtain confidence intervals for this number, we implemented simple Monte-Carlo simulations: For a given burst interval, we calculated the probability that a star experiences a burst over a given epoch difference. For each star we then obtain a random number between 0 and 1 and count the ones for which this number exceeds the burst probability. This procedure was repeated over 10000 runs; then we can calculate the probability to find a given number of bursts (in our case one).
In Fig. 8 we show the results from this simulation when applied to the Spitzer-WISE comparison. For an epoch difference of 5 yr and a sample size of 4000 stars, the detection of one burst implies that we can rule out a burst interval below 20000 yr with 95% confidence. The upper limit is not well-defined due to the poor statistics. For two bursts, the 95% lower limit drops to around 10000 yr, for 4 bursts to 3000 yr. As noted above, 4 bursts is the most conservative upper limit we derive from our survey. Thus, from the Spitzer-WISE comparison we can derive a robust lower limit for the burst interval in the range of yr.
A similar type of simulation was used to derive an estimate of the burst frequency from the known FU Ori outbursts. Among the known FU Ori objects, 10 have an observed burst event, 9 of them between 1936 and 1999, the 10th probably before 1888 (Reipurth & Aspin 2010). Since most of these objects have been found serendipitously and outside systematic surveys, the choice of parameters (number of monitored stars and time baseline ) for the simulation is not trivial. For a rough estimate we assume that optical surveys based on photographic observations had access to at most about 1000 young stars in the solar neighbourhood. We note that a few more possible FU Ori outbursts have been found over the past 3 years (Miller et al., 2011; Reipurth et al., 2012; Caratti o Garatti et al., 2011).
In Fig. 9 we show the probability to find 10 bursts as a function of interval. For and yr the burst interval is in the range of 8000-12000 yr, with an upper limit at 22000 yr (95% confidence) and a lower limit around 5000 yr. Using yr (maybe more plausible, given that only 2 events have been recorded prior to 1940) these numbers would be halved. On the other hand, doubling the sample size to 2000 stars would also double the estimated interval. Given the uncertainties in the choice of the parameters, we conclude that the known FU Ori events constrain the burst interval to 2000-50000 yr.


Taken these numbers together, the interval between consecutive accretion bursts with a) a mass accretion rate increasing to yr-1 or more, b) a rise time of yr and c) a decline time of yr is most likely in the range of yr, and with high confidence between 5000 and 50000 yr. We note that this is consistent with lower limits derived from near-infrared surveys of YSOs, which give intervals longer than 2000-3000 yr (Carpenter et al., 2001; Scholz, 2012).
5.2 Comparison with constraints from outflows
FU Ori bursts are associated with strongly enhanced rates of mass accretion as well as enhanced mass outflow rates (e.g. Hartmann & Kenyon, 1996). The properties of jets and outflows may therefore be connected with these events (Reipurth, 1985). If this is the case, then the burst interval should be reflected in a corresponding time scale for jets and outflows. One possibility is that accretion bursts also power enhanced collimated ejection. This in turn would lead to the formation of new jet knots with separations of the order of the burst frequency. A second option is that accretion bursts either cause an enhanced mass outflow rate and thus trigger strong outflow activity, or destabilise the large-scale magnetic field and thus terminate an episode of collimated outflow activity, i.e. switch to a wide-angled wind.
Over the last decade the census of jets and outflows in nearby star forming regions has become more and more complete (Bally et al., 2007). Furthermore, there are now large-scale unbiased surveys to establish outflow properties along the Galactic Plane (e.g. Froebrich et al., 2011). Ioannidis & Froebrich (2012) have recently determined typical dynamical jet lifetimes and time gaps between emission knots for an unbiased sample of 130 jets and outflows from the Galactic Plane survey UWISH2. They find that the time gaps between emission knots are of the order of 103 yrs and the dynamical lifetimes are an order of magnitude larger, i.e. 104 yrs. Interestingly, this is in line with earlier estimates obtained for the molecular outflows of FU Ori stars (Evans et al., 1994).
As discussed in Sect. 5.1 our statistical limits on the burst interval from the Spitzer-WISE comparison as well as the constraint obtained from the known sample of FU Oris gives yr for the burst frequency. Values on the order of yr are highly unlikely. Thus, only the dynamical timescales of outflows can be identified with the timescale between consecutive accretion bursts, not the separation of outflow knots. This could mean that a strong burst triggers the formation of a new outflow or terminates the collimated outflow activity. The outflow knots then represent variations on shorter timescales.
One possible caveat in this comparison is that the large-scale outflows are mostly driven by sources in an early evolutionary stage whereas our analysis is biased towards Class II sources. It remains to be explored whether the frequency of eruptive variables increases significantly in the Class I stage.
5.3 Comparison with constraints from protostellar luminosities
The statistics of the protostellar luminosities does not provide a direct constraint on the burst frequency, as defined in this paper, but can be used to estimate the duty cycle. The best observational limit for this number comes from the Spitzer C2D survey. Evans et al. (2009) estimate that for a specific model stars accrete half of their mass in yr, which corresponds to 7% of the Class I lifetime of Myr. On the other hand, by comparing the C2D dataset with models for episodic accretion driven by gravitational instabilities, Dunham & Vorobyov (2012) find that YSOs spend on average only 1.3% of their total time of Myr in accretion bursts (0-12%), i.e. around 13000 yr.
The protostellar lifetimes in these estimates (0.5 and 1.0 Myr) are comparable to the typical ages of the clusters and star forming regions covered in our analysis, i.e. a comparison with our results is valid. For that purpose, however, we need to assume a typical duration for the bursts. Assuming that the bursts occur over 0.5 Myr the burst interval of yr is consistent with a duty cycle of 7% if the burst duration is on the order of 800 yr. For 1 Myr and a 1.3% duty cycle, the burst duration has to be 130 yr to be consistent with our interval. These values are plausible given the slow decline observed in the most extreme known FU Ori bursts. Thus, assuming burst durations of hundreds of years our constraint is consistent with the ones derived from protostellar luminosities.
5.4 Further discussion
While our estimate is robust for the assumptions given in Sect. 2, two additional caveats should be kept in mind when interpreting our findings. First, it is conceivable that episodic accretion does not affect all stars in the same way. Some of the bursts could be triggered by mechanisms that are not applicable to all known YSOs, for example, the presence of a companion or disk-planet interaction (see Sect. 1). This would imply that the frequency of bursts is strongly variable among protostars and it is not valid to extrapolate from the sample of known bursts.
Second, accretion bursts are often thought to occur mostly in the Class I stage of the protostellar evolution and less frequent at Class II stage. This is supported by the finding that the known FU Ori-type objects tend to be more comparable to Class I objects in terms of their disk/envelope properties (Sandell & Weintraub, 2001). Our samples include objects in these early stages – probably around one quarter to one third – but they are still dominated by the slightly older Class II objects. If we would limit the statistical analysis to the Class I objects, the burst interval could be by a factor of 3-4 lower than in our estimate. This, however, would conflict with the constraint from the known FU Oris. Therefore, we do not think that the burst interval will be significantly below 5000 yr, even if bursts only occur in the Class I stage.
Constraining the burst interval for a simple model of accretion bursts as shown in Sect. 2.2 is only the first step in a characterisation of the accretion history of YSOs. Various arguments suggest that the accretion history is in fact more complex than the simple model that is tested and constrained here (e.g. Offner & McKee, 2011; Dunham & Vorobyov, 2012). Indeed, as already acknowledged in Sect. 2.2, the known accretion bursts show a significant degree of diversity in rise time, decline time, and amplitude. Thus, the long-term goal should be to derive the frequency spectrum of bursts, and not only the interval. In addition, episodic accretion events may be combined with more gradual trends in the mass accretion rate that cannot be captured on timescales of years.
With only few epochs of photometry available for most of the YSOs in the solar neighbourhood, deriving direct observational constraints for these more complex scenarios is not feasible at the moment. With our approach, we only probe the contrast between the strong bursts and the quiescent phases. Substantial accretion rate variations in the quiescent phases would mask the signals and prevent a detection. Long-term monitoring of large samples or follow-up on the variable objects below our threshold of 1.0 mag will yield more information about the presence and characteristic of additional variations in the accretion histories of YSOs. The observational record of accretion histories will become more complete with new time-domain surveys like Pan-Starrs, VISTA/VVV, Gaia, and ultimately LSST. Out of these four, however, only VVV operates in the infrared and has access to the embedded, strongly reddened populations of YSOs.
6 Conclusions
We have searched for eruptive variables among YSOs by comparing Spitzer and WISE photometry. In our first sample of nearby YSOs, we find one previously known outbursting protostar and three more possible variables with an eruption of mag at 3.6 and 4.5. In a second sample of YSOs in the Galactic plane we find two new eruptive variables which may be outbursting protostars. Based on the statistics of these findings, we estimate that long-lasting, strong accretion bursts in protostars occur with intervals of yr, with high confidence between 5000 and 50000 yr. For this estimate we assume that additional variability is small compared with these events and that episodic accretion affects all stars in the same way. The estimate is consistent with constraints from protostellar luminosities. It is also comparable to the dynamical timescales of protostellar outflows, indicating that accretion bursts may be responsible for either triggering or terminating large-scale outflows.
Acknowledgments
This publication makes use of data products from the Wide-field Infrared Survey Explorer, which is a joint project of the University of California, Los Angeles, and the Jet Propulsion Laboratory/California Institute of Technology, funded by the National Aeronautics and Space Administration. We also use data products from the Two Micron All Sky Survey, which is a joint project of the University of Massachusetts and the Infrared Processing and Analysis Center/California Institute of Technology, funded by the National Aeronautics and Space Administration and the National Science Foundation This work also makes use of observations made with the Spitzer Space Telescope, which is operated by the Jet Propulsion Laboratory, California Institute of Technology under a contract with NASA. Part of this work was funded by the Science Foundation Ireland through grant no. 10/RFP/AST2780.
Appendix A The Robitaille catalogue – separation of YSOs and AGB stars
In order to estimate the fraction of AGB stars in the Robitaille sample, we started with our full sample of 7101 objects as defined in Sect. 3.4, and selected all objects with near-infrared colours from 2MASS in each band. Using the (H-K, J-H) colour-colour diagram for this subsample of 3709 objects, we can establish three distinct groups (see Fig. 10). Objects below the ’standard’ reddening band (defined as J-H -0.3 + 1.7 H-K, or seperator1) are clearly YSOs with K-band excess emission (YSO1a, hereafter – 1389 objects). The group at the top of the reddening band (J-H 0.1 + 1.7 H-K, or seperator2) are clearly AGB objects (AGB1a, hereafter – 1269 objects). The objects inbetween are probably a mix of AGB stars and YSOs (YSO2a and AGB2a, hereafter – 1051 objects).


We investigate if there is a further way to separate these sources by plotting a K-band luminosity function of YSO1a and AGB1a (see Fig. 11). While YSO1a shows a well defined peak between 11 and 13 mag in K, the AGB1a sample is brighter, mostly confined to 8-10 mag with a tail of fainter objects. The K-band luminosity function of AGB2a and YSO2a together (also shown in Fig. 11), is a clear mix of the the other two, with two peaks. Based on this plot, we defined four ’clean’ samples of objects:
-
1.
YSO1: below seperator1, 11K13 (819 objects)
-
2.
AGB1: above seperator2, 8K10 (696 objects)
-
3.
YSO2: between seperator1 and seperator2, 11K13 (428 objects)
-
4.
AGB2: between seperator1 and seperator2, 8K10 (399 objects)
These objects are taken out of all 3709 objects which have a JHK detektion as well as no ’bright’ neighbours in Glimpse as discussed above (Sect. 3.4). With the described magnitude cuts there are 2342 objects remaining, from which 1247 (53 %) are YSOs and 1095 (47 %) are AGB stars, in line with the percentages given in Robitaille et al. (2008). We obtain a very similar result using only the YSO1a and AGB1a samples without K-band magnitude cuts (1389 YSOs vs. 1269 AGBs, i.e. 52.2 % YSOs). We expect that the total sample of 7101 objects has a comparable YSO fraction of 52 – 53 %, i.e. the sample contains 3700-3800 YSOs.
The contamination among the burst candidates is significantly lower. In the subsamples YSO1, YSO2, AGB1, AGB2, as defined above, there are 27 burst candidates, with brightness increase of mag in the 3.6 and 4.5m bands. 17 of them are from subsample YSO1 and 10 from YSO2, none from the AGB samples. Despite making up almost half of the entire sample, there are no AGB stars which are highly variable. Thus, it is likely that the fraction of AGB stars among the 77 burst candidates in the total sample is negligible. More quantitatively, we expect that the upper limit for the fraction of AGB stars among burst candidates is 4 % (1/27), which corresponds to 3 objects in the sample of 77 burst candidates.
References
- Alves de Oliveira & Casali (2008) Alves de Oliveira C., Casali M., 2008, A&A, 485, 155
- Alves de Oliveira et al. (2012) Alves de Oliveira C., Moraux E., Bouvier J., Bouy H., 2012, A&A, 539, A151
- Armitage et al. (2001) Armitage P. J., Livio M., Pringle J. E., 2001, MNRAS, 324, 705
- Bally et al. (2007) Bally J., Reipurth B., Davis C. J., 2007, Protostars and Planets V, pp 215–230
- Baraffe et al. (1998) Baraffe I., Chabrier G., Allard F., Hauschildt P. H., 1998, A&A, 337, 403
- Barsony et al. (1997) Barsony M., Kenyon S. J., Lada E. A., Teuben P. J., 1997, ApJS, 112, 109
- Bell & Lin (1994) Bell K. R., Lin D. N. C., 1994, ApJ, 427, 987
- Benjamin et al. (2003) Benjamin R. A., Churchwell E., Babler B. L., Bania T. M., Clemens D. P., Cohen M., Dickey J. M., Indebetouw R., Jackson J. M., Kobulnicky H. A., et al. 2003, PASP, 115, 953
- Boley & Durisen (2008) Boley A. C., Durisen R. H., 2008, ApJ, 685, 1193
- Bonnell & Bastien (1992) Bonnell I., Bastien P., 1992, ApJ, 401, L31
- Caratti o Garatti et al. (2011) Caratti o Garatti A., Garcia Lopez R., Scholz A., Giannini T., Eislöffel J., Nisini B., Massi F., Antoniucci S., Ray T. P., 2011, A&A, 526, L1+
- Carpenter et al. (2001) Carpenter J. M., Hillenbrand L. A., Skrutskie M. F., 2001, AJ, 121, 3160
- Churchwell et al. (2009) Churchwell E., Babler B. L., Meade M. R., Whitney B. A., Benjamin R., Indebetouw R., Cyganowski C., Robitaille T. P., Povich M., Watson C., Bracker S., 2009, PASP, 121, 213
- Clarke et al. (2005) Clarke C., Lodato G., Melnikov S. Y., Ibrahimov M. A., 2005, MNRAS, 361, 942
- Covey et al. (2011) Covey K. R., Hillenbrand L. A., Miller A. A., Poznanski D., Cenko S. B., Silverman J. M., Bloom J. S., Kasliwal M. M., Fischer W., Rayner J., Rebull L. M., Butler N. R., Filippenko A. V., Law N. M., Ofek E. O., Agüeros M., Dekany R. G., et al. 2011, AJ, 141, 40
- Dahm & Simon (2005) Dahm S. E., Simon T., 2005, AJ, 129, 829
- Dunham & Vorobyov (2012) Dunham M. M., Vorobyov E. I., 2012, ApJ, 747, 52
- Evans et al. (2009) Evans N. J., Dunham M. M., Jørgensen J. K., Enoch M. L., Merín B., van Dishoeck E. F., Alcalá J. M., Myers P. C., Stapelfeldt K. R., et al. 2009, ApJS, 181, 321
- Evans et al. (1994) Evans II N. J., Balkum S., Levreault R. M., Hartmann L., Kenyon S., 1994, ApJ, 424, 793
- Flaherty et al. (2012) Flaherty K. M., Muzerolle J., Rieke G., Gutermuth R., Balog Z., Herbst W., Megeath S. T., Kun M., 2012, ApJ, 748, 71
- Forgan & Rice (2010) Forgan D., Rice K., 2010, MNRAS, 402, 1349
- Froebrich et al. (2011) Froebrich D., Davis C. J., Ioannidis G., Gledhill T. M., Takami M., Chrysostomou A., Drew J., Eislöffel J., Gosling A., Gredel R., Hatchell J., Hodapp K. W., Kumar M. S. N., Lucas P. W., Matthews H., et al. 2011, MNRAS, 413, 480
- Gutermuth et al. (2009) Gutermuth R. A., Megeath S. T., Myers P. C., Allen L. E., Pipher J. L., Fazio G. G., 2009, ApJS, 184, 18
- Hartmann & Kenyon (1996) Hartmann L., Kenyon S. J., 1996, ARA&A, 34, 207
- Herbig (1977) Herbig G. H., 1977, ApJ, 217, 693
- Herbig (2007) Herbig G. H., 2007, AJ, 133, 2679
- Ioannidis & Froebrich (2012) Ioannidis G., Froebrich D., 2012, ArXiv e-prints
- Kóspál et al. (2011) Kóspál Á., Ábrahám P., Acosta-Pulido J. A., Arévalo Morales M. J., Carnerero M. I., Elek E., Kelemen J., Kun M., Pál A., Szakáts R., Vida K., 2011, A&A, 527, A133+
- Lada & Lada (2003) Lada C. J., Lada E. A., 2003, ARA&A, 41, 57
- Lodato & Clarke (2004) Lodato G., Clarke C. J., 2004, MNRAS, 353, 841
- Martin & Lubow (2011) Martin R. G., Lubow S. H., 2011, ApJ, 740, L6
- Miller et al. (2011) Miller A. A., Hillenbrand L. A., Covey K. R., Poznanski D., Silverman J. M., Kleiser I. K. W., Rojas-Ayala B., Muirhead P. S., Cenko S. B., Bloom J. S., Kasliwal M. M., Filippenko A. V., Law N. M., Ofek E. O., Dekany R. G., Rahmer G., et al. 2011, ApJ, 730, 80
- Morales-Calderón et al. (2011) Morales-Calderón M., Stauffer J. R., Hillenbrand L. A., Gutermuth R., Song I., Rebull L. M., Plavchan P., Carpenter J. M., Whitney B. A., Covey K., Alves de Oliveira C., Winston E., McCaughrean M. J., et al. 2011, ApJ, 733, 50
- Natta et al. (2006) Natta A., Testi L., Randich S., 2006, A&A, 452, 245
- Offner & McKee (2011) Offner S. S. R., McKee C. F., 2011, ApJ, 736, 53
- Pfalzner (2008) Pfalzner S., 2008, A&A, 492, 735
- Rebull et al. (2011) Rebull L. M., Guieu S., Stauffer J. R., Hillenbrand L. A., Noriega-Crespo A., Stapelfeldt K. R., Carey S. J., Carpenter J. M., Cole D. M., Padgett D. L., Strom S. E., Wolff S. C., 2011, ApJS, 193, 25
- Rebull et al. (2010) Rebull L. M., Padgett D. L., McCabe C.-E., Hillenbrand L. A., Stapelfeldt K. R., Noriega-Crespo A., Carey S. J., Brooke T., Huard T., Terebey S., Audard M., Monin J.-L., Fukagawa M., Güdel M., et al. 2010, ApJS, 186, 259
- Reipurth (1985) Reipurth B., 1985, A&A, 143, 435
- Reipurth & Aspin (2010) Reipurth B., Aspin C., 2010, in Harutyunian H. A., Mickaelian A. M., Terzian Y., eds, Evolution of Cosmic Objects through their Physical Activity FUors and Early Stellar Evolution. pp 19–38
- Reipurth et al. (2012) Reipurth B., Aspin C., Herbig G. H., 2012, ApJ, 748, L5
- Robitaille et al. (2008) Robitaille T. P., Meade M. R., Babler B. L., Whitney B. A., Johnston K. G., Indebetouw R., Cohen M., Povich M. S., Sewilo M., Benjamin R. A., Churchwell E., 2008, AJ, 136, 2413
- Robitaille et al. (2006) Robitaille T. P., Whitney B. A., Indebetouw R., Wood K., Denzmore P., 2006, ApJS, 167, 256
- Saito et al. (2012) Saito R. K., Hempel M., Minniti D., Lucas P. W., Rejkuba M., Toledo I., Gonzalez O. A., Alonso-García J., Irwin M. J., Gonzalez-Solares E., Hodgkin S. T., Lewis J. R., Cross N., Ivanov V. D., Kerins E., et al. 2012, A&A, 537, A107
- Sandell & Weintraub (2001) Sandell G., Weintraub D. A., 2001, ApJS, 134, 115
- Scholz (2012) Scholz A., 2012, MNRAS, 420, 1495
- Scholz et al. (2006) Scholz A., Jayawardhana R., Wood K., 2006, ApJ, 645, 1498
- Stamatellos et al. (2011) Stamatellos D., Whitworth A. P., Hubber D. A., 2011, ApJ, 730, 32
- Sung et al. (2009) Sung H., Stauffer J. R., Bessell M. S., 2009, AJ, 138, 1116
- Vorobyov & Basu (2005) Vorobyov E. I., Basu S., 2005, ApJ, 633, L137
- Welin (1971) Welin G., 1971, A&A, 12, 312
- Wright et al. (2010) Wright E. L., Eisenhardt P. R. M., Mainzer A. K., Ressler M. E., Cutri R. M., Jarrett T., Kirkpatrick J. D., Padgett D., McMillan R. S., Skrutskie M., Stanford S. A., Cohen M., Walker R. G., Mather J. C., et al. 2010, AJ, 140, 1868
- Zhu et al. (2009) Zhu Z., Hartmann L., Gammie C., McKinney J. C., 2009, ApJ, 701, 620