Properties of free–free, dust, and CO emissions in the starbursts of blue compact dwarf galaxies
Abstract
The central star-forming regions in three blue compact dwarf galaxies (He 2-10, NGC 5253, and II Zw 40) were observed in the 340 GHz () band at arcsec resolution with the Submillimetre Array (SMA). Continuum emission associated with the central star-forming complex was detected in all these galaxies. The SMA 880 flux is decomposed into free–free emission and dust emission by using centimetre-wavelength data in the literature. We find that free–free emission contributes half or more of the SMA 880 flux in the central starbursts in those three galaxies. In spite of the dominance of free–free emission at 880 , the radio-to-far infrared (FIR) ratios in the central star-forming regions are not significantly higher than those of the entire systems, showing the robustness of radio–FIR relation. Based on the robustness of the radio–FIR relation, we argue that the free–free fraction in the 880 emission is regulated by the dust temperature. We also analyze the CO ( 3–2) emission data. We find that CO is a good tracer of the total gas mass in solar-metallicity object He 2-10. Low-metallicity objects, NGC 5253 and II Zw 40, have apparently high star formation efficiencies; however, this may be an artifact of significant dissociation of CO in the low-metallicity environments. We also point out a potential underestimate of dust mass, since the dust traced by emission is biased to the most luminous high-temperature regions, particularly when a system hosts a compact star-forming region where the dust temperature is high.
keywords:
dust, extinction — galaxies: dwarf — galaxies: evolution —galaxies: individual (He 2-10, NGC 5253, II Zw 40) — H ii regions — submillimetre: galaxies1 Introduction
The early stage of galaxy evolution can be characterized by the following two properties: a poor metal abundance and a rich gas content. Although galaxies at the early evolutionary stages exist at high redshift, nearby blue compact dwarf galaxies (BCDs) are a unique category of galaxies that have those two properties in the nearby Universe (Sargent & Searle, 1970; van Zee, Skillman, & Salzer, 1998; Kunth & Östlin, 2000). Some BCDs are also experiencing the most active class of star formation with the formation of super star clusters (SSCs) (Turner et al., 1998; Kobulnicky & Johnson, 1999). This kind of intense star formation may also provide a relevant laboratory to understand the conditions in which high-redshift galaxies experience their first starburst episode.
Such intense star formation as seen in BCDs is occurring in dense and compact regions and thus can only be traced with optically thin star formation indicators, such as far-infrared (FIR) dust luminosity (e.g. Kennicutt, 1998; Inoue, Hirashita, & Kamaya, 2000) and radio luminosity (thermal free–free emission from H ii regions plus non-thermal synchrotron emission from accelerated electrons) (Condon, 1992). These two luminosities are strongly correlated in nearby star-forming galaxies (e.g. de Jong et al., 1985; Helou, Soifer, & Rowan-Robinson, 1985).
In our previous paper, Hirashita (2011, hereafter H11), we observed a well studied BCD, II Zw 40, with the Submillimetre Array (SMA; Ho, Moran, & Lo 2004). In this paper, we add two BCDs, He 2-10 and NGC 5253, both of which also host high star formation activities likely to be associated with the formation of SSCs in the centre (Gorjian, 1996; Johnson et al., 2000). The radio emission at wavelengths a few cm is optically thick for free–free absorption, supporting the existence of young compact regions before the expansion of H ii regions (Turner, Ho, & Beck, 1998; Kobulnicky & Johnson, 1999; Johnson & Kobulnicky, 2003).111In this paper, we focus on the wavelength range ( cm), where the radiation is optically thin for free–free absorption as far as our sample is concerned (Sections 2.1–2.3). All these BCDs are also classified as Wolf-Rayet galaxies: the Wolf-Rayet feature indicates that the typical age of the current starburst is a few Myr (Vacca & Conti, 1992; López-Sánchez & Esteban, 2010).
Some of the conclusions derived from II Zw 40 by H11 can be generalized by increasing the sample. H11 argues that free–free dominated submillimetre emission can be a characteristics of young active star formation. H11 has clarified that, if we focus on the central star-forming region in II Zw 40, free–free emission dominates even at 880 . Considering that global222In this paper, we call the luminosity of the entire galaxy ‘global luminosity’. submm luminosity is usually dominated by dust (Galliano et al., 2005), the dominance of free–free emission at 880 is a special characteristics, which should be examined with a larger sample.
By increasing the sample, we can also explore the metallicity dependence of various properties. The metallicity of the interstellar medium is a fundamental quantity characterizing the galaxy evolution because it reflects the enrichment in heavy elements by stellar generations. Some metallicity effects are expected in the formation of dense star-forming regions: (i) Dust-to-gas ratio in low metallicity objects is generally low (Schmidt & Boller, 1993; Lisenfeld & Ferrara, 1998; Hirashita, Tajiri, & Kamaya, 2002), which implies that the star-forming regions are less embedded by dust in low-metallicity objects than in high-metallicity objects; and (ii) in a low-metallicity (i.e. dust-poor) environment, star formation is expected to be less efficient because of less shielding of ultraviolet (UV) heating photons by dust and molecular hydrogen (Hirashita & Ferrara, 2002; Yamasawa et al., 2011; Gnedin & Kravtsov, 2011). Thus, we will address the metallicity dependence of dust abundance and star formation efficiency by investigating gas and dust emission in BCDs.
In observing intense starbursts associated with the formation of SSCs, a high spatial resolution is crucial to spot the young star-forming component. While high-resolution data of the central star-forming regions in BCDs are available through various radio interferometric observations with arcsecond resolutions (1 arcsec corresponds to 51 pc for He 2-10 and II Zw 40, and 18 pc for NGC 5253), information of FIR–submm dust emission on such a small scale was lacking for BCDs. We thus performed SMA observations of a few BCDs to resolve their submm emission. Shorter wavelengths such as mid-infrared can achieve almost arcsecond resolutions by single-dish telescope facilities such as the Spitzer Space Telescope Infrared Array Camera (Fazio et al., 2004) and AKARI Infrared Camera (Onaka et al., 2007), but the mid-infrared emission is dominated by stochastically heated very small grains (Draine & Anderson, 1985), which are not representative of the total dust amount (although it is empirically known that the mid-infrared luminosity is well correlated with the total dust luminosity in BCDs (Wu et al. 2008; see also Takeuchi et al. 2005)).
This paper is organized as follows. We explain the observations and the data analysis in Section 2. In Section 3, we derive basic quantities related to star formation and submm emission, and discuss radio–FIR relation. We also analyze CO(3–2) emission and derive the molecular gas mass, which is used to estimate the dust-to-gas ratio and the star formation efficiency. After discussing our observational results in Section 4, we conclude in Section 5.
2 Observations and data analysis
We selected nearby BCDs which host young compact starbursts. Searching for objects feasible for the sky coverage and sensitivity of SMA, we chose He 2-10 and NGC 5253. They have similar properties to our previous object, II Zw 40, in H11: (i) The ages of the central starbursts are young ( a few Myr) as indicated by the Wolf-Rayet feature (Vacca & Conti, 1992; López-Sánchez & Esteban, 2010) and the stellar spectral synthesis models (Chandar et al., 2005); and (ii) they host optically thick compact free–free emission at wavelengths a few cm, indicating an intense starburst in a dense compact region (Turner et al., 1998; Kobulnicky & Johnson, 1999; Johnson & Kobulnicky, 2003). Since He 2-10 has a higher metallicity than the other two galaxies, we may be able to obtain a hint for metallicity effects (Section 3; see Table 1 for the observed metallicity values). The distances () and velocities (relative to the local standard of rest; ) adopted in this paper are listed in Table 1.
The SMA observations of He 2-10 and NGC 5253 were carried out in the 340 GHz (880 ) band on 2012 January 11 in the subcompact configuration. Seven antennas were used with projected antenna separations between 9.5 and 45 m. The receivers have two sidebands, the lower and upper sidebands, which covered the frequency ranges from 330.8 to 334.8 GHz, and from 342.8 to 346.9 GHz, respectively. The visibility data were calibrated with the MIR package. As a flux calibrator we used Callisto (with an adopted flux of 14.5 Jy) for He 2-10, and Titan (with an adopted flux of 2.36 Jy) for NGC 5253. We used quasars J0730116 and J1337129 as amplitude and phase calibrators for He 2-10 and NGC 5253, respectively. We adopted quasar 3C279 as a band pass calibrator for both objects. In generating the continuum data, we excluded the chunk containing the CO(3–2) emission at rest 345.796 GHz. The calibrated visibility data were imaged and CLEANed with the MIRIAD package. The synthesized beam has a full width at half-maximum (FWHM) of 5.7 arcsec 4.4 arcsec () with a major axis position angle of for He 2-10 and a FWHM of 6.7 arcsec 4.1 arcsec () with a major axis position angle of for NGC 5253. The largest angular scale sampled by this observation is 19 arcsec. We also use the SMA subcompact data of II Zw 40 in H11 (see H11 for details).
| Object | R.A. | Dec. | peak fluxc | total fluxc | free–freed | fractione | |||
|---|---|---|---|---|---|---|---|---|---|
| (J2000) | (J2000) | (Mpc) | km s-1 | (mJy/beam) | (mJy) | (mJy) | |||
| He 2-10 | 10.5 | 850 | 12.8–15.4 | 0.45–0.64 | 8.93 | ||||
| NGC 5253 | 3.7 | 401 | 0.63–0.82 | 8.14 | |||||
| II Zw 40 | 10.5 | 767 | 10–13.5 | 0.64–1 | 8.13 |
a Distance. References: Tully (1988) for He 2-10; Caldwell & Phillips (1989) for NGC 5253; H11 for II Zw 40.
b Velocity relative to the local standard of rest. References: Vanzi et al. (2009) for He 2-10 and NGC 5253; Sage et al. (1992) for II Zw 40.
c Peak and total continuum fluxes of our SMA 880 observations. The errors are estimated from the 1 background fluctuation.
d The contribution from free–free emission at 880 .
e The fraction of free–free contribution.
Figure 1 shows the obtained continuum brightness distribution. The central active star-forming regions are detected in all the galaxies. The peak fluxes with 1 errors are listed in Table 1. All the sources are more extended than the beam ( arcsec), and the total fluxes are also listed in Table 1. The high brightness region () is concentrated, considering that the interferometry is sensitive to an extension of 19 arcsec. Hereafter, we use the term ‘central star forming-region’ to indicate the region where the SMA brightness is . If we compare the SCUBA images of II Zw 40 and He 2-10 at 450 (beam size 8.5 arcsec) in Galliano et al. (2005), the size of the centrally concentrated bright regions are consistent, but we miss the diffuse component (shown by the lowest contours extending arcmin in their figure 1). The diffuse component is also clear in their 850 image with a larger beam ( arcsec). We mainly analyze and discuss the SMA continuum data, although we additionally use the CO(3–2) data in Section 3.6.
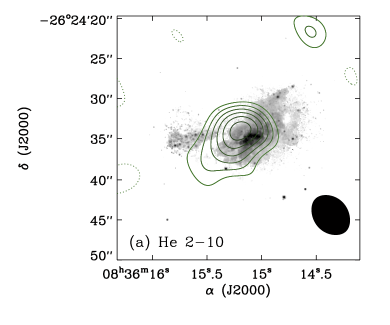
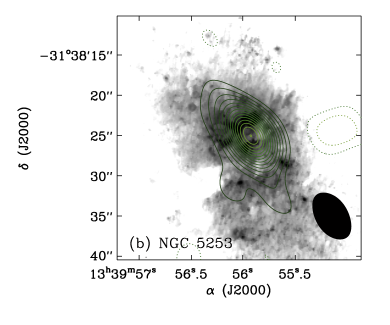
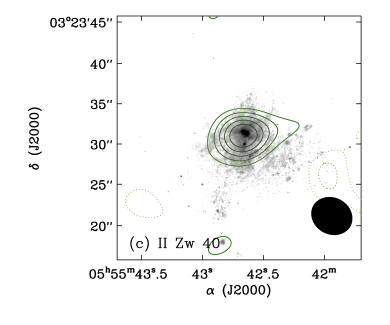
In Fig. 1, the SMA 880 brightness distribution is overlaid with the Hubble Space Telescope (HST) Advanced Camera for Surveys (ACS) data in the optical (at F550M, F550W, and F550W bands for He 2-10, NGC 5253, and II Zw 40, respectively)333http://hla.stsci.edu/. The positional accuracy of our SMA image is arcsec, while that of the HST is arcsec, limited by the positional uncertainties of the guide stars (Lasker et al., 1990). The centre of submillimetre emission coincides with that of optical for II Zw 40, while there is a significant shift in He 2-10. As shown by Kobulnicky & Johnson (1999), the 3.6 cm radio image also shows a poor correlation with the HST optical image for He 2-10. The poor positional coincidence can be attributed to the extinction in the optical image. The optical image of NGC 5253 has a complicated morphology, and the peak of the SMA image does not match the brightest region in the optical. The different morphologies between optical and submm (or radio) brightnesses, especially for He 2-10 and NGC 5253, indicate that the optical light may be tracing completely different regions from those observed in submm and radio.
Submm continuum emission in galaxies is usually dominated by dust thermal radiation and contaminated by free–free emission (e.g. Galliano et al., 2005). Both these emission processes trace star-forming regions (e.g. Condon, 1992). In order to separate the free–free contribution at 880 , we compare our submm fluxes with radio interferometric fluxes in the literature as explained in the following subsections. We neglect the non-thermal component throughout this paper since the radio spectrum at wavelengths a few cm is consistent with free–free emission in the central star-forming regions (see each subsection below).
2.1 He 2-10
Kobulnicky & Johnson (1999) observed He 2-10 by the Very Large Array (VLA). Their 3.6 cm continuum image (with a beam size of 0.70 arcsec 0.57 arcsec FWHM) fairly traces our SMA brightness, although individual knots detected in the VLA image are not resolved by our SMA observation. They also have high-resolution images at 2 and 6 cm, where the measured fluxes are mJy and mJy, respectively. The 3.6 cm flux whose coverage is matched to these maps is mJy. These three fluxes are consistent with the flat spectrum expected for free–free emission (see also Kobulnicky & Johnson, 1999). Since the spectrum at 2–6 cm is flat, a large free–free absorption at this wavelength range can be rejected. Therefore, we use the interferometric 2 cm flux ( mJy) to extrapolate the contribution from free–free emission at 880 . The flux estimated in this way may be a lower limit, since these matched data are sensitive to the compact knots and the structures surrounding them, but possibly miss the diffuse south-east extension in our SMA image (Fig. 1). This extension is just along the possible tidal tail pointed out by a CO observation in Kobulnicky et al. (1995). Thus, we also use the total VLA flux (21.1 mJy at 2 cm) as an upper limit. If we convert these fluxes to 880 fluxes by assuming dependence (Osterbrock, 1989), we obtain 12.8 mJy and 15.4 mJy for the lower and upper limits of the free–free contribution, respectively. These values indicate that 45–64 per cent of the SMA 880 flux is free–free emission.
2.2 NGC 5253
Meier, Turner, & Beck (2002) show that the radio continuum spectral slope of NGC 5253 is consistent with free–free emission. The slight extension to the west of the peak is common between their 3.1 mm image and our SMA 880 image. We adopt the total flux in the inner 20 arcsec region ( mJy at 3.1 mm; Meier et al. 2002), to which SMA can be sensitive. The flat spectrum at cm show that free–free emission is optically thin at 3.1 mm. We estimate the 880 free–free flux by assuming a frequency dependence of for the free–free spectrum. Then we obtain mJy for the contribution from free–free emission at 880 . Thus, 63–82 per cent of the SMA 880 flux is free–free emission.
2.3 II Zw 40
This galaxy has already been analyzed and reported in H11. The centimetre emission from the central part can be fitted by the free–free flat spectrum. Since the VLA 2 cm observation is only sensitive to the structures smaller than 4 arcsec, we also adopt the single dish flux at 2 cm (18.5 mJy; Beck et al. 2002) as an upper limit. H11 also justifies the wavelength dependence of at cm for free–free emission by spectral fitting. If we adopt 14–18.5 mJy for 2 cm flux, we obtain 10–13.5 mJy for the contribution from free–free emission at 880 . Thus, 64–100 per cent of the flux detected at 880 by SMA is free–free emission from the central star-forming region.
3 Models
In order to interpret the 880 emission in our sample, we need to model two major emission mechanisms (thermal free–free radiation and dust emission) from the star-forming regions. In particular, the total luminosity of dust emission (called FIR luminosity) is used to investigate the radio–FIR luminosity relation later. Physical quantities governing free–free and dust emissions are introduced. One of the basic quantities is the stellar mass () formed at the current episode of star formation, since the ionizing photon luminosity which determines the free–free emission and the UV luminosity which contributes to the heating of dust are proportional to . To evaluate , the free–free fluxes extrapolated from radio observations in Sections 2.1–2.3 are used (Section 3.2). The obtained is later used to estimate the UV luminosity in Section 3.3. In addition, we need to determine the mass and temperature of the dust to estimate the FIR luminosity, which is used to examine the radio–FIR relation. Through the modeling, we can obtain the stellar mass formed in the current starburst episode, the dust mass (the dust optical depth), the dust temperature, all of which are basic quantities to understand the strength of starburst and the extent of dust enrichment. We use the theoretical models that we applied to II Zw 40 in our previous paper (H11). Some detailed assumptions that do not affect our results are simplified. Below we briefly summarize the models used in this paper. The same parameter values as those in H11 are adopted unless otherwise stated.
3.1 Basic setups for the star formation
In H11, we modeled the star formation rate (SFR) through the free-fall time-scale under a given gas density, while in this paper, we treat the SFR as a free parameter. This is because the SFR is more directly connected to the observed luminosity than the free-fall time and the gas density. We assume that the SFR is constant as a function of time. As shown below, since we only consider young ( Myr) star-forming regions, the dependence of the luminosity on star formation history is weak in the sense that the total stellar luminosity is simply determined by the total stellar mass formed in the current star formation episode. We assume a Salpeter initial mass function (IMF) with a stellar mass range of 0.1–100 M☉.
3.2 Thermal free–free emission
Free–free emission contains the information of the total stellar mass formed in the current starburst episode as modeled below. We use the free–free emission as estimated in Sections 2.1–2.3. The total stellar mass is necessary to estimate the UV luminosity based on which the FIR luminosity is modeled in Section 3.3. Thus, we first relate the free–free emission to the total stellar mass. We assume that free–free emission is optically thin since we only consider high frequencies such as GHz (see Sections 2.1–2.3 for further justification).
The thermal free–free luminosity is proportional to the number of ionizing photons emitted per unit time, (Condon, 1992). We relate the SFR with following Section 4.1 of H11 (originally, equation 1 of Hirashita & Hunt 2006). In this paper, we adopt the ionizing photon luminosity as a function of stellar mass by taking the solar metallicity case in Schaerer (2002). The dependence of on the stellar metallicity is within a factor of 2 in the metallicity range concerned in this paper.
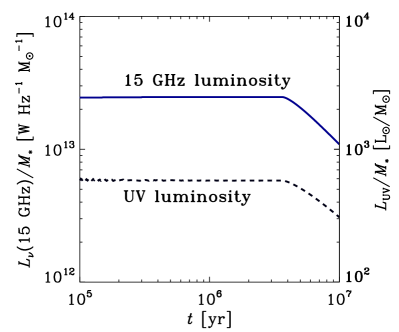
Because we mainly consider young ( Myr) galaxies, the decline of luminosities by stellar death is small. Thus, the luminosity basically reflects the total stellar mass formed up to the current age of the system. In Fig. 2, we show the evolution of the free–free luminosity () at 15 GHz normalized to the stellar mass formed (integration of the SFR over the time), which is denoted as . Although we only show the results at 15 GHz, at other frequencies can be estimated by assuming a frequency dependence of as long as the emission is dominated by free–free and is optically thin (Sections 2.1–2.3). We assume a constant SFR, but the following results are not sensitive to the time variation of the SFR under a given as long as we consider young ( Myr) ages. We obtain the following formula:
| (1) |
where [ is the flux at 15 GHz (2 cm) adopted in Sections 2.1–2.3 and listed in Table 2]. This equation is not valid if there is a significant contribution from non-thermal synchrotron emission or if the age is much older than 3 Myr. In our SMA sample, the contribution from non-thermal emission should be small since the observational spectral indexes at centimetre wavelengths are consistent with thermal free–free (Section 2).
3.3 Dust emission
To give a physical interpretation to the dust emission component in the observed 880 flux, we need to determine the mass and temperature of the dust. The dust mass (the dust optical depth) and the dust temperature are basic quantities to understand the strength of starburst and the extent of dust enrichment. The total FIR luminosity can also be derived and used to examine the radio–FIR relation (Section 3.5). We do not directly use optical and UV observations, since they may only trace regions with less extinctions and may not be relevant to what we are modeling (Section 2). We use the same simple model as H11 for the dust emission associated with the central star-forming region in each individual galaxy. Here we summarize the model. At submm wavelengths, the ‘large’ grains, which achieve radiative equilibrium with the ambient stellar radiation field, are the dominant component in the luminosity (e.g. Galliano et al., 2005). For simplicity, we assume that the dust is distributed in a thin shell at a distance from the centre and that the young stars are located at the centre of the shell (as also assumed in Galliano et al. 2005). The following results are valid as long as the starbursts are more concentrated than the dust distribution. In our sample, the stars associated with the current starburst are more compact than the dust distribution (Gorjian, 1996; Johnson et al., 2000; Vanzi et al., 2008). In reality, we should also note that it is difficult to constrain the spatial distribution of stars because of large dust extinctions.
Under the above assumptions, the dust optical depth, , for the radiation from stars is estimated as
| (2) |
where is the total dust mass in the shell, is the typical grain radius (we adopt the geometrical cross section for the absorption cross section), and g cm-3 is the grain material density (e.g. Draine & Lee, 1984).
We assume that the UV luminosity (denoted as ) is equal to the bolometric luminosity of the OB stars (stars heavier than 3 M☉); that is, the total UV luminosity is calculated by summing all the contribution from OB stars under the star formation history and the initial mass function given in Section 3.1. In Fig. 2, we show the evolution of the UV luminosity calculated by the model (see H11 for details). Since Schaerer (2002) does not provide the stellar luminosities for solar metallicity, we adopt the zero-metallicity case. According to Raiter, Schaerer, & Fosbury (2010), the variation of UV luminosity by metallicity under a fixed SFR is within 0.2 dex if the Salpeter IMF is adopted. Following the result shown in Fig. 2, we obtain
| (3) |
where is already given by the observed radio flux through equation (1). We assume that the OB stars are located at the centre, so that we can estimate the total FIR luminosity, , by
| (4) |
where is given by equation (2). The dust temperature, , is related to the dust mass, , as
| (5) |
The monochromatic dust emission flux is expressed as
| (6) |
where is the Planck function, is the mass absorption coefficient of the dust, and is the dust temperature. We assume that cm2 g-1 (James et al., 2002).
The flux from dust at 880 ( GHz) used in equation (6) is obtained by subtracting the free–free flux from the total SMA flux as described in Section 2. The values of at 880 are listed in Table 2. Considering the errors, the upper/lower value of the free–free contribution and the lower/upper value of the SMA 880 flux are used to obtain the lower/upper values of . Equations (5) and (6) indicate that we determine the FIR luminosity so that it is consistent with the observed 880 flux as explained at the end of this paragraph (see also Fig. 4 in H11). In H11, we gave as a free parameter, but in this paper, we determine the typical radius for the distribution of the dust associated with the central star-forming region, to which the SMA data is sensitive. We provide by the intensity-weighted radius as
| (7) |
where is the projected position in the image and is the intensity-weighted centre of the image. Although our 880 images are contaminated with free–free emission, Beck, Turner, & Gorjian (2001) show similar spatial distributions between mid-infrared dust emission and radio free–free emission in He 2-10, implying that it is reasonable to assume that both dust and free–free have similar spatial extent at 880 at least for this galaxy. For NGC 5253, Turner & Beck (2004) show that most of the free–free flux comes from the central 1.2 arcsec region, which implies that dust emission is more extended than free–free emission. In such a case, underestimates the actual extension of dust. The value of for each galaxy is listed in Table 2. After all, with (given in Table 2), (derived from the free–free luminosity through equation 1) and (estimated by equation 3), the unknown parameters are and (note that in equation 5 is given by equation 2). These two unknowns are obtained by solving equations (5) and (6).
| Object | |||||||||
| (arcsec) | (pc) | (mJy) | (mJy) | () | () | (K) | () | ||
| He 2-10 | 3.31 | 168 | 9–16 | 21.1–17.5 | 11–9.4 | 4.7–9.2 | 48–46 | 0.69–1.4 | 3.2–4.0 |
| NGC 5253 | 3.61 | 64.8 | 12–26 | 0.65–1.5 | 57–53 | 0.64–1.5 | 1.2–1.9 | ||
| II Zw 40 | 3.28 | 167 | 14–18.5 | 45c | |||||
a The dust flux estimated from the total SMA 880 flux minus the free–free contribution (Table 1).
b Converted from the 3.1 mm flux ( mJy) in Meier et al. (2002) by assuming frequency dependence .
c The value is for the upper limit of .
3.4 Derived quantities
The quantities derived by the models above (, , and ) are listed in Table 2. The stellar mass formed by the current starburst ranges from a few to M☉, and the dust mass associated with the star-forming regions is – M☉. The solar-metallicity sample, He 2-10, has the largest dust content: if the dust mass is normalized to the stellar mass, its dust-to-stellar mass ratio is 4–10 in comparison with the values 2–3 for NGC 5253 and for II Zw 40. This indicates that He 2-10 is the most dust-enriched system probably because of the highest metallicity. As argued in H11 (see also Section 4.2), the dust is preexisting or grown in dense molecular clouds. Since dust growth is efficient in high-metallicity environments, the highest dust content in the He 2-10 centre among the three sample BCDs can be interpreted to be the consequence of the most efficient dust growth. Dust temperatures (–60 K) higher than those in the Milky Way (–20 K; Draine & Lee 1984) are obtained for all the sample, supporting that intense star formation is occurring in compact regions. Direct constraints on from FIR data are crucial in future high-resolution FIR data around the spectral peak, since is the most sensitive to than to the other parameters (see equation 5). However, because works as an adjusting factor under a given 880 flux through equation (6), the uncertainty in is not so large as expected from the uncertainty in .
3.5 Radio–FIR relation
In Section 2, we have shown that a large fraction of the SMA 880 flux in the sample BCDs is contributed from free–free emission, while the submm emission is usually dominated by dust on global scales of galaxies (Galliano et al., 2005). The large contribution from free–free emission to the submm emission may cause a significant impact on the radio–FIR relation in such a way that the radio luminosity is relatively enhanced (H11). Now we examine this issue by plotting the radio–FIR relation for the central regions in our sample BCDs.
In Fig. 3, we show the relation between the monochromatic luminosity at 15 GHz [] and the FIR luminosity for the central star-forming regions in the sample BCDs. has already been obtained in Section 3.4 (see also Table 2), while is obtained by using the flux at 15 GHz in Table 2 multiplied by (see also Sections 2.1–2.3). The upper and lower bounds of correspond to the lower and upper bounds of (the dust flux at 880 ) given in Table 2. (Recall that is the total SMA 880 flux minus the free–free contribution. If the free–free contribution were not subtracted, we would overestimate by a factor of 2 or more.) For He 2-10, the upper and lower limits of are used, for NGC 5253, we use the measured values, and for II Zw 40, we plot the lower value for to put an upper limit for (Fig. 3).
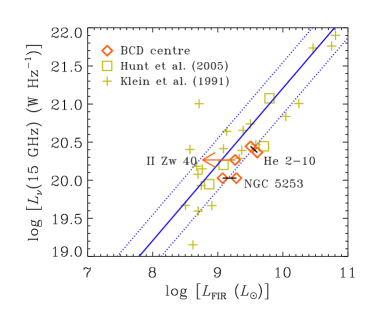
For comparison, we plot the observational data of global emission from BCDs (i.e. the total luminosity from the entire system) in Fig. 3. The sample is taken from Hunt, Bianchi, & Maiolino (2005) for the FIR and 15 GHz global luminosities (squares) and Klein, Weiland, & Brinks (1991) for the FIR and 10.7 GHz global luminosities (crosses). The 10.7 GHz luminosity is converted to the 15 GHz luminosity by assuming the frequency dependence to be , where the spectral index is given in Klein et al. (1991) as a result of fitting to the data at some available radio frequencies (even if we assume for all the sample, the change of 15 GHz luminosity is too slight to affect our results). As an observational estimate of the FIR luminosity, we adopt an empirically derived formula by Nagata et al. (2002), who estimate the total dust luminosity at by using the IRAS 60 and 100 fluxes.444The contribution at 8–40 is neglected since the contribution from these wavelengths to the total FIR is small (at most 30 per cent). The contribution at is included, while it is not included in the FIR luminosity defined by Helou, Soifer, & Rowan-Robinson (1985). The data are summarized in Appendix A.
We adopt the radio-to-FIR ratio as usually used (e.g. Condon, 1992). Here we define as
| (8) |
The average of for the global luminosities is with a standard deviation of 0.34. We show the lines with constant in Fig. 3. We observe that the data points for the central star-forming regions in our sample are consistent with the range of (i.e. ) that explains the global radio–FIR relation of BCDs.
Naively, it would be expected that low-metallicity galaxies have relatively small amount of dust, so that the stellar emission may not be efficiently reprocessed into FIR (Hirashita & Hunt, 2008). On the other hand, free–free emission does not have such a dependence on metallicity (or dust abundance). Thus, we would expect systematically smaller for low-metallicity galaxies. However, NGC 5253 [], compared with He 2-10 [], does not follow this expectation, which means that even a low metallicity environment can reprocess the stellar light into FIR with a similar efficiency to a solar metallicity environment. As we can see in Table 2, the dust optical depth is comparable between He 2-10 and NGC 5253, although the dust mass is smaller in NGC 5253 than in He 2-10. This is because the distribution of dust is more compact in NGC 5253 than in He 2-10. A compact geometry of dust distribution tends to predict a high dust temperature (e.g. Takeuchi et al., 2005), explaining the observed higher dust temperature in NGC 5253 than in He 2-10. The radio–FIR relation of II Zw 40 is still uncertain because of the uncertainty in . However, it is still possible that this galaxy has a similar to the other two galaxies. If its is significantly smaller than the other two galaxies, we need to consider the reason other than the metallicity, since NGC 5253, which has a similar metallicity to II Zw 40, has a value as large as that of a solar metallicity object, He 2-10.
The radio–FIR relation of star-forming dwarf galaxies is similar to that of normal galaxies in spite of the difference in metallicity (Klein et al. 1991; Hopkins, Schulte-Ladbeck, & Drozdovsky 2002; Wu et al. 2008), although some specific galaxies show deviations (Cannon et al., 2006). Thus, metallicity (or dust content) cannot be the dominant factor that governs the radio–FIR relation. Cannon et al. (2005) find a spatial variation of FIR-to-radio ratio by an order of magnitude in a metal poor dwarf galaxy, IC 2574. Dumas et al. (2011) also show different radio–FIR relations between spiral arms and interarm regions in M51. These observations also support the above statement that metallicity is not the dominant factor that varies the FIR-to-radio ratio. The robustness of the FIR-to-radio ratio among our BCD sample is further discussed and interpreted in Section 4.1.
3.6 Molecular gas
Gas mass provides the normalization in estimating star formation efficiency and dust-to-gas ratio. The observed wavelength range also covers the CO(3–2) rotational transition line at 345.796 GHz (at rest). Although quite a lot of detections are reported for CO in He 2-10 (e.g. Baas, Israel, & Koornneef, 1994; Kobulnicky et al., 1995; Vanzi et al., 2009), we use our data which have the advantage of covering the the same range. In Table 3, we summarize the quantities derived by our CO(3–2) data.
The spectra around the expected wavelength of CO(3–2) are shown in Fig. 4. The emission is only detected in He 2-10. For II Zw 40, we failed to obtain the data at GHz. Yet, we can conclude that CO(3–2) is not detected in this galaxy at the expected frequency.
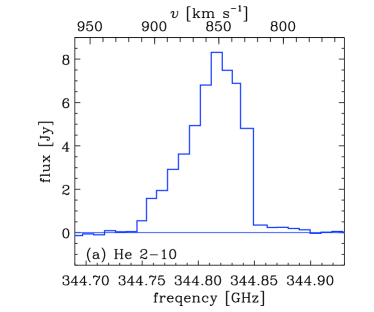
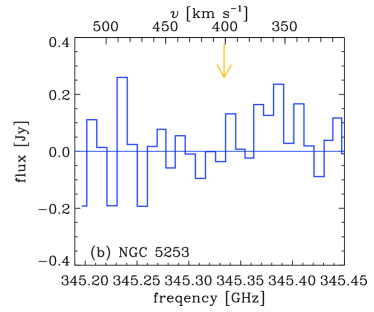
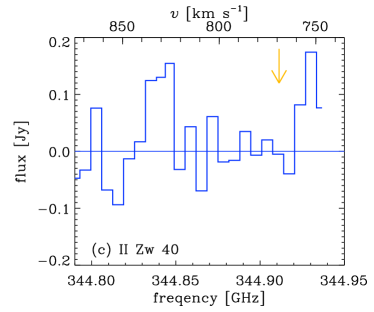
For He 2-10, we derive the CO(3–2) line flux (), the FWHM of the line in units of velocity (), and the radius of the CO emitting region [, where and are respectively the FWHM major and minor axes; Meier et al. (2002)]. For NGC 5253 and II Zw 40, we derive upper limits for the CO(3–2) line flux. The total mass (dynamical mass) in the central region traced by SMA can be estimated by (MacLaren, Richardson, & Wolfendale, 1988; Meier et al., 2002)
| (9) |
The molecular mass denoted as is estimated as (Meier et al., 2001)
| (10) | |||||
where is the Galactic conversion factor (Strong et al., 1988), is the metallicity-dependent conversion factor (Arimoto, Sofue, & Tsujimoto, 1996), and is the CO(3–2)/CO(1–0) line ratio. We adopt for all the sample as a representative value for dwarf starbursts (Meier et al., 2001). The molecular gas mass is compared to the dust mass and the stellar mass to obtain, respectively, the dust-to-gas mass ratio (), and [], which under normal conditions (in particular no molecule destruction), provides the star-formation efficiency.
| Object | |||||||||
| (Jy km s-1) | (km s-1) | (arcsec) | (pc) | () | () | () | |||
| He 2-10 | 6.48 | 330 | 0.97 | 0.08–0.11 | 0.50–0.98 | ||||
| NGC 5253 | — | — | — | — | 6.0 | ||||
| II Zw 40 | — | — | — | — | 6.2 | ||||
a 3 upper limits with km s-1.
We detected CO(3–2) only in He 2-10, while we obtained only upper limits for NGC 5253 and II Zw 40. Our observations are sensitive only to the centrally concentrated component. Diffuse components, if any, may be resolved out. Table 3 indicates that for the central star-forming region of He 2-10 with km s-1. Vanzi et al. (2009) reported km s-1 for the central 20 arcsec in He 2-10. Meier et al. (2001) estimate and for He 2-10 and NGC 5253, respectively. Their large velocities and masses are due to different spatial scales traced. No CO(3–2) detection has been reported for II Zw 40, but the molecular mass derived from CO(2–1) and CO(1–0) ( M☉) is not contradictory with our upper limit.
In the He 2-10 centre, , and the stellar mass only occupies a small fraction ( per cent) of the total mass. A star formation efficiency of per cent is near the values derived for the Galactic giant molecular clouds (Lada, Lombardi, & Alves, 2010). The dust-to-gas ratio is significantly smaller than the Galactic value (; Spitzer 1978) although the metallicity is similar. This is probably because we only trace the high-temperature dust component that is directly heated by the current starburst without being shielded by other dust components. A similar underestimate of dust mass is also reported by Sun & Hirashita (2011). Thus, we may miss a large amount of dust if a small amount of dust efficiently shields the stellar light.
For the low-metallicity objects, NGC 5253 and II Zw 40, the upper limits of molecular gas mass can be used to constrain the lower limits for and . Both objects have significantly larger than He 2-10. This is interpreted in two ways: (i) the star formation efficiency is actually high, or (ii) molecular gas is dissociated quickly ( Myr), causing an underestimate of the total gas mass. These two possibilities are further discussed in Section 4.3.
4 Discussion
4.1 Free–free contribution at 880
In H11, the 880 luminosity in the II Zw 40 centre is shown to be dominated by free–free emission. This is why H11 suggests that free–free dominated emission at can be used to select extremely young starbursts ( Myr). In this paper, this is confirmed in the sense that the central star-forming regions in He 2-10 and NGC 5253 also have significant contributions of free–free emission at 880 (Section 2). There is a hint in Table 1 that as metallicity becomes higher the free–free fraction becomes lower (i.e. the fraction of dust emission becomes higher). This trend should be checked with a larger sample in the future.
Although free–free emission has a significant contribution even at 880 [while global 880 emission (‘global’ refers to the integrated emission of the entire galaxy) is generally dominated by dust (e.g. Hunt et al., 2005)], the radio–FIR relation of the central regions in our sample BCDs is surprisingly consistent with that defined by using global luminosities as shown in Fig. 3. This is probably due to the high dust temperatures, which enhance the FIR luminosity and compensates the small contribution from dust emission at 880 . Therefore, it is possible that this compensating effect is a key to understand the robustness of the radio–FIR relation.
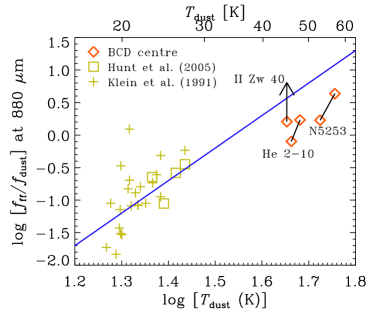
The robustness of the radio–FIR relation may simply reflect the fact that both radio and FIR luminosities are good indicators of star formation activities (Condon, 1992). If we assume the robustness of the radio–FIR relation, we can explain the small contribution of dust emission at 880 in comparison with free–free emission as follows. By assumption, the free–free flux at 880 [] is just proportional to the total FIR flux, which is proportional to (for dust mass absorption coefficient ; Draine & Lee 1984). On the other hand, if the Rayleigh–Jeans approximation is valid, the 880 dust flux, , is proportional to . Therefore, , which indicates that the fraction of free–free emission at 880 is larger for a higher dust temperature.
To examine this temperature dependence of the free–free fraction, we plot at 880 in terms of for the global emission in the BCDs which were used to plot the radio–FIR relation in Fig. 3 (i.e. the samples taken from Hunt et al., 2005; Klein et al., 1991). For these BCDs, we estimate at 880 as described in Appendix A. The free–free flux at 880 () is estimated by converting the free–free flux at 15 GHz used in Fig. 3 to that at 880 by assuming a frequency dependence of . We also plot our SMA sample for the central parts in BCDs. We find that there is a positive trend of with as expected above. We also draw a line with with an arbitrary normalization in Fig. 5. This line roughly bridges our sample and the above samples, although the large scatter of the data implies that our discussion may be too simplified. Supported by the correlation between and , we conclude that the large contribution of free–free emission in our observation is a natural consequence of picking up active star-forming regions which have high dust temperatures.
The large free–free fraction in the central star-forming regions of our sample indicates that the subtraction of free–free emission at submillimetre wavelengths is a critical step in studying the dust emission. Galliano et al. (2005) find that the submm excess in some BCDs needs to be fitted with ‘very cold grains’, whose derived abundance may be sensitive to the subtraction of free–free emission. Submm excess is preferentially seen in low-metallicity dwarf galaxies (Galametz et al., 2011). Since we have assumed that the SMA 880 flux is dominated by the warm dust component heated by young stars, we cannot test the existence of this very cold component in the central star-forming regions. We need to wait for multi-wavelength observations at FIR–submm wavelengths with spatial resolutions of a few arcsec to tackle this issue.
4.2 Dust abundance
As mentioned in Section 3.4, the dust-to-stellar mass ratio is larger in He 2-10 than in the other two galaxies, while as shown in Section 3.6, the dust-to-molecular gas mass ratio does not necessarily trace the trend of metallicity. The dust-to-gas ratio derived for He 2-10 is much lower than the Galactic dust-to-gas ratio (; Spitzer 1978), although He 2-10 is a solar-metallicity object. As interpreted in Section 3.6, the dust mass in He 2-10 may be underestimated because we only trace the dust directly heated by the central star clusters; that is, the dust mass estimate from dust emission is not sensitive to the dust in regions where the UV radiation from the central stars is shielded.
As argued in H11, the observed dust should either be preexisting or have grown by accretion in the dense star-forming regions. According to Hirashita & Kuo (2011) (see also Inoue, 2011; Asano et al., 2012), the dust-growth time-scale for silicate (a similar time-scale is obtained for carbonaceous dust) is estimated as
| (11) | |||||
where and are the averages of and ( is the grain radius) for the grain size distribution (we adopt ), is the metallicity (we adopt , 0.28, and 0.28 Z☉ for He 2-10, NGC 5253, and II Zw 40, respectively, by assuming that the solar oxygen abundance is ; Lodders 2003), is the hydrogen number density (we adopt cm-3 for the dense star-forming regions in BCDs; H11), is the gas temperature (we adopt K; Wilson, Walker, & Thornley 1997) and is the sticking efficiency of the relevant metal species onto the dust surface (we adopt ; Leitch-Devlin & Williams 1985; Grassi et al. 2011). Then, we obtain , 0.75 and 0.75 Myr for He 2-10, NGC 5253, and II Zw 40, respectively. These time-scales are shorter than or comparable to the ages of the star-forming regions ( a few Myr). Therefore, dust growth by the accretion of gas-phase metals can be an effective mechanism of increasing the dust content in the central star-forming regions of those BCDs.
4.3 Molecular gas properties
In Section 3.6, we have shown that the evaluated star formation efficiencies in the central parts of the low-metallicity BCDs (NGC 5253 and II Zw 40) are high. Such high star formation efficiencies in low-metallicity galaxies are already reported when CO emission is used for the molecular gas tracer (e.g. Schruba et al., 2012). However, no physical mechanism that makes the star formation in metal-poor gas efficient is known. Hirashita & Ferrara (2002) suggest that star formation is rather inefficient in low metallicity (i.e. low dust-to-gas ratio) environments because of inefficient H2 formation (see also Gnedin & Kravtsov, 2011). Another interpretation of the high star formation efficiencies is that CO is more easily dissociated in low-metallicity environments because of less shielding of dissociating photons by dust (Wolfire, Hollenbach, & McKee, 2010; Krumholz, Leroy, & McKee, 2011; Shetty et al., 2011). Leroy et al. (2011) suggest that CO dissociation effect becomes dominant below –8.4, which is consistent with CO deficiency of NGC 5253 and II Zw 40. In such a case, CO is not a good tracer of the total gas mass, and the gas mass estimated from CO is an underestimate. The high dust-to-gas ratio in NGC 5253 can be an artifact of an underestimate of the molecular gas mass.
In order to present the deficiency of CO more clearly, we show the relation between CO luminosity and FIR luminosity in Fig. 6. As a reference, we also show the global (i.e. entire galaxy) relation of a dwarf sample in Meier et al. (2001) (originally from Mauersberger et al. 1999). Compared with this relation (solid line), our SMA data point for NGC 5253 is deviated downwards. This indicates that CO is depleted in the centre while the FIR dust emission still has a significant intensity there. The existence of the central dust emission demonstrates the existence of gas since gas and dust are generally well mixed and coexisting; thus, the natural interpretation of the deficient CO emission is that CO is highly dissociated in these low-metallicity galaxies. Another low-metallicity galaxy, II Zw 40, may also be deviated downward, but since we only obtained an upper limit for the FIR luminosity, II Zw 40 may be consistent with the global relation. The relatively rich molecular gas content in He 2-10 may be explained by a stronger shielding of dissociating radiation due to its rich dust content compared with the other two BCDs. This trend of CO abundance with metallicity is consistent with theoretical predictions by Krumholz et al (2011).
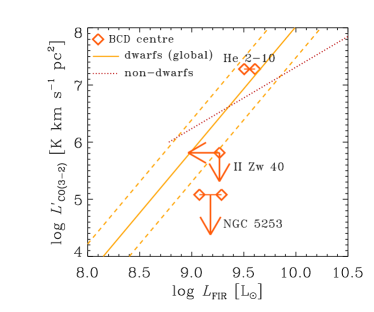
We also show in Fig. 6 a line for non-dwarf galaxies (mostly spiral galaxies). Such a correlation between CO and FIR luminosities has been well investigated (e.g. Gao & Solomon, 2004). The relation for the dwarf sample (solid line) is systematically deviated. The deviation is even larger if we focus on the central part of NGC 5253. It is probably because we pick up a region with an intense radiation field (i.e., strong CO dissociation) if we pick up the central region.
4.4 Implication for high-redshift observations
High-redshift starbursts are often traced by observations of dust continuum and/or CO (e.g. Michałowski et al., 2010). BCDs, which host compact star-forming regions with various evolutionary stages (i.e. various metallicities), provide good ‘laboratories’ of high- galaxies (or galaxy evolution), although our sample size is still limited. For the He 2-10 centre, the gas mass derived from the CO observation through a conventional conversion factor matches the total dynamical mass for the He 2-10 centre, supporting that CO is a good tracer of the total gas mass in this particular BCD. However, as discussed in Section 3.6, large values of star formation efficiency in low-metallicity BCDs, NGC 5253 and II Zw 40, imply that CO luminosity is not necessarily a good indicator of the total gas mass in low-metallicity starburst environments. Thus, if a high- galaxy has a metallicity significantly lower than solar, CO luminosity has the risk of underestimating the total gas mass.
This underestimate of gas mass propagates to the estimate of dust-to-gas ratio. Moreover, there is a potential risk of underestimating dust mass because we may miss low-temperature dust components, which are less luminous than high-temperature components directly heated by the current starbursts (Section 4.2). Thus, as long as we trace the dust content by emission and the gas content by CO lines, there is a possibility that the obtained dust-to-gas ratio is not reliable.
For the origin of dust, it is suggested that dust growth is the most efficient mechanism of dust production in high-redshift starbursts (Mattsson, 2011; Valiante et al., 2011). As suggested in our BCD observations (Section 4.2), high gas densities in intense starbursts make the grain growth time-scale short.
5 Conclusion
In order to reveal the submm–radio radiative properties of young active starbursts in BCDs, the central star-forming regions in He 2-10, NGC 5253, and II Zw 40 were observed in the 340 GHz (880 ) band at resolution with SMA. The 880 fluxes have been decomposed into free–free and dust emission components by using centimetre radio data in the literature. At 880 , free–free emission has proven to have a contribution comparable to or larger than dust emission in the central part of all the three BCDs. We have also shown that the fraction of free–free emission at 880 has a positive correlation with the dust temperature. In spite of the dominance of free–free emission at 880 , the radio–FIR relation of the central parts in the BCDs is consistent with the relation defined for the global luminosities (i.e. the luminosities in the entire system), supporting the robustness of the radio–FIR correlation. Finally, we have analyzed the CO(3–2) emission line, finding that CO is a good tracer of the total gas mass in He 2-10, while CO is deficient in the low-metallicity BCDs (NGC 5253 and II Zw 40), probably due to inefficient shielding of dissociating photons in dust-poor environments. We also point out that the dust mass may be potentially underestimated since emission is always biased to the dust directly heated by the stars. Thus, we should keep in mind these potential underestimates of gas and dust masses in interpreting submm observations of not only nearby galaxies but also high-redshift galaxies.
Acknowledgments
We thank K. Sakamoto for his continuous help for the SMA observation and the data analysis, and S. Beck and S. Matsushita for helpful discussions on gas and dust emission properties of galaxies. We thank the SMA staff for their efforts in running and maintaining the array. We are grateful to the anonymous referee for useful comments that improved this paper very much. This research has made use of the NASA/IPAC Extragalactic Database (NED), which is operated by the Jet Propulsion Laboratory, California Institute of Technology, under contract with the National Aeronautics and Space Administration. This research is supported through NSC grant 99-2112-M-001-006-MY3.
References
- Arimoto, Sofue, & Tsujimoto (1996) Arimoto, N., Sofue, Y., & Tsujimoto, T. 1996, PASJ, 48, 275
- Asano et al. (2012) Asano, R., Takeuchi, T. T., Hirashita, H., & Inoue, A. K. 2012, Earth, Planets Space, in press
- Baas, Israel, & Koornneef (1994) Baas, F., Israel, F. P., & Koornneef, J. 1994, A&A, 284, 403
- Beck, Turner, & Gorjian (2001) Beck, S. C., Turner, J. L., & Gorjian, V. 2001, AJ, 122, 1365
- Beck et al. (2002) Beck, S. C., Turner, J. L., Langland-Shula, L. E., Meier, D. S., Crosthwaite, L. P., & Gorjian, V. 2002, AJ, 124, 2516
- Caldwell & Phillips (1989) Caldwell, N., & Phillips, M. M. 1989, ApJ, 338, 789
- Cannon et al. (2005) Cannon, J. M., et al. 2005, ApJ, 630, L37
- Cannon et al. (2006) Cannon, J. M., et al. 2006, ApJ, 647, 293
- Chandar et al. (2005) Chandar, R., Leitherer, C., Tremonti, C. A., Calzetti, D., Aloisi, A., Meurer, G. R., & de Mello, D. 2005, ApJ, 628, 210
- Condon (1992) Condon, J. J. 1992, ARA&A, 30, 575
- Deeg, Duric, & Brinks (1997) Deeg, H.-J., Duric, N., & Brinks, E. 1997, A&A, 323, 323
- de Jong et al. (1985) de Jong, T., Klein, U., Wielebinski, R., & Wunderlich, E. 1985, A&A, 147, L6
- Draine & Anderson (1985) Draine, B. T., & Anderson, N. 1985, ApJ, 292, 494
- Draine & Lee (1984) Draine, B. T., & Lee, H. M. 1984, ApJ, 285, 89
- Dumas et al. (2011) Dumas, G. Schinnerer, E., Tabatabaei, F. S., Beck, R., Velusamy, T., & Murphy, E. 2011, AJ, 141, 41
- Fazio et al. (2004) Fazio, G. G., et al. 2004, ApJS, 154, 10
- Galametz et al. (2011) Galametz, M., Madden, S. C., Galliano, F., Hony, S., Bendo, G. J., & Sauvage, M. 2011, A&A, 532, A56
- Galliano et al. (2005) Galliano, F., Madden, S. C., Jones, A. P., Wilson, C. D., & Bernard, J.-P. 2005, A&A, 434, 867
- Gao & Solomon (2004) Gao, Y., & Solomon, P. M. 2004, ApJ, 606, 271
- Gnedin & Kravtsov (2011) Gnedin, N. Y., & Kravtsov, A. V. 2011, ApJ, 728, 88
- Gorjian (1996) Gorjian, V. 1996, AJ, 112, 1886
- Grassi et al. (2011) Grassi, T., Krstic, P., Merlin, E., Buonomo, U., Piovan, L., & Chiosi, C. 2011, A&A, 533, A123
- Helou, Soifer, & Rowan-Robinson (1985) Helou, G., Soifer, B. T., & Rowan-Robinson, M. 1985, ApJ, 298, L7
- Hirashita (2011) Hirashita, H. 2011, MNRAS, 418, 828 (H11)
- Hirashita & Ferrara (2002) Hirashita, H., & Ferrara, A. 2002, MNRAS, 337, 921
- Hirashita & Hunt (2006) Hirashita, H., & Hunt, L. K. 2006, A&A, 460, 67
- Hirashita & Hunt (2008) Hirashita, H., & Hunt, L. K. 2008, Mapping the Galaxy and Nearby Galaxies (Ap&SS Proceedings Ser.), ed. K. Wada & F. Combes, p. 333
- Hirashita & Kuo (2011) Hirashita, H., & Kuo, T.-M. 2011, MNRAS, 416, 1340
- Hirashita, Tajiri, & Kamaya (2002) Hirashita, H., Tajiri, Y. Y., & Kamaya, H. 2002, A&A, 388, 439
- Ho, Moran, & Lo (2004) Ho, P. T. P., Moran, J. M., & Lo, K. Y. 2004, ApJ, 616, L1
- Hopkins, Schulte-Ladbeck, & Drozdovsky (2002) Hopkins, A. M., Schulte-Ladbeck, R. E., & Drozdovsky, I. O. 2002, AJ, 124, 862
- Hunt et al. (2005) Hunt, L. K., Bianchi, S., & Maiolino, R. 2005, A&A, 434, 849
- Inoue (2011) Inoue, A. K. 2011, Earth, Planets Space, 63, 1027
- Inoue, Hirashita, & Kamaya (2000) Inoue, A. K., Hirashita, H., & Kamaya, H. 2000, PASJ, 52, 539
- James et al. (2002) James, A., Dunne, L., Eales, S., Edmunds, M. G. 2002, MNRAS, 335, 753
- Johnson & Kobulnicky (2003) Johnson, K. E., & Kobulnicky, H. A. 2003, ApJ, 597, 923
- Johnson et al. (2000) Johnson, K. E., Leitherer, C., Vacca, W. D., & Conti, P. 2000, AJ, 120, 1273
- Kennicutt (1998) Kennicutt, R. C., Jr. 1998, ARA&A, 36, 189
- Klein et al. (1991) Klein, U., Weiland, H., & Brinks, E. 1991, A&A, 246, 323
- Kobulnicky et al. (1995) Kobulnicky, H. A., Dickey, J. M., Sargent, A. I., Hogg, D. E., & Conti, P. S. 1995, AJ, 110, 116
- Kobulnicky & Johnson (1999) Kobulnicky, H. A., & Johnson, K. E. 1999, ApJ, 527, 154
- Kobulnicky, Kennicutt, & Pizagno (1999) Kobulnicky, H. A., Kennicutt, R. C., Jr., & Pizagno, J. L. 1999, ApJ, 514, 544
- Krumholz et al (2011) Krumholz, M. R., Leroy, A. K., & McKee, C. F. 2011, ApJ, 731, 25
- Kunth & Östlin (2000) Kunth, D., & Östlin, G. 2000, A&AR, 10, 1
- Lada, Lombardi, & Alves (2010) Lada, C. J., Lombardi, M., & Alves, J. F. 2010, ApJ, 724, 687
- Lasker et al. (1990) Lasker, B. M., Sturch, C. R., McLean, B. J., Russell, J. L., Jenkner, H., & Shara, M. M. 1990, AJ, 99, 2019
- Leitch-Devlin & Williams (1985) Leitch-Devlin, M. A., & Williams, D. A. 1985, MNRAS, 213, 295
- Leroy et al. (2011) Leroy, A. K., et al. 2011, ApJ, 737, 12
- Lisenfeld et al. (2007) Lisenfeld, U., et al. 2007, A&A, 462, 507
- Lisenfeld & Ferrara (1998) Lisenfeld, U., & Ferrara, A. 1998, ApJ, 496, 145
- Lodders (2003) Lodders, K. 2003, ApJ, 591, 1220
- López-Sánchez & Esteban (2010) López-Sánchez, Á. R. & Esteban, C. 2010, A&A, 517, A85
- MacLaren, Richardson, & Wolfendale (1988) MacLaren, I., Richardson, K. M., & Wolfendale, A. W. 1988, ApJ, 333, 821
- Madden (2000) Madden, S. 2000, NewAR, 44, 249
- Mattsson (2011) Mattsson, L. 2011, MNRAS, 414, 781
- Mauersberger et al. (1999) Mauersberger, R., Henkel, C., Walsh, W., Schulz, A. 1999, A&A, 341, 256
- Meier et al. (2002) Meier, D. S., Turner, J. L., & Beck, S. C. 2002, AJ, 124, 877
- Meier et al. (2001) Meier, D. S., Turner, J. L., Crosthwaite, L. P., & Beck, S. C. 2001, AJ, 121, 740
- Michałowski et al. (2010) Michałowski, M. J., Murphy, E. J., Hjorth, J., Watson, D., Gall, C., & Dunlop, J. S. 2010, A&A, 522, A15
- Moshir et al. (1990) Moshir, M., et al. 1990, IRAS Faint Source Catalog, Version 2.0 (Pasadena: Infrared Processing and Analysis Centre)
- Nagata et al. (2002) Nagata, H., Shibai, H., Takeuchi, T. T., & Onaka, T. 2002, PASJ, 54, 695
- Onaka et al. (2007) Onaka, T., et al. 2007, PASJ, 59, S401
- Osterbrock (1989) Osterbrock, D. E. 1989, Astrophysics of Gaseous Nebulae and Active Galactic Nuclei (Mill Valley: University Science Books)
- Raiter, Schaerer, & Fosbury (2010) Raiter, A., Schaerer, D., & Fosbury, R. A. E. 2009, A&A, 523, A64
- Sage et al. (1992) Sage, L. J., Salzer, J. J., Loose, H.-H., & Henkel, C. 1992, A&A, 265, 19
- Sargent & Searle (1970) Sargent, W. L. W., & Searle, L. 1970, ApJ, 162, L155
- Schaerer (2002) Schaerer, D. 2002, A&A, 382, 28
- Schmidt & Boller (1993) Schmidt, K.-H., & Boller, T. 1993, Astron. Nachr., 314, 361
- Schruba et al. (2012) Schruba, A., et al. 2012, AJ, 143, 138
- Shetty et al. (2011) Shetty, R., Glover, S. C., Dullemond, C. P., & Klessen, R. S. 2011, MNRAS, 412, 1686
- Spitzer (1978) Spitzer, L. 1978, Physical Processes in the Interstellar Medium (New York: Wiley)
- Strong et al. (1988) Strong, A. W., et al. 1988, A&A, 207, 1
- Sun & Hirashita (2011) Sun, A.-L., & Hirashita, H. 2011, MNRAS, 411, 1707
- Takeuchi et al. (2005) Takeuchi, T. T., Buat, V., Iglesias-Páramo, J., Boselli, A., & Burgarella, D. 2005, A&A, 432, 423
- Takeuchi et al. (2005) Takeuchi, T. T., Ishii, T. T., Nozawa, T., Kozasa, T., & Hirashita, H. 2005, MNRAS, 362, 592
- Thuan & Izotov (2005) Thuan, T. X., & Izotov, Y. I. 2005, ApJS, 161, 240
- Tully (1988) Tully, R. B. 1988, Nearby Galaxies Catalog, Cambridge University Press, Cambridge
- Turner & Beck (2004) Turner, J. L., & Beck, S. C. 2004, ApJ, 602, L85
- Turner et al. (1998) Turner, J. L., Ho, P. T. P., & Beck, S. C. 1998, AJ, 116, 1212
- Vacca & Conti (1992) Vacca, W. D., & Conti, P. S. 1992, ApJ, 401, 543
- Valiante et al. (2011) Valiante, R., Schneider, R., Salvadori, S., & Bianchi, S. 2011, MNRAS, 416, 1916
- van Zee, Skillman, & Salzer (1998) van Zee, L., Skillman, E. D., & Salzer, J. J. 1998, AJ, 116, 1186
- Vanzi et al. (2009) Vanzi, L., Combes, F., Rubio, M., & Kunth, D. 2009, A&A, 496, 677
- Vanzi et al. (2008) Vanzi, L., Cresci, G., Telles, E., & Melnick, J. 2008, A&A, 486, 393
- Wilson, Walker, & Thornley (1997) Wilson, C. D., Walker, C. E., & Thornley, M. D. 1997, ApJ, 483, 210
- Wolfire, Hollenbach, & McKee (2010) Wolfire, M. G., Hollenbach, D., & McKee, C. F. 2010, ApJ, 716, 1191
- Wu et al. (2008) Wu, Y., Charmandaris, V., Houck, J. R., Bernard-Salas, J., Lebouteiller, V., Brandl, B. R., & Farrah, D. 2008, ApJ, 676, 970
- Yamasawa et al. (2011) Yamasawa, D., Habe, A., Kozasa, T., Nozawa, T., Hirashita, H., Umeda, H., & Nomoto, K. 2011, ApJ, 735, 44
Appendix A Data for the radio–FIR relation
We collected radio fluxes around 2 cm (15 GHz) and FIR (IRAS 60 and 100 ) fluxes of BCDs in the literature. We adopt Hunt et al. (2005) and Klein et al. (1991) (Tables 4 and 5, respectively). The flux listed in these two tables is a global flux (i.e. flux from the entire galaxy). For the radio fluxes in Hunt et al. (2005), if more than two data are available at the same wavelength, we adopt the data in the lowest-resolution mode, which is expected to have the smallest missing flux. We select BCDs with detections both at IRAS 60 and 100 , and at 2 cm (15 GHz). For Klein et al. (1991)’s sample, we adopt the Effelsberg 2.8 cm flux and convert it to the 2 cm flux by adopting average radio spectral indices given in Table 6 of Klein et al. (1991). We exclude BCDs without detection by IRAS. The IRAS fluxes of Klein et al. (1991)’s samples are taken from Moshir et al. (1990).
For these samples, we need to estimate dust temperatures and fluxes at 880 in Fig. 5. We adopt the following estimator, , for the dust temperature (Nagata et al., 2002):
| (12) |
We use this dust temperature for in the text. By using , the dust flux at 880 is estimated as
| (13) | |||||
| Galaxya | |||||
|---|---|---|---|---|---|
| (mJy) | (Jy) | (Jy) | (Mpc) | ||
| Haro 14 | 13.9 | ||||
| Haro 15 | 95.4 | ||||
| Mrk 370 | 12.9 | ||||
| II Zw 40 | 10.5 | ||||
| Haro 1 | 52.0 | ||||
| Mrk 86 | 7.0 | ||||
| Mrk 401 | 22.2 | ||||
| Haro 23 | 17.4 | ||||
| Mrk 140 | 22.7 | ||||
| Haro 2 | 20.5 | ||||
| Haro 3 | 13.9 | ||||
| Mrk 186 | 11.1 | ||||
| Mrk 169 | 17.4 | ||||
| Haro 28 | 10.7 | ||||
| Mrk 49 | 18.2 | ||||
| Haro 9 | 13.9 | ||||
| Mrk 59 | 11.6 | ||||
| II Zw 70 | 17.1 | ||||
| Mrk 297 | 63.0 | ||||
| Mrk 313 | 30.8 | ||||
| Mrk 314 | — | 31.1 | |||
| III Zw 102 | 25.0 |
b Since is not available, we assume the mean value obtained in Klein et al. (1991).
c Since the flux given by Klein et al. (1991) is probably overestimated because of confusion with nearby sources, we replaced the value with an interferometric flux at 2 cm (15 GHz) given by Deeg, Duric, & Brinks (1997).
Note: Mrk 527 was originally included in the sample of Klein et al. (1991). Because of the suspected contamination of nearby sources, this galaxy is not included in our sample.