Data reduction pipeline for the MMT Magellan Infrared Spectrograph
Abstract
We describe principal components of the new spectroscopic data pipeline for the multi-object MMT/Magellan Infrared Spectrograph (MMIRS). The pipeline is implemented in idl and C++. The performance of the data processing algorithms is sufficient to reduce a single dataset in 2–3 min on a modern PC workstation so that one can use the pipeline as a quick-look tool during observations. We provide an example of the spectral data processed by our pipeline and demonstrate that the sky subtraction quality gets close to the limits set by the Poisson photon statistics.
1 Introduction
MMIRS (McLeod et al. 2012) is a new near-infrared spectrograph and imager which can operate at f/5 focii of either the MMT or the Magellan Clay 6.5m telescopes. MMIRS addresses a 47 arcmin field of view for multi-object spectroscopy (MOS) and is equipped with a 2K2K HAWAII-2 array. It can also operate as a single-object spectrograph with a 7 arcmin long 0.2–3 arcsec wide slit. Here we present the data reduction pipeline which handles data obtained in the MOS and long slit modes.
2 Pipeline design and implementation
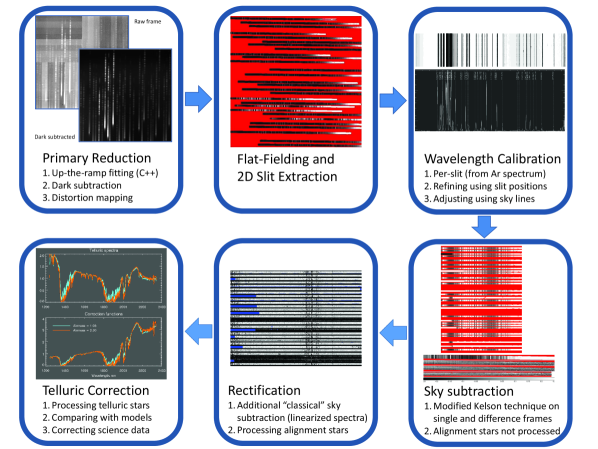
The MMIRS spectroscopic data reduction pipeline is a stand-alone idl package with the most computationally intensive step implemented in C++. It is controlled by a task control file having a format resembling a FITS header, i.e. a set of keyword–value pairs. This file can be created either manually in a text editor or automatically from a database containing observational metadata generated after each observing run. Then it can be edited in order to perform specific data reduction steps or adjust certain parameters of data processing algorithms. The following steps are executed for every observing block represented by a pair of spectra spatially dithered along the slit (see Fig. 1).
Fitting the up-the-ramp slope in every pixel and obtaining a 2-dimensional image. At present, this step is performed by the mmfixen package implemented in C++. It allows us to detect cosmic ray hits, recover the counts in most cases unless the cosmic ray hits the detector in the very beginning of exposure, as well as to handle saturation and detector non-linearity at high counts.
Dark subtraction and scattered light subtraction is done using up-the-ramp processed 2D frames. We average several dark frames which are obtained during observations for every read-out setup and subtract them from science and calibration frames. Then we create subtracted dithered pairs of images which are then processed through the pipeline along with individual exposures. To subtract the scattered light (only for MOS data), the pipeline analyses the MOS mask definition files, then uses them to trace the spectra and gaps between them on a dark subtracted spectral flat field exposure. Then, a smooth background model is constructed from gap counts in all types of frames (science, calibrations, telluric standards) using low-order polynomials.
Mapping the optical distortions is done using spectral traces from the previous step. We use a low order 2D polynomial approximation to describe distortions coming from both, collimator and camera. The distortion map accounts not only for optical distortions but also for the imperfect positioning of the grism causing the tilt of spectra with respect to the detector edge by up-to 0.7 deg).
Extraction of 2D spectra and flat fielding is done by analysing mask definition files and extracting the bounding boxes of every spectrum. Then we create a normalized flat field and correct all exposures by it. This is a critical step in the NIR data reduction as pixel-to-pixel variations in the HAWAII-2 detector reach 35 per cent.
The wavelength calibration is done in several steps. At first, the argon lines from the comparison spectrum frame are automatically identified and the initial wavelength solution is approximated using a low order 2D polynomial. This step applied to the entire frame in the long-slit mode or to every extracted slit in the MOS mode. Alignment stars where spectral lines are too broad are not processed at this stage. The second step of the wavelength calibration applies only to MOS data: we approximate the coefficients in all slits simultaneously as low order 2D polynomials of the (X,Y) position on the mask. This allows us to handle alignment star boxes by evaluating the polynomial at their measured positions. The last step which is also applied to the long-slit data accounts for imperfect cutting of the slit masks: we create a “template spectrum” using the science frame assuming that targets are faint and airglow lines are prominent and bright (or arc lines in case of bright targets or short exposure times) which is then cross-correlated at every position across dispersion in order to determine small residual shifts which are then included into the final wavelength solution.
Sky subtraction is one of the most critical steps in the NIR data reduction. NIR night sky spectrum contains rapidly changing very bright emission lines (mostly hydroxyl, OH) as well as the continuum background. Targets observed with MMIRS with integration times of many hours are up-to hundreds of times fainter than the night sky level. Therefore high quality sky subtraction is essential. We use a hybrid approach using a combination of the classical “difference imaging” and a recently developed sky subtraction technique. Difference image contains the residual night sky emission originating from the temporal variation of OH line fluxes which may reach tens of per cent over 5–10 min. We apply the modified Kelson (2003) technique to the difference images in order to remove the residual night sky emission. This technique uses non-resampled spectra and precise pixel-to-wavelength mapping in order to create the oversampled model of the night sky spectrum which is then parametrized using -splines and evaluated at every position at every slit. It allows one to avoid artefacts originating from the interpolation of sharp undersampled OH line profiles. However, this requires slit images on the detector frame to have sufficient curvature in order to well sample the line contours. While it works for long-slit observations, in the MOS mode the situation is different. For a typical slit length of 7–8 arcsec, the curvature in the central slit images is close to zero and it is between 1 and 2 pixels in the edges of the field of view. Therefore, in the MOS mode we use all the slits simultaneously assuming that their widths are the same and create the sky model using a 3D -spline/polynomial parametrization where the -splines describe the night sky model along the wavelength while across the field of view we use a 2D Legendre polynomial as a function of X and Y slit positions on the mask to account for smooth variations of -spline coefficients. By using this approach we get the sky subtraction quality close to the limit set by the Poisson photon statistics.
Final cosmic ray cleaning, linearisation and rectification is performed on sky subtracted frames. We use the modified Laplacian filtering technique (van Dokkum 2001) which handles both, negative and positive “hits” on difference images. At the end, we put the spectra into the linear wavelength scale and rectify the spectra by correcting the optical distortions which we mapped earlier.
Telluric absorption correction is the last step of the pipeline reduction where we use observations of a hot (typically A0V) star and compare it against the stellar atmosphere model in order to measure the water vapor absorption and correct science spectra for it. It also automatically calibrates the flux along the wavelength, although no absolute flux calibration is done.
The data post-processing is run after the pipeline processing and it includes the following steps: (1) co-adding multiple observing blocks; (2) extraction of 1D spectra. The final data product is available in several formats: (a) multi-extension FITS file with one extension per 2D extracted calibrated co-added spectrum; (b) single-extension FITS file with all extracted 1D spectra; (c,d) a Euro3D-FITS file for 2D and 1D extracted spectra. The first two files are accompanied with the files in the same format providing flux uncertainties, while this information is stored in the Euro3D-FITS format. MMIRS MOS spectra in the Euro3D-FITS format contain metadata making them Virtual Observatory compliant (Chilingarian et al. 2006, 2008).
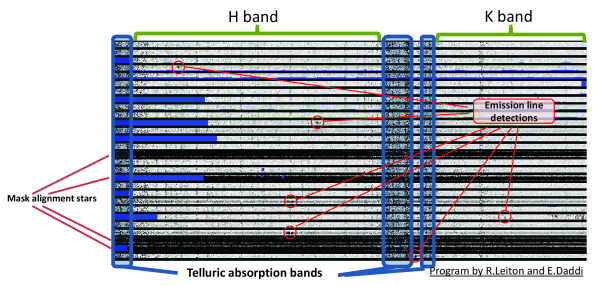
3 Example of a fully reduced dataset
In Fig. 2 we present an example of a dataset obtained in Dec 2011 in the low-resolution HK mode at the 6.5 m Magellan telescope. The integration time was 7h 20min. Our excellent sky subtraction quality leads to detections of faint galaxies ( mag).
References
- Chilingarian et al. (2006) Chilingarian, I., Bonnarel, F., Louys, M., & McDowell, J. 2006, in Astronomical Data Analysis Software and Systems XV, edited by C. Gabriel, C. Arviset, D. Ponz, & S. Enrique, vol. 351 of Astronomical Society of the Pacific Conference Series, 371
- Chilingarian et al. (2008) Chilingarian, I., Bonnarel, F., Louys, M., Zolotukhin, I., Royer, F., Jegouzo, I., Le Sidaner, P., Fernique, P., & Boch, T. 2008, in Astronomical Spectroscopy and Virtual Observatory, edited by M. Guainazzi & P. Osuna, 125. arXiv:0711.0412
- Kelson (2003) Kelson, D. D. 2003, PASP, 115, 688. arXiv:astro-ph/0303507
- McLeod et al. (2012) McLeod, B., Fabricant, D., Nystrom, G., McCracken, K., Amato, S., Bergner, H., Brown, W., Burke, M., Chilingarian, I., Conroy, M., Curley, D., Furesz, G., Geary, J., Hertz, E., Martini, P., Matthews, A., Norton, T., Park, S., & Roll, J. 2012, accepted to PASP. arXiv:1211.6174
- van Dokkum (2001) van Dokkum, P. G. 2001, PASP, 113, 1420. arXiv:astro-ph/0108003