Atmosphere dynamics of the active region NOAA 11024
Solar Physics
Abstract
We present results of the study of chromospheric and photospheric line-of-sight velocity fields in the young active region NOAA 11024. Multi-layer, multi-wavelength observational data were used for the analysis of the emerging flux in this active region. Spectropolarimetric observations were carried out with the telescope THEMIS on Tenerife (Canary Islands) on 4 July 2009. In addition, space-borne data from SOHO/MDI, STEREO and GOES were also considered. The combination of data from ground- and space-based telescopes allowed us to study the dynamics of the lower atmosphere of the active region with high spatial, spectral, and temporal resolutions. THEMIS spectra show strong temporal variations of the velocity in the chromosphere and photosphere for different activity features: two pores, active and quiet plage regions, and two surges. The range of variations of the chromospheric line-of-sight velocity at the heights of formation of the H core was extremely large. Both upward and downward motions were observed in these layers. In particular, a surge with upward velocities up to -73 km s-1 were detected. In the photosphere, predominantly upward motions were found, varying from -3.1 km s-1 upflows to 1.4 km s-1 downflows in different structures. The velocity variations at different levels in the lower atmosphere are compatible with magnetic flux emergence.
keywords:
Solar active regions, chromosphere, photosphere, line-of-sight velocity, plages, surges1 Introduction
S-Introduction
The transition phase between Solar Cycles 23 and 24 was unusually long and had a lot of peculiarities, including unusually low levels of sunspot, flare, and geomagnetic activity. The Sun was very quiet in 2009 – 260 days without sunspots. Such low activity in the transition period was not predicted and became a surprise. Observational data may contribute to a better understanding of the physical processes at this period and the beginning of the new solar cycle.
In this work we study the line-of-sight velocity field in the lower atmosphere of the active region NOAA 11024 observed on the solar disk from 29 June to 11 July 2009. NOAA 11024 was the first active region belonging to the new cycle that emerged in the southern hemisphere of the Sun. It appeared at a latitude of about -27 degrees. This is consistent with the butterfly diagram, i.e. that at the start of the cycle active regions began to form at high latitudes on the Sun. This emerging active region represents a very interesting case for a comprehensive study.
Some observational data of this region were collected and analyzed by Brosius and Holman (2010), Schlichenmaier, Rezaei, and Bello Gonzalez (2012), Valori et al. (2012), Schad et al. (2011), Sylwester et al. (2011), Engell et al. (2011). Schlichenmaier, Rezaei, and Bello Gonzalez (2012) have investigated in detail the process of formation of a well-developed penumbra at the large leading spot and have obtained the line-of-sight (LOS) velocity maps in four instances of 4 July 2009 using observations from German VTT and SOHO/MDI. Schad et al. (2011) have observed strong downflows with supersonic velocities above the central part of the active region and upflows near the leading spot on 7 July 2009. Valori et al. (2012) have studied the flux emergence process between 29 June and 7 July 2009 by means of multi-wavelength observations and nonlinear force-free extrapolation. Using high spatial resolution observations they reviewed small-scale flux emergence in the context of the global evolution of the active region.
It is known that plasma motions play a significant role in the processes of formation and development of active regions. The conditions of new magnetic flux emergence determine the types of the subsequent magnetic reconnections and the eruptive instability in the active region. Numerous observations of young active regions have been discussed in the literature. Their dynamical properties have been studied by Howard (1971), Lites, Skumanich, and Martinez Pillet (1998), Strous and Zwaan (1999), Kubo, Shimizu, and Lites (2003), Kozu et al. (2006), Cheung, Schüssler, and Moreno-Insertis (2006), Grigor’ev, Ermakova, and Khlystova (2007, 2009), and others. Aznar Cuadrado, Solanki, and Lagg (2005), Lagg et al. (2007), and Schad et al. (2011) studied by means of spectropolarimetry in He I 1083 nm line, chromospheric gas flows in active regions and concluded that further multi-line studies of chromospheric flows are necessary. To form a more complete picture of the physical processes, it is also important to study the chromospheric and photospheric motions simultaneously.
In a number of previous works, a close relationship is found between magnetic flux emergence and activity in the chromosphere and corona. Kurokawa and Kawai (1993), Yokoyama and Shibata (1996), Schmieder et al. (2004), Li et al. (2007), and others emphasized the role of the magnetic reconnection between emerging and pre-existing magnetic fields in transient phenomena, such as surges, flares, microflares, jets, and Ellerman bombs. Emerging flux can cause enhanced emission in the Ca II H line, as well as heating and brightening of coronal loops.
In this paper we study the chromospheric and photospheric velocity field in the young active region NOAA 11024 using spectral data from the French-Italian telescope THEMIS at the Teide Observatory of the Instituto de Astrofisica de Canarias, obtained on 4 July 2009 from 9:30 UT to 9:50 UT. We also consider data from space telescopes SOHO, STEREO and GOES for a better understanding of the physical processes leading to the dynamical features described in this work.
2 Active Region NOAA 11024
S-general
The young active region NOAA 11024 appeared on 29 June 2009 as a rapidly growing facular region. It was the only active region on the solar disk at that time. At the day of our observations at THEMIS, on 4 July 2009, this active region was located near the central meridian. It consisted of several spots and pores of opposite polarities. Our observations took place during the phase of fast rise of the activity in this active region (Valori et al., 2012; Engell et al., 2011). A high surge activity was observed in it, which is usually the first signature of magnetic flux emergence (Kurokawa and Kawai, 1993).
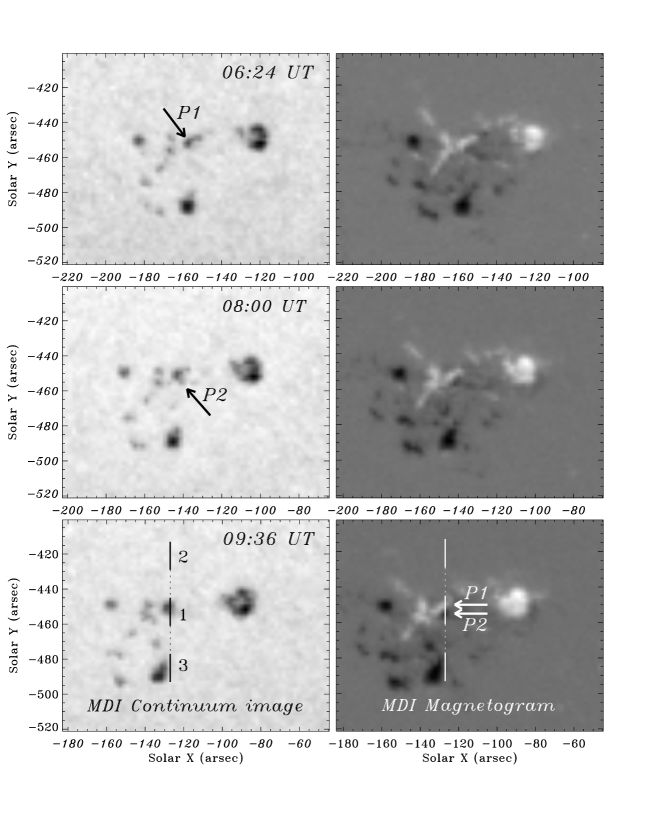
We first review data and results from a number of multi-wavelength observations of this active region. For a better understanding of the evolution of the active region before and during our spectroscopic observations at THEMIS, we have used magnetograms and continuum images (see Figure 1) obtained with the Michelson Doppler Imager (MDI; Scherrer et al., 1995) onboard the SOHO spacecraft (Fleck, Domingo, and Poland, 1995). The spot group was bipolar, with small opposite polarity patches indicating the emergence of new magnetic flux.
Valori et al. (2012) revealed the presence of serpentine magnetic fields in this active region, where the serpentine fields lines interacted with a pre-existing large-scale flux system. Engell et al. (2011) observed 137 flare-like/transient events using SphinX, a full-disk-integrated spectrometer. Many small X-ray bursts were recorded by GOES on 4 July 2009.
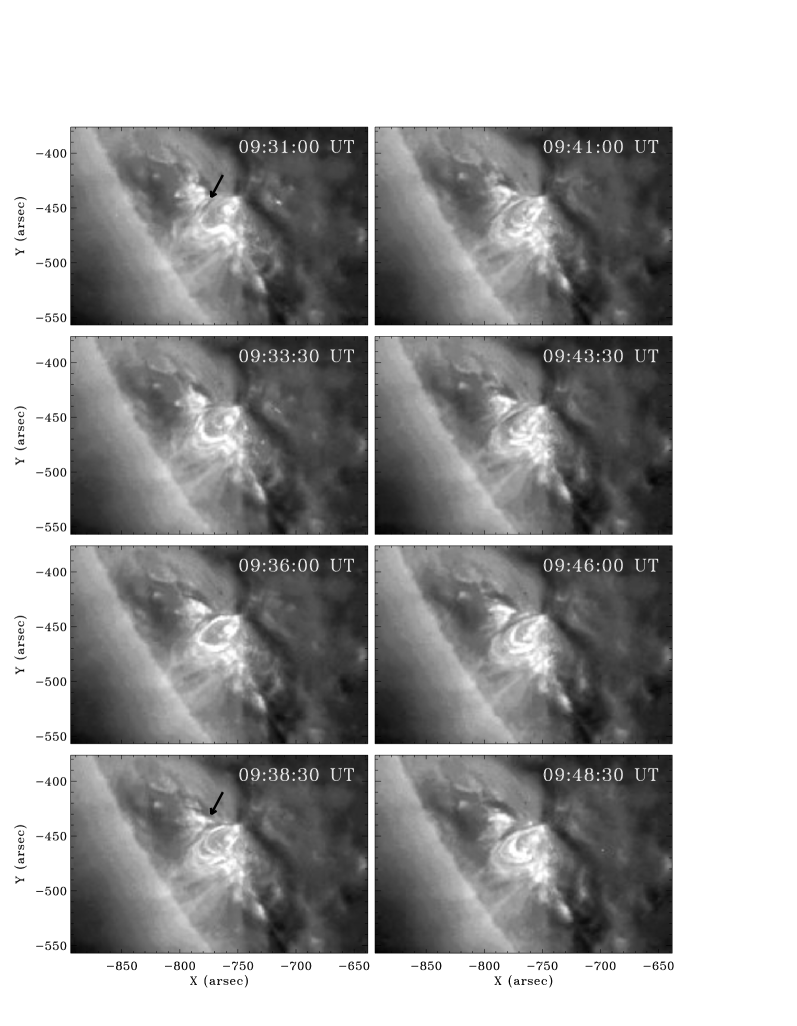
The time series of EUV images from STEREO and SOHO at 17.1 nm and 19.5 nm have allowed us to analyze the spatial and temporal evolution of the upper atmosphere of the active region. The data discussed here were obtained using EUVI, part of the Sun Earth Connection Coronal and Heliospheric Investigation (SECCHI; Howard et al., 2008) suite of instruments onboard the STEREO-A spacecraft. All the images showed bright loop systems in the corona and the transition region, which rapidly changed in time. Figure 2 presents the set of the EUV images obtained by STEREO-A at 17.1 nm for different times corresponding to our spectral observations period. One can see the expansion of the heated plasma along the loops at 09:31 – 09:36 UT and 09:43:30 – 09:48:30 UT. Such motions of the heated plasma in the coronal loops, most likely triggered by magnetic reconnection, were observed by many authors. Švestka and Howard (1979) found that the brightening in young coronal loops may be associated with the emergence of new magnetic flux near their footpoints. Qiu et al. (1999) reported on the expansion of the brightening along C IV 155 nm loops in the transition region, accompanied by motions along the H loops in an active region observed on 27 September 1998. The footpoints of the loop system were located at regions of mixed magnetic polarity. The authors suggested that the expansion was caused by slow, small-scale magnetic reconnection at the foot regions of the loop system.
3 Observations and data
S-general
Spectropolarimetric observations of the active region were carried out with the French-Italian telescope THEMIS at the Teide Observatory of the Instituto de Astrofisica de Canarias, on 4 July 2009. Here we are mostly interested in velocities and only use Stokes profiles for our analysis.
Figure 1 (bottom panel) displays some MDI continuum images and magnetograms around the time interval of our spectropolarimetric THEMIS observations. Several small bipolar fragments were situated between the main polarities. The location of the spectrograph slit during the observations is given in Figure 1. The field of view of THEMIS in polarimetric configuration is divided into three parts, each of them about 16 arcsec long. The solid lines (parts 1, 2, 3) denote the areas in the field of view and the dotted lines denote the intervals between them. The part of the active region which we investigated is labeled ’1’, and its useful length (after reduction) was 14 arcsec (10 Mm).
The observed region included two pores and active and quiet plages. H spectra showed strong temporal changes in the active plage, associated with the chromospheric surge. There was no strong disturbance in the quiet plage region. The location of the two pores, P1 and P2, is indicated in Figure 1. In SOHO/MDI continuum images, at 06:24 UT only the pore P1 (positive polarity) was observed. By 08:00 UT, P2 pore became visible, with the opposite (negative) polarity. New emerging magnetic flux was apparent, as revealed by the comparison of the MDI magnetograms obtained at 06:24 UT and 09:36 UT.
Several surges occurred in the studied active region during our observations (Figures 2 and 3).
The pixel sampling of our observations was 0.2 arcsec, while the actual spatial resolution, limited by the seeing effects, was below 1 arcsec (the seeing conditions were exceptionally good during the time of our observations). Fixed-slit time series were taken, with a total of 400 spectra obtained between 09:30 UT and 09:50 UT. The time interval between individual spectra was about 3 seconds, the exposure time was 0.12 seconds.
The complete data set included five spectral regions observed simultaneously. In this work we use two of them, containing the chromospheric line H (central part) and the photospheric lines Fe I 630.15 nm, 630.25 nm, 630.35 nm, and the Ti I 630.38 nm. We have selected about one hundred spectra of the best quality for this study. The time interval between the selected consecutive spectra ranged from three to fifteen seconds.
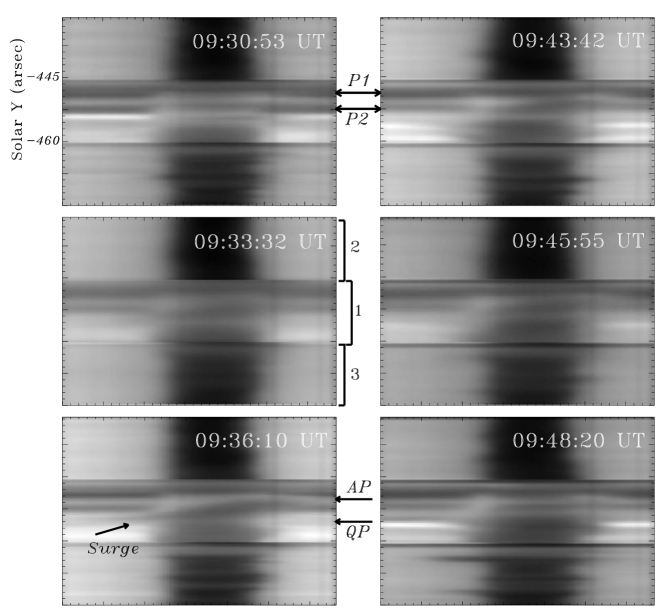
Figure 3 shows H spectra obtained at approximately the same time as the EUV images in Figure 2. The studied region is marked by “1” and the location of other features is indicated. It is seen that the spectra rapidly changed with time. Bright emission regions, inclined bright and dark streaks indicate high chromospheric activity. It should be noted that inclined streaks are thought to indicate vortex-type chromospheric mass motions associated with surges (Zirin, 1966).
4 Results
S-Results
From the observed Stokes profiles we have calculated values of the line-of-sight velocities (on an absolute scale) in the photosphere and chromosphere. The chromospheric velocities were derived from the H line core Doppler shifts using for calibration the nearby telluric lines. The velocities in the photosphere were calculated from the core shifts of the Fraunhofer lines of Fe I and Ti I relative to the telluric line present in this spectral window. Line-of-sight velocities were measured by shifts of the line cores in the spectra relative to their positions in the laboratory spectrum. All necessary corrections were taken into account. The accuracy of the chromospheric velocity is estimated to be about 0.3 km s-1, and that of the photospheric velocity about 0.1 km s-1.
Sometimes a double component is clearly detected in the H profiles, with two clear minima. In these cases, the position of both minima has been measured.
4.1 Chromospheric line-of-sight velocities in the active region
S-Chromo-Velocities
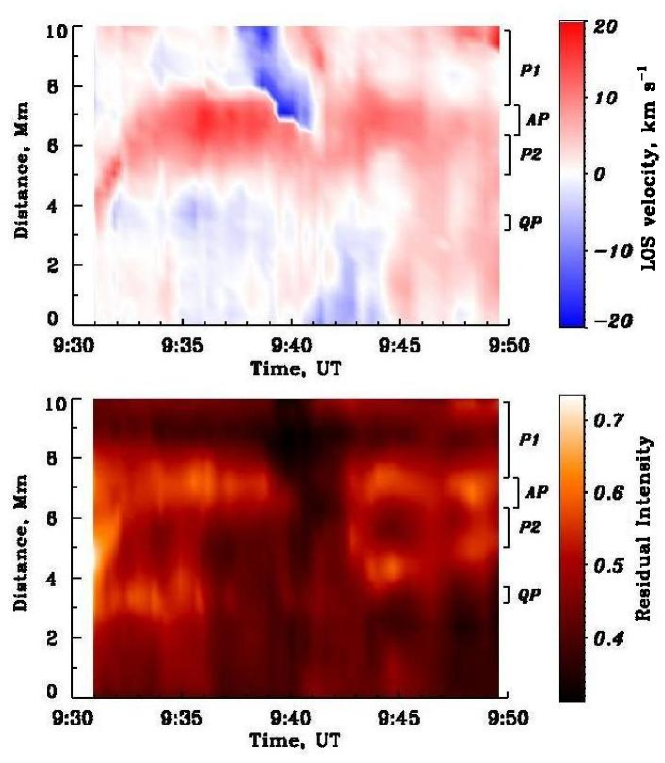
Figure 4 shows the temporal evolution of line-of-sight chromospheric velocities and H line core residual intensities in the active region along the spectrograph slit.

One can see that the chromospheric velocity field of the active region was rather dynamic. During the first 15 min of the observations both up- and downflows were detected. The last five minutes, though, downflows were present over the whole region. There are also differences in the velocity patterns between the different active structures: pores, plage regions and surges. Above the pore P1, the velocities and their changes during observations were generally small (-1 – 2 km s-1) while at the edges of the pore downflows were found up to 20 km s-1. Strong upflows between 09:37 and 09:41 UT are due to a surge, which will be discussed below.
Above the pore P2, downflows were observed in the chromosphere. The velocities were in the range of 1 km s-1 on one side of the pore, reaching 15 km s-1 on the other side.
Plage regions also show strong velocity variations. In the active plage during the first minute of the observations there was upflow with the velocity, varying in time from -4 km s-1 to about 0 km s-1. Then the direction of motion changed and downflows continued till the end of the observations.
Interestingly, a bright narrow band in both wings of the H line was observed near the second pore (Figure 3, top left panel) at the beginning of the observations. This region is seen in Figure 4 (bottom panel) as a small bright region (at the location 4–5 Mm and time 09:31–09:32 UT) with increasing downward velocity (top panel). In a minute this bright region moved in the direction toward the active plage, and its brightness decreased (Figure 4, bottom panel). This was accompanied by an increase in the downward velocity from 6 km s-1 to 14 km s-1 (Figure 4, top panel).
In the quiet plage both up- and downflows, with a small velocities around 0 km s-1, were observed up to 09:45 UT, followed by downflows with larger velocity afterwards.
Chromospheric surges occurred in the studied active region during our observations. Sharp variations in the chromospheric velocity direction, from downflow to upflow and vice versa, were revealed during these surges at about 09:34 – 09:36 UT (first surge) and at 09:37 – 09:41 UT (second surge) at slit location 3.0 – 4.2 Mm and 5.5 – 10.0 Mm, respectively. In Figure 4 we can see strong upflows in these places. The first surge was projected over the region between the pore P2 and the quiet plage. The second surge was projected over the region of the pore P1 and active plage (upflow with velocities up to -20 km s-1 in Figure 4).
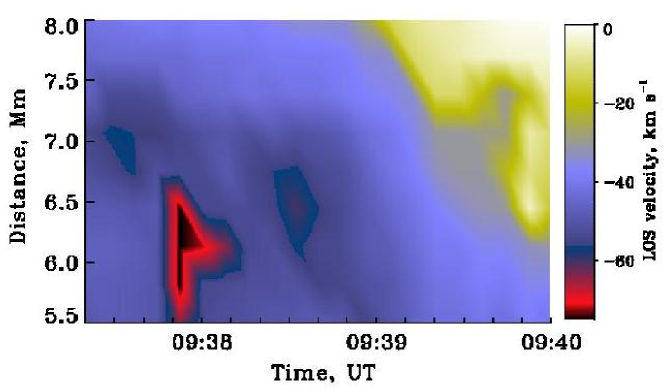
Figure 5 (top panel) shows the H line profiles detected at different time moments before and during the second surge. For comparison, the quiet-Sun H line profile from the atlas by Delbouille, Roland, and Neven (1973) is given. It was corrected for the limb darkening (cos = 0.87). The obtained line profiles had two components – main and blue-shifted. The blue-shifted component suggests the appearance of a surge. We used the shifts of this component to determine the surge velocity. It should be noted that the intensity of this component sometimes exceeded that of the main component. The bottom panel of Figure 5 displays the temporal variation of the velocity in the second surge region.
All Doppler velocities were determined using the wavelength shift of the local minimum of the H line profiles. For Figure 4 it was the shift of the minimum of the main component, for Figure 5 (bottom) – the shift of the minimum of the blue-shifted component. At times close to the ejection maximum (in Figure 5 at 09:37:42 UT) this component had two minima, which means that the surge was inhomogeneous, and consisted of several fragments. The velocity peak ( -73 km s-1) was reached at 09:37:50 UT.
4.2 Photospheric line-of-sight velocities in the active region
S-Photo-Velocities
Photospheric velocities were calculated using strong lines Fe I 630.15 nm, 630.25 nm and weak lines Fe I 630.35 nm, Ti I 630.38 nm. According to the atlas by Delbouille, Roland, and Neven (1973), the central residual intensities of these line profiles for the solar disk center in a quiet region are 0.278, 0.344, 0.946, 0.916, respectively.
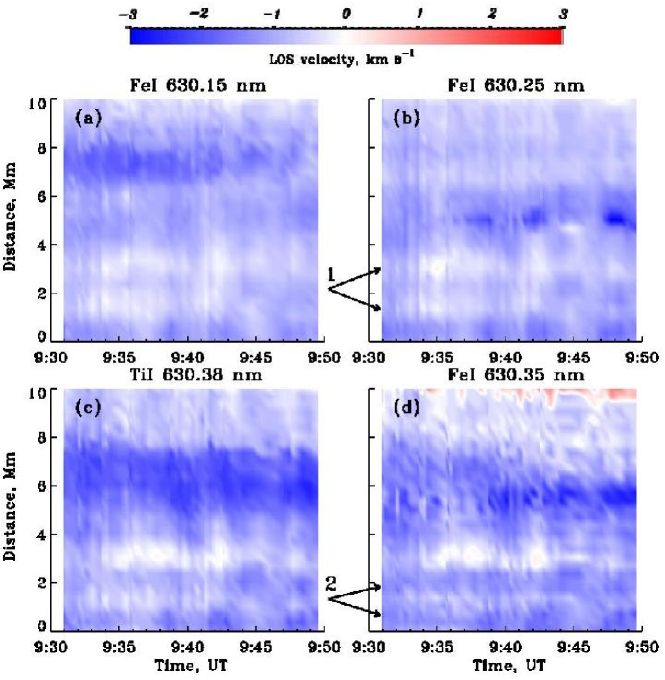
The plasma motion in the photospheric layers was different from that in the chromosphere. Figure 6 shows the temporal variation of the LOS velocity in the active region photosphere. Panels a, b, c, and d correspond to the lines Fe I 630.15 nm, Fe I 630.25 nm, Ti I 630.38 nm, and Fe I 630.35 nm, formed in different layers of the photosphere. From general considerations one may expect that, the weaker lines Ti I 630.38 nm and Fe I 630.35 nm are formed deeper and the stronger lines are formed higher, same as in the quiet photosphere for the studied set of lines.
Mostly upflows were observed in all layers of the photosphere in the region under consideration.
It is interesting to note the region with larger upflowing velocities, whose location and width changed depending on the height in the photosphere (Figure 6). The values of upflow velocities changed ranged between -0.6 km s-1 and -2.2 km s-1 for strong lines and between -1.3 and -2.7 km s-1 for weak lines over time in this region.
The velocity variations in the central part of the first pore were from -1 km s-1 to -0.4 km s-1. A large difference was observed in the velocities at the edges of the pore. At one of the boundaries, upflows of about -2 km s-1 were detected over the entire height of the photosphere. At the other boundary, the upflow velocity was not large, only about -0.1 km s-1. In the formation region of the Fe I 630.35 nm line the flows had the opposite direction, reaching 1.4 km s-1. Schlichenmaier, Rezaei, and Bello Gonzalez (2012) obtained a similar distribution of the velocities for the leading spot of the same active region during the formation of its penumbra.
The LOS velocities in the second pore derived by the Fe I 630.15 nm line (Figure 6, a) changed in time from -1 km s-1 to -2 km s-1. The velocities for the Fe I 630.25 nm line (Figure 6, b) were increasing from -0.9 to -3 km s-1. In the formation region of the Ti I 630.38 nm and Fe I 630.35 nm lines (lower layers of the photosphere) the velocities were greater than in the formation region of the Fe I 630.15 nm and Fe I 630.25 nm lines (upper layers) during our observations (Figure 6, c, and d).
Granules and intergranular lanes can be identified in the lower part of the velocity maps, where there were no active features (pores and plages). In Figure 6 granules and intergranular lanes are indicated by arrows (1 – intergranular lanes and 2 – granules). Its LOS velocity changed over time. Upflows were found predominantly both in granules and intergranular lanes, with velocities -2 km s-1 – -0.6 km s-1 in granules and -0.9 – 0.3 km s-1 in the intergranular lanes.
As a test of our result, and check the validity of a net upward motion in the intergranular lanes of our active region, we have considered the quiet sun region included in part “2” of the slit (see Figure 1). In it, no apparent activity was present. In the quiet photosphere, a typical granular pattern was obtained with upward velocities of about -0.8 km s-1 in granules and downward velocities of about 1.5 km s-1 in intergranular lanes.
Thus, our results are compatible with a scenario where new magnetic flux is appearing in the active region, superimposing an upward velocity to the conventional overturning granular convection.
4.3 Comparison of chromospheric and photospheric line-of-sight velocities
S-Comparison

To examine the relationship between the physical processes in the chromosphere and photosphere we compared the velocities obtained in these two layers in different features of the active region (Figures 7 and 8).
Figure 7 shows significant differences between the chromospheric and photospheric velocities in the pore regions. Preferentially downflows were detected in the chromosphere above the pore P1. In the photosphere upward velocity variations with a smaller amplitude and mean value of -0.7 km s-1 were found. The largest changes in the chromospheric velocities above the pore P1 were associated with a surge overlaying it. The velocities obtained from the profile main components (see section 4.1, Figure 4, top panel) reached up to -8 km s-1 at 09:38 UT and after it up to 12 km s-1. It is seen that the chromospheric velocities above the pore P2 were larger than above the first pore. The mean value of the velocity was 7 km s-1. In the photosphere of the second pore, upflows were observed, with amplitude increasing over time after the first surge up to about -1.5 – -2.5 km s-1. As in the chromosphere, the photospheric velocities were larger, compared to the first pore.

In the active plage region, strong variations in the chromospheric velocity were not accompanied by those at the photospheric levels (Figure 8). Before and after the surge (09:37 UT – 09:41 UT) strong downflows up to 18 km s-1 were observed in the chromosphere. Upflows from -2 km s-1 to -0.5 km s-1 at different photospheric levels occurred.
In the quiet plage region, chromospheric downflows occurred at the beginning of the observations. Then the motion direction rapidly changed to upflows. After the first surge (peak at 09:35:40 UT) the velocity direction changed again. The velocity increased with time up to 6 km s-1. In the photosphere the velocity variations corresponded to typical photospheric oscillations. Thus, the largest variations in the chromospheric LOS velocities were observed in the surge regions. In the region of the new magnetic flux emergence, in the surroundings of the pore P2, velocities were largest both in the chromosphere and photosphere.
5 Discussion and summary
S-Discussion and summary
On the base of spectral observations with high temporal and spatial resolution, we investigated the temporal variations of the velocity field simultaneously in the chromosphere and at different levels of the photosphere of the emerging active region NOAA 11024. On the day of our observations, there was a sharp increase of its activity, evidenced by the rapidly changes in the EUV and MDI images and H spectra, as well as changes of the X-ray flux. Many small X-ray bursts and chromospheric surges occurred in the active region.
Line-of-sight velocities were determined in different features of this young active region. The velocities were obtained in the chromospheric H line and four photospheric lines of Fe I 630.15 nm, 630.25 nm, 630.35 nm, and Ti I 630.38 nm.
Our observations show rather strong temporal changes in the chromospheric and photospheric velocities along a slice of the active region of 10 Mm length, in an environment of emergence of new magnetic flux. Chromospheric downflows up to about 18 km s-1 were observed in the vicinity of the magnetic flux emergence region, in the active plage and P2 pore regions, while LOS velocities in the quiet plage did not exceed km s-1.
Lagg et al. (2007) have created the maps of the chromospheric and photospheric LOS velocities in the active region NOAA 9451 and found strong chromospheric downflows in the vicinity of a young growing pore. The area of the downflow region was increasing. Our observations show the expansion of the downflows region as well. Lagg et al. (2007) have analyzed in detail the possible models of these downflows and interpreted them being due to drainage of material along the legs of emerging magnetic loops. As the pressure balance between the rising flux tube and the surrounding atmosphere is changing, the hydrostatic support of the the material in the upper part of the flux tube is lost, and the material is draining back towards the deep layers. There are other mechanisms explaining downward motions in the loops, as, e.g. siphon flow models, model of the convective collapse, etc. (e.g., Parker, 1978; Cargill and Priest, 1980; Grossmann-Doerth, Schüssler, and Steiner, 1998; Takeuchi, 1999; Uitenbroek, Balasubramaniam, and Tritschler, 2006).
In this work, we also found upflows at all studied levels of the photosphere. Ascending plasma seems to be present in the studied slice of the active region. The largest upward velocities appeared at the site of magnetic flux emergence, in the vicinity of a polarity inversion line of the magnetic field.
Our results are compatible with earlier studies. Photospheric upflows of -0.5 – -2 km s-1 are found in young, emerging active regions (see, e.g., Howard, 1971; Lites, Skumanich, and Martinez Pillet, 1998; Strous and Zwaan, 1999; Kubo, Shimizu, and Lites, 2003; Cheung, Schüssler, and Moreno-Insertis, 2006; Kozu et al., 2006; Grigor’ev, Ermakova, and Khlystova, 2007). Grigor’ev, Ermakova, and Khlystova (2009) found that maximum velocities occurred in the polarity inversion line of bipolar magnetic pairs. Numerical simulations show that upflows must appear in regions of emerging magnetic flux (e.g., Shibata et al., 1989; Fan, 2001; Magara and Longcope, 2003; Archontis et al., 2004). Our investigation confirms all these findings.
There are numerous simulations of magnetic flux emergence through the photosphere into the corona. Example may be extended from the initial 2-dimensional MHD models (e.g., Shibata et al., 1989; Nozawa et al., 1992; Longcope, Fisher, and Arendt, 1996; Emonet and Moreno-Insertis, 1998) to a more sophisticated 3-dimensional ones (e.g., Matsumoto et al., 1993; Fan, 2001; Magara and Longcope, 2003; Abbett and Fisher, 2003; Archontis et al., 2004; Archontis, 2010). These models explain many of the observed features of emerging active regions and eruptive events. Our observational data are in a broad qualitative agreement with the above mentioned theoretical results.
Despite the recent progress, our complete understanding of how magnetic field emerges from the convection zone into the corona is still missing. Magnetic flux emergence from the convection zone and formation of active regions is a complex physical process affecting all layers of the solar atmosphere. In order to reach a deeper understanding, it is very important to analyze multi-layer, multi-wavelength spatially and temporally resolved observational data, as those presented in this paper. Further progress is expected with the coming era of the large-aperture ground-based solar telescopes, as well as space missions.
Acknowledgements
We thank the referee for helpful suggestions for improvements of this paper, the Editor Lidia van Driel-Gesztelyi and the Guest Editor for constructive comments and corrections. We would like to thank R. I. Kostyk for the codes for the treatment of the observations. We are grateful to the observer teams of the GOES, STEREO and SOHO/MDI who have provide free access to their results. We thank the support of the THEMIS team during the observations.
References
- Abbett & Fisher (2003) Abbett, W.P., Fisher, G.H.: 2003, Astrophys. J. 582, 475.
- Archontis (2010) Archontis, V.: 2010, In K. Tsinganos, D. Hatzidimitriou, and T. Matsakos (Eds.): Adv. Hellenic Astron. IYA09, ASP CS-424, 3.
- Archontis et al (2004) Archontis, V., Moreno-Insertis, F., Galsgaard, K., Hood, A., O’Shea, E.: 2004, Astron. Astrophys. 426, 1047.
- Aznar Cuadrado et al (2005) Aznar Cuadrado, R., Solanki, S.K., Lagg, A.: 2005, in: Chromosphere and Coronal Magnetic Fields, edited by D.E. Innes, A. Lagg, S.K. Solanki, and D. Danesy, (ESA Publication Division), ESA SP-596, 49.
- Brosius et al (2010) Brosius, J.W., Holman, G.D.: 2010 Astrophys. J. 720, 1472.
- Cargill & Priest (1980) Cargill, P.J., Priest, E.R.: 1980, Solar Phys. 65, 251.
- Cheung et al (2006) Cheung, M.C.M., Schüssler, M., Moreno-Insertis, F.: 2006, ASPC 354, 97.
- Delbouille et al (1973) Delbouille, L., Roland, G., Neven L.: 1973 Photometric Atlas of the Solar Spectrum from 3000 to 10000 Liege: Institut d’Astrophysique.
- Emonet & Moreno-Insertis (1998) Emonet, T., Moreno-Insertis, F. 1998, Astrophys. J. 492, 804.
- Engell et al (2011) Engell, A.J., Siarkowski, M., Gryciuk, M., Sylwester, Ja., Sylwester, B., Golub, L., et al.: 2011, Astrophys. J. 726, 12.
- Fan (2001) Fan, Y.: 2001, Astrophys. J. 554, L111.
- Fleck et al (1995) Fleck, B., Domingo, V., Poland, A.I.: 1995, Solar Phys. 162, 1.
- Grigor’ev et al (2007) Grigor’ev, V.M., Ermakova, L.V., Khlystova, A.I.: 2007, Astronomy Letters 33, 766.
- Grigor’ev et al (2009) Grigor’ev, V.M., Ermakova, L.V., Khlystova, A.I.: 2009, Astronomy Reports 53, 869.
- Grossmann-Doerth et al (1998) Grossmann-Doerth, U., Schüssler, M., Steiner, O.: 1998, Astron. Astrophys. 337, 928.
- Howard (1971) Howard, R.A.: 1971, Solar Phys. 16, 21.
- Howard et al (2008) Howard, R.A., Moses, J.D., Vourlidas, A., Newmark, J.S., Socker, D.G., Plunkett, S.P., et al.: 2008, Space Sci. Rev. 136, 67.
- Kozu et al (2006) Kozu, H., Kitai, R., Brooks, D.H., Kurokawa, H., Yoshimura, K., Berger, T.: 2006, Publ. Astron. Soc. Japan 58, 407.
- Kubo et al (2003) Kubo M., Shimizu, T., Lites, B.W.: 2003, Astrophys. J. 595, 465.
- Kurokawa & Kawai (1993) Kurokawa, H., Kawai, G.: 1993, in: The magnetic and velocity fields of solar active regions. ASP Conference Series, edited by H. Zirin, G. Ai, and Wang H. 46, 507.
- Lagg et al (2007) Lagg, A., Woch, J., Solanki, S.K., Krupp, N.: 2007, Astron. Astrophys. 462, 1147.
- Li et al (2007) Li, H., Sakurai, T., Ichimito, K., Suematsu, Y., Tsuneta, S., Katsukawa, Yu., et al.: 2007, Publ. Astron. Soc. Japan 59, 643.
- Lites et al (1998) Lites, B.W., Skumanich, A., Martinez Pillet, V.: 1998, Astron. Astrophys. 333, 1053.
- Longcope et al (1996) Longcope, D.W., Fisher, G.H., Arendt, S.: 1996, Astrophys. J. 464, 999.
- Magara (2003) Magara, T., Longcope, D.W.: 2003, Astrophys. J. 586, 630.
- Matsumoto et al (1993) Matsumoto, R., Tajima, T., Shibata, K., Kaisig, M. 1993, Astrophys. J. 414, 357.
- Nozawa et al (1992) Nozawa, S., Shibata, K., Matsumoto, R., Sterling, A.C., Tajima, T., Uchida, Y., et al.: 1992, Astrophys. J. Supl. Ser., 78, 267.
- Parker (1978) Parker, E.N.: 1978, Astrophys. J. 221, 368.
- Qiu et al (1999) Qiu, J., Wang, H., Chae, J., Goode, Ph.R.: 1999, Solar Phys. 190, 153.
- Schad et al (2011) Schad, T.A., Jaeggli, S.A., Lin, H., Penn, M.J.: 2011, In J.R. Kuhn, D.M. Harrington, H. Lin, S.V. Berdyugina, J. Trujillo-Bueno, S.L. Keil, and T. Rimmele (Eds.): Solar Polarization 6. San Francisco: Astron. Soc. Pacific. ASP CS-437, 483.
- Scherrer et al (1995) Scherrer, P.H., Bogart, R.S., Bush, R.I., Hoeksema, J.T., Kosovichev, A.G., Schou, J., et al.: 1995, Solar Phys. 162, 129.
- Schlichenmaier et al (2012) Schlichenmaier, R., Rezaei, R., Bello Gonzalez, N.: 2012, In L.R. Bellot Rubio, F. Reale, and M.Carlsson (Eds.): Hinode-4. San Francisco: Astron. Soc. Pacific. ASP CS-455, 61.
- Schmieder et al (2004) Schmieder, B., Rust, D.M., Georgoulis, M.K., Demoulin, P., Bernasconi, P.N.: 2004, Astrophys. J. 601, 530.
- Shibata (1989) Shibata, K., Tajima, T., Steinolfson, R.S., Matsumoto, R.: 1989, Astrophys. J. 345, 584.
- Strous & Zwaan (1999) Strous, L.H., Zwaan, C.: 1999, Astrophys. J. 527, 435.
- Sylwester et al (2011) Sylwester, B., Sylwester, J., Siarkowski, M., Engell, A.J., Kuzin, S.V.: 2011, CEAB 35, 171.
- Svestka & Howard (1979) Švestka, Z., Howard, R.: 1979, Solar Phys. 63, 297.
- Takeuchi (1999) Takeuchi, A.: 1999, Astrophys. J. 522, 518.
- Uitenbroek et al (2006) Uitenbroek, H., Balasubramaniam, K.S., Tritschler, A.: 2006, Astrophys. J. 645, 776.
- Valori et al (2011) Valori, G., Green, L.M., Démoulin, P., Vargas Dominguez, S., van Driel-Gesztelyi, L., Wallace, A., et al.: 2012, Solar Phys. 278, 73.
- Yokoyama & Shibata (1996) Yokoyama, T., Shibata, K.: 1996, Publ. Astron. Soc. Japan 48, 353.
- Zirin (1966) Zirin, H.: 1966, The Solar Atmosphere, Blaisdell Publ. Co., Massachusetts, U.S.A.