Strong pressure dependence of the magnetic penetration depth in single crystals of the heavy fermion superconductor CeCoIn5 studied by muon spin rotation
Abstract
In the tetragonal heavy fermion system CeCoIn5 the unconventional superconducting state is probed by means of muon spin rotation. The pressure dependence ( GPa) of the basal-plane magnetic penetration depth (), the penetration depth anisotropy () and the temperature dependence of () were studied in single crystals. A strong decrease of with pressure was observed, while and are pressure independent. A linear relationship between and was also found. The large decrease of with pressure is the signature of an increase of the number of superconducting quasiparticles by a factor of about 2.
pacs:
74.70.Tx,71.27.+a,76.75.+i,74.62.FjUnconventional superconductors are characterized by their proximity to different instabilities. In heavy fermion systems superconductivity is often found in the region of the phase diagram where a weak magnetic phase disappears Mathur et al. (1998). However, in some systems Jaccard et al. (1999) superconductivity is also detected in proximity of a valence phase transition.
CeCoIn5 is a prototypal heavy fermion superconductor Petrovic et al. (2001) at the focus of numerous studies owing to the proximity of quantum criticality. This proximity is reflected by the pronounced non-Fermi liquid features Sidorov et al. (2002); *Nakajima2007 and the highest superconducting (SC) transition temperature K Petrovic et al. (2001) among the Ce based heavy fermions. In addition, this tetragonal system is characterized by a quasi two-dimensional Fermi surface Settai et al. (2001); Maehira et al. (2003) and a two-gap Seyfarth et al. (2008) unconventional SC state with d-wave symmetry Izawa et al. (2001); *Aoki2004.
In order to clarify the relation between the SC phase and quantum criticality, the evolution of basic SC parameters with respect to a tuning parameter is required. In this letter the pressure (p) and temperature (T) dependence of a fundamental SC quantity — the magnetic penetration depth () — was studied. Here corresponds to a screening current flowing along the main crystallographic directions: perpendicular, respectively parallel to the -axis. is obtained through the precise magnetic field distribution in the SC vortex state probed by transverse-field (TF) muon-spin rotation (SR).
CeCoIn5 is in the clean limit with a ratio of coherence length to mean free path ( nm) Settai et al. (2001); Seyfarth et al. (2008). In this limit the penetration depth can be written in the London model as:
| (1) |
Here is the vacuum permeability, the electron charge, the number density (number of superconducting quasiparticles), and the effective quasiparticle mass.
The SR experiments were performed at the Swiss Muon Source (SS), Paul Scherrer Institute (PSI), Switzerland, using the GPD (under ) and LTF (ambient , low ) spectrometers. In a TF-SR experiment spin polarized positive muons are implanted into a sample in an external magnetic field (field cooled from above ) applied perpendicular to the initial muon-spin polarization. In the presence of a magnetic field at the muon site the muon spin precesses at its Larmor frequency ( rad s-1T-1 is the gyromagnetic ratio of the muon) before decaying with a life time of s into a positron and two neutrinos. Due to parity violation the decay positron is preferentially emitted along the muon spin direction. Forward and backward positron detectors with respect to the initial muon polarization are used to monitor the SR asymmetry spectrum .
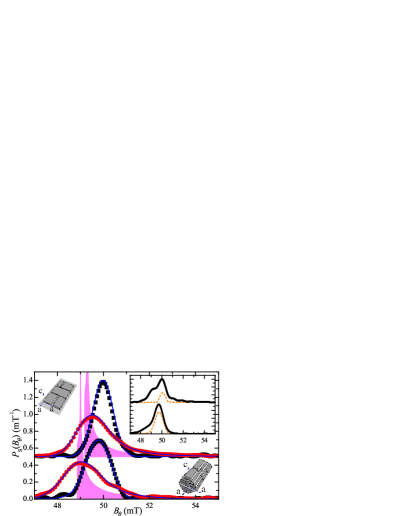
Single crystals of CeCoIn5 were grown by indium flux method Canfield and Fisk (1992) (rare earth from MPC ), centrifuged and etched in HCl solution to remove the indium excess. Thin plate-like single crystals were obtained with their large faces corresponding to the (001) basal plane. Using this particular geometry, two samples were prepared, consisting of 10, respectively 200 crystals glued together with G.E. varnish, as sketched in Fig. 2. The mosaic sample (-axis normal to the plane) was studied with the LTF spectrometer. The cylindrical-like sample (-axis is the main axis) was mounted in a piston cylinder pressure cell of CuBe alloy with Daphne oil as a pressure transmission medium Maisuradze et al. (2011) and measured with the GPD spectrometer. The actual pressure in the cell was determined by the of a small piece of indium.
For different pressures an angular scan consisting of 5-8 TF-SR spectra was taken at mK with an applied field mT forming an angle with the sample’s crystallographic -axis. For 0 GPa, 0.2 GPa, and 0.6 GPa a temperature scan was also recorded for () and (). The field was chosen to be higher than the critical field of bulk indium ( mT) to avoid artifacts due to possible residual flux from the growth. For comparison the values of the Pauli limited critical fields for CeCoIn5 are: mT ( and ) Seyfarth et al. (2008), T () and 11.5 T () Settai et al. (2001). A field of mT is also small enough so that the Knight shift Higemoto et al. (2010) and Zeeman current Spehling et al. (2009); *Dalmas2011 effects can be neglected in the analysis of the spectra. In the normal state about and in the SC state positrons events were recorded for a SR time spectrum.
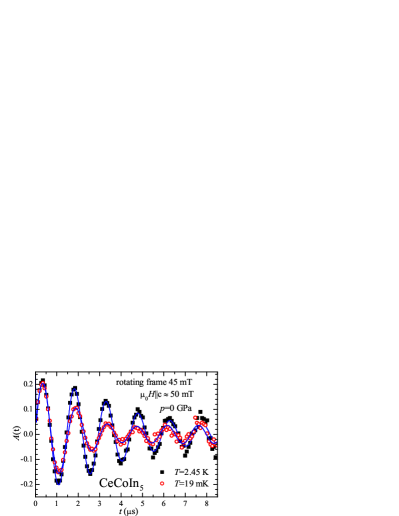
Typical TF-SR time spectra in the normal and SC state are displayed in Fig. 1. The temporal oscillations and damping of the SR asymmetry reflect directly the local magnetic field distribution at the muon stopping sites. The SR time spectrum consists of two contributions: a background signal () arising from the muons stopping in the silver sample holder for the LTF spectrometer or the pressure cell for the GPD spectrometer and a signal arising from the muons stopping in the sample () Maisuradze et al. (2011). These contributions are clearly seen in Fig. 1. At short times the sample contribution dominates: in the SC state the damping of the signal is enhanced due to the field broadening generated by the vortex lattice (VL), and the oscillating frequency is reduced due to diamagnetic screening. In contrary, for s in the normal state and s in the SC state, only the signal of the muons stopping in the silver background persists. The SR time spectra are well described with the following equation:
| (2) |
Here denotes the fraction of muons stopping in the sample, the initial asymmetry of the signal and [] is the sample [background] muon depolarization function. was determined to be for the LTF spectrometer and typically for the GPD spectrometer. Here varies each time the pressure cell is manipulated (change of or ) as the sample position relative to the muon beam is modified. In various configurations we recorded a SR spectrum after a small field increase of 4 mT at low temperatures. Due to pinning the shift of field in the sample is less, allowing to determine precisely the fraction of muons stopping in the sample. The background depolarization function is described by a Gaussian field distribution Maisuradze et al. (2011):
| (3) |
The average background magnetic field mT and the standard deviation of the Gaussian field distribution vary in the SC state since the diamagnetic sample induces a field inhomogeneity in its surrounding. The initial phase is constant.
The sample depolarization function may be written as:
| (4) |
The presence of a VL gives rise to a local magnetic field distribution along the direction of the applied field , reflected by the integral in Eq. (4). For an extreme type-II superconductor in the London limit is uniquely determined by an effective penetration depth Brandt (1988); *Maisuradze2009; Yaouanc and Dalmas de Réotier (2011). For the two principal magnetic field orientations one has: and . The first factor in Eq. (4) describes the muon depolarization due to additional contributions ()111 The presence of two different muon stopping sites with different Knight shifts produces a broadening proportional to the applied field: mT at 50 mT in the normal phase. This broadening which is reduced by a factor nearly 2 Higemoto et al. (2010) in the SC state is negligible at 50 mT compared to the other contributions, but it is not for sizably larger fields. : (i) the nuclear moments [ mT] and (ii) the disorder of the VL [ with mT Riseman et al. (1995)]. The local magnetic field distribution in the sample can be obtained from the cosine Fourier transformation (FT) of the experimentally measured , after subtraction of (Fig. 2).
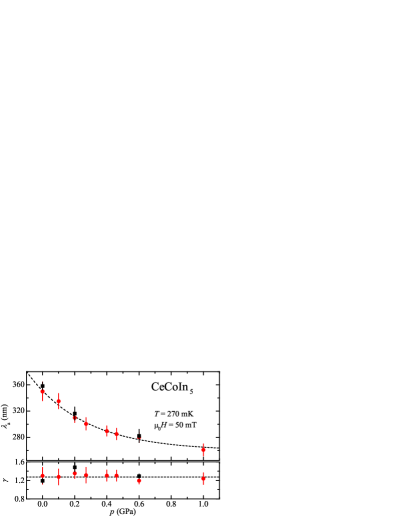
The angular dependent spectra were analyzed globally [Eqs. (2) to (4)] 222 Explicitly, this means that all the spectra taken at a given and for different or at a given and for different are fitted together with the constraints given in the text. Each point of the asymmetry spectrum is weighted statistically. with the constraint that with Bulaevskii et al. (1992). was used to determine the exact orientation of the sample in the pressure cell (position of ). The pressure dependence of the obtained parameters and are shown in Fig. 3 (red circles). The analysis of the temperature dependent spectra treated globally Note (2) is also presented (black squares). The two data sets give similar results, although different assumptions were made ( or dependence of some parameters fixed), demonstrating the reliability of the model.
The analysis yields at ambient pressure a value of nm. Since in the London model the contribution of the vortex core is neglected, this value is overestimated Yaouanc et al. (1997). Taking T for the orbital upper critical field Howald et al. (2011), this correction is only % for an applied field of mT and therefore was neglected. In comparison, the first SR experiment reported nm Higemoto et al. (2002). This experiment was performed in a large magnetic field T, and in the analysis an additional field broadening was neglected Note (1). This is very likely the main reason for the larger value of . Neutron diffraction experiments reported between 247(10) nm Eskildsen et al. (2003) and nm Bianchi et al. (2008). The first value, measured in a magnetic field of 2 T, was underestimated because Zeeman currents that produce an additional contribution to the field broadening Michal and Mineev (2010) were neglected. The second value was deduced from measurements at 0.5 T. Including the correction for the vortex cores Yaouanc et al. (1997), we obtain nm in agreement with the present value. Surface impedance techniques provided smaller nm Chia et al. (2003) and nm Özcan et al. (2003). These experiments were performed in an extremely low magnetic field (T) in the Meissner state.
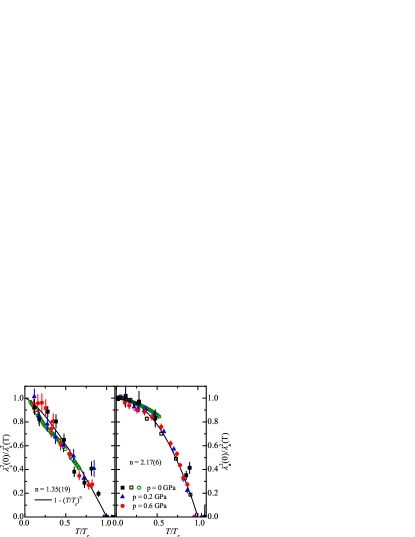
The temperature dependence of () is displayed in Fig. 4, together with a fit of the form . The pressure evolution of was determined independently by SQUID magnetometry (Fig. 5). The exponent was found to be for in agreement with Ref. Kogan et al. (2009), while for . Similar temperature dependences can be obtained using measured by tunnel-diode oscillator experiments Chia et al. (2003) taking nm and nm from this work (green empty circles in Fig. 4). Within precision both () are pressure independent, suggesting that the gap symmetry is unchanged, and the value of the gap to ratio is constant, in agreement with the variation of less than 10% obtained by NQR Yashima et al. (2004) in this pressure range.
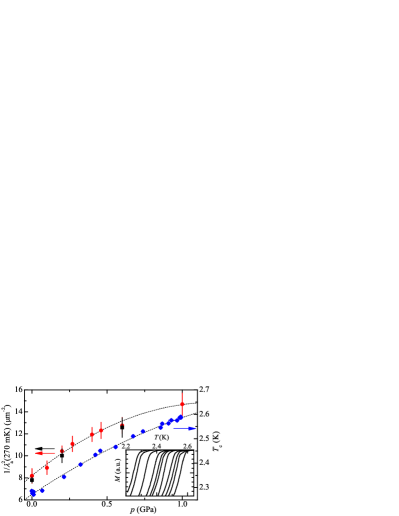
The pressure independent value of (Fig. 3) is in good agreement with the constant value deduced from the initial slope of the upper critical field under pressure Knebel et al. (2010); Howald et al. (2011). The same experiments indicate that the variation of with pressure is less than 10% between 0-1 GPa with a maximum around 0.5 GPa. Such a small variation cannot explain the pressure dependence of plotted in Fig. 5. Therefore, we conclude that, within the London model [Eq. (1)], increases with pressure. Using an average value Settai et al. (2001) one obtains from Eq. (1) a change of from to carriers per unit cell between 0 and 1 GPa.
In the following we discuss two possible scenarios for this strong increase of . The first one relies on the proposed multigap SC state of CeCoIn5 Seyfarth et al. (2008). The observed increase of with pressure would result from an increase of the small gap at 50 mT. Indeed, at ambient pressure for mT the smaller gap is already closed Seyfarth et al. (2008). To check whether the small gap could open under pressure, we probed the field dependence of the total magnetic field standard deviation in the sample . Here Yaouanc and Dalmas de Réotier (2011) is the quadratic sum of previously defined and the magnetic field standard deviation generated by the VL ( is the flux quantum). For comparison, for the two-gap superconductor PrOs4Sb12 Seyfarth et al. (2005) different slopes are observed between the low magnetic field regime with two opened SC gaps and the high magnetic field regime where only one SC gap is present MacLaughlin et al. (2002). In CeCoIn5, the fact that the magnetic field dependence of is the same at 0 GPa and 0.6 GPa (inset Fig. 6), strongly suggests that a single gap is probed in the full pressure range.
Another scenario is based on an increase of the Ce valence (orbital occupancy Booth et al. (2011) at ambient pressure). Such a scenario was proposed for the parent compound CeRhIn5 where a similar decrease of is observed between GPa and GPa Heffner et al. (2010). Note that valence fluctuations are often associated with SC in Ce based heavy fermions Watanabe and Miyake (2011).
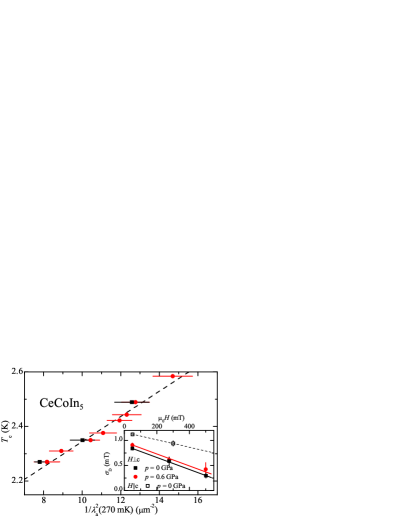
An interesting observation is the linear relation shown in Fig. 6. This relation has some analogy with the Uemura plot [] Uemura et al. (1991) found for underdopped cuprate superconductors and other electronically doped unconventional superconductors. However, substantial differences exist: (i) no proportionality () and (ii) is about 90 times smaller than . In addition, pressure affects much more in CeCoIn5 than in cuprates Maisuradze et al. (2011).
In conclusion, we show by TF-SR that in CeCoIn5 the magnetic penetration depth () decreases under pressure, while the anisotropy () and the temperature dependence of the penetration depth ratios and are almost unaffected. In the range of pressure investigated, a linear dependence between and was found. Within the London model, the decrease of under pressure corresponds to a doubling of the number density () between 0 and 1 GPa, possibly related with the presence of a quantum critical point.
Acknowledgements.
This work was performed at the Swiss Muon Source (SS), Paul Scherrer Institut (PSI), Switzerland. We acknowledge support by the Swiss National Science Foundation and the NCCR Program MaNEP.References
- Mathur et al. (1998) N. Mathur et al., Nature 394, 39 (1998).
- Jaccard et al. (1999) D. Jaccard et al., Physica B 259-261, 1 (1999).
- Petrovic et al. (2001) C. Petrovic et al., J. Phys.: Condens. Matter 13, L337 (2001).
- Sidorov et al. (2002) V. A. Sidorov et al., Phys. Rev. Lett. 89, 157004 (2002).
- Nakajima et al. (2007) Y. Nakajima et al., J. Phys. Soc. Jpn. 76, 024703 (2007).
- Settai et al. (2001) R. Settai et al., J. Phys.: Condens. Matter 13, L627 (2001).
- Maehira et al. (2003) T. Maehira et al., J. Phys. Soc. Jpn. 72, 854-864 (2003).
- Seyfarth et al. (2008) G. Seyfarth et al., Phys. Rev. Lett. 101, 046401 (2008).
- Izawa et al. (2001) K. Izawa et al., Phys. Rev. Lett. 87, 057002 (2001).
- Aoki et al. (2004) H. Aoki et al., J. Phys.: Condens. Matter 16, L13 (2004).
- Canfield and Fisk (1992) P. Canfield and Z. Fisk, Philos. Mag. B 65, 1117 (1992).
- (12) Rare earth purified at the Materials Preparation Center, Ames Laboratory, US DOE Basic Energy Sciences, Ames, IA, USA. See: www.mpc.ameslab.gov .
- Maisuradze et al. (2011) A. Maisuradze et al., Phys. Rev. B 84, 184523 (2011).
- Higemoto et al. (2010) W. Higemoto et al., J. Phys.: Conf. Ser. 225, 012013 (2010).
- Spehling et al. (2009) J. Spehling et al., Phys. Rev. Lett. 103, 237003 (2009).
- Dalmas de Réotier and Yaouanc (2011) P. Dalmas de Réotier and A. Yaouanc, Phys. Rev. B 84, 012503 (2011).
- Yaouanc and Dalmas de Réotier (2011) A. Yaouanc and P. Dalmas de Réotier, Muon Spin Rotation, Relaxation, and Resonance: Applications to Condensed Matter, International Series of Monographs on Physics (Oxford University Press, 2011).
- Brandt (1988) E. H. Brandt, J. Low Temp. Phys. 73, 355 (1988).
- Maisuradze et al. (2009) A. Maisuradze et al., J. Phys.: Condens. Matter 21, 075701 (2009).
- Note (1) The presence of two different muon stopping sites with different Knight shifts produces a broadening proportional to the applied field: mT at 50 mT in the normal phase. This broadening which is reduced by a factor nearly 2 Higemoto et al. (2010) in the SC state is negligible at 50 mT compared to the other contributions, but it is not for sizably larger fields.
- Riseman et al. (1995) T. M. Riseman et al., Phys. Rev. B 52, 10569 (1995).
- Note (2) Explicitly, this means that all the spectra taken at a given and for different or at a given and for different are fitted together with the constraints given in the text. Each point of the asymmetry spectrum is weighted statistically.
- Bulaevskii et al. (1992) L. N. Bulaevskii, M. Ledvij, and V. G. Kogan, Phys. Rev. B 46, 366 (1992).
- Yaouanc et al. (1997) A. Yaouanc, P. Dalmas de Réotier, and E. H. Brandt, Phys. Rev. B 55, 11107 (1997).
- Howald et al. (2011) L. Howald et al., New J. Phys. 13, 113039 (2011).
- Higemoto et al. (2002) W. Higemoto et al., J. Phys. Soc. Jpn. 71, 1023-1026 (2002).
- Eskildsen et al. (2003) M. R. Eskildsen et al., Phys. Rev. Lett. 90, 187001 (2003).
- Bianchi et al. (2008) A. D. Bianchi et al., Science 319, 177 (2008).
- Michal and Mineev (2010) V. P. Michal and V. P. Mineev, Phys. Rev. B 82, 104505 (2010).
- Chia et al. (2003) E. E. M. Chia et al., Phys. Rev. B 67, 014527 (2003).
- Özcan et al. (2003) S. Özcan et al., EPL (Europhysics Letters) 62, 412 (2003).
- Kogan et al. (2009) V. G. Kogan, R. Prozorov, and C. Petrovic, J. Phys.: Condens. Matter 21, 102204 (2009).
- Yashima et al. (2004) M. Yashima et al., J. Phys. Soc. Jpn. 73, 2073 (2004).
- Knebel et al. (2010) G. Knebel et al., Phys. Status Solidi B 247, 557 (2010).
- Seyfarth et al. (2005) G. Seyfarth et al., Phys. Rev. Lett. 95, 107004 (2005).
- MacLaughlin et al. (2002) D. E. MacLaughlin et al., Phys. Rev. Lett. 89, 157001 (2002).
- Booth et al. (2011) C. H. Booth et al., Phys. Rev. B 83, 235117 (2011).
- Heffner et al. (2010) R. H. Heffner et al., J. Phys.: Conf. Ser. 225, 012011 (2010).
- Watanabe and Miyake (2011) S. Watanabe and K. Miyake, J. Phys.: Condens. Matter 23, 094217 (2011).
- Uemura et al. (1991) Y. J. Uemura et al., Phys. Rev. Lett. 66, 2665 (1991).