The Distance to M101 Hosting Type Ia SN 2011fe Based on the Tip of the Red Giant Branch
Abstract
We present a new determination of the distance to M101, host of the type Ia SN 2011fe, based on the tip of the red giant branch method (TRGB). Our determination is based on Hubble Space Telescope archival and images of nine fields within the galaxy. Color-magnitude diagrams of arm-free regions in all fields show a prominent red giant branch (RGB). We measure the -band magnitudes of the TRGB, obtaining a mean value of (where the error is a standard error), using an edge-detection method. We derive a weighted mean value of distance modulus , corresponding to a linear distance of Mpc. While previous estimates for M101 show a large range (TRGB distances of to 29.42 and Cepheid distances of to 29.71), our measurements of the TRGB distances for nine fields show a small dispersion of only 0.02. We combine our distance estimate and photometry in the literature to derive absolute peak magnitudes in optical and near-infrared bands of SN 2011fe. Absolute maximum magnitudes of SN 2011fe are mag brighter in the optical band and much more in the NIR than the current calibrations of SNe Ia in the literature. From the optical maximum magnitudes of SN 2011fe we obtain a value of the Hubble constant, km s-1 Mpc-1, slightly smaller than other recent determinations of .
1 Introduction
M101 (NGC 5457) is a well-known face-on spiral galaxy (SAB(rs)cd) in the M101 group. In 2011 a new Type Ia supernova (SN Ia) 2011fe was discovered in this galaxy, being the fourth SN discovered in the same galaxy (Nugent et al., 2011; Liu et al., 2012; Richmond & Smith, 2012). It is one of the nearest among the known galaxies hosting SNe Ia. SN 2011fe suffers little from interstellar extinction () and was discovered in less than one day after explosion(Nugent et al., 2011). Therefore it plays an important role for calibrating the absolute luminosity of SNe Ia as well as for studying the properties of SNe Ia including their progenitors (Reindl et al., 2005; Nugent et al., 2011; Tammann & Reindl, 2012; Bloom et al., 2012; Röpke et al., 2012; Matheson et al., 2012).
Surprisingly recent measurements of the distance to M101 show a large range, to 29.71 (Shappee & Stanek (2011); Matheson et al. (2012); Vinko et al. (2012) and references therein). Even the measurements based on two primary distance indicators, Cepheids and the tip of the red giant branch (TRGB) (Lee et al., 1993), show a significant dispersion: to 29.71 for Cepheids (Kelson et al., 1996; Kennicutt et al., 1998; Stetson et al., 1998; Freedman et al., 2001; Macri et al., 2001; Saha et al., 2006; Shappee & Stanek, 2011), and to 29.42 for the TRGB (Sakai et al., 2004; Rizzi et al., 2007; Shappee & Stanek, 2011). Note that one of the most recent estimates, Shappee & Stanek (2011), shows significant differences in both Cepheid and TRGB distances from previous ones. Therefore the distance to M101 is still significantly uncertain in spite of its importance. Consequently, a determination of the Hubble constant based solely on the photometry of SN 2011fe and previously-published distances can yield values ranging from 56 to 76 km s-1 Mpc-1 (Matheson et al., 2012).
In this study we present a new determination of the distance to M101 using the TRGB, from the images for several fields within this galaxy available in the Hubble Space Telescope (HST) archive. While previous studies to derive the TRGB distances to M101 were based on one or two fields, we used nine fields. This allows us to estimate the M101 distance with much smaller statistical uncertainty than previous studies.
2 Data Reduction
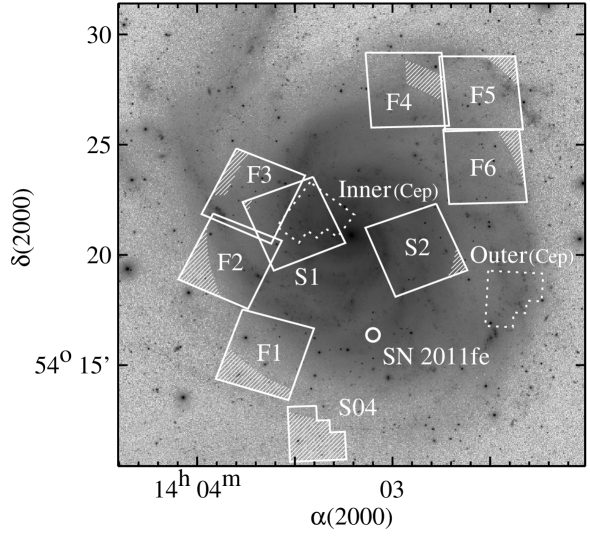
We used and images of M101 taken with the HST/Advanced Camera for Surveys (ACS) (Proposal IDs: 9490, 9492, and 10918) and with the WFPC2 (Proposal ID: 8584). Figure 1 displays a finding chart for M101, showing the HST fields used in this study (F1, F2, F3, F4, F5, and F6) and previous studies (S1 and S2 in Shappee & Stanek (2011) and S04 in Sakai et al. (2004)). Note that the S04 field is isolated in the outskirts of the disk, while S1 and S2 are much closer to the center than the other fields. Two fields used in previous Cepheid studies (Kelson et al., 1996; Kennicutt et al., 1998) are denoted by ’outer’ and ’inner’, respectively.
We derived instrumental magnitudes of point sources in the ACS images using the IRAF/DAOPHOT package that is designed for point spread function (PSF) fitting photometry (Stetson, 1994). We used 2- as the detection threshold, and derived the PSFs using isolated bright stars in the images. We derived aperture corrections using a large aperture with radius of for several isolated bright stars in the images. The uncertainties associated with aperture correction are on average 0.02 mag for both filters. We transformed the instrumental magnitudes into the standard Johnson-Cousins magnitudes, following equations (1) and (12) for observed magnitudes of Sirianni et al. (2005). In the case of WFPC2 images we used Dolphot (http://americano.dolphinsim.com/dolphot/). The uncertainties associated with the photometric transformations are on average 0.02 mag.
3 Results
3.1 Color-magnitude Diagrams of Resolved Stars
M101 is an almost face-on galaxy (inclination angle = 17 deg (Zaritsky et al., 1990)) and all HST fields available in the archive are overlapped with the disk of the galaxy so that they must include a mixture of disk stars and old halo stars. To reduce the fraction of young disk stars as much as possible in constructing the color-magnitude diagrams (CMDs) for each field, we chose the stars located away from the spiral arms of star-forming regions in each field. Thus selected regions in each field are marked by the hatched region in Figure 1. Foreground reddening toward M101 is known to be very small, (Schlegel et al., 1998; Schlafly & Finkbeiner, 2011). Corresponding values are and . Internal reddening for red giants in the arm-free regions of this face-on galaxy is expected to be negligible so that it is not corrected in the following analysis.
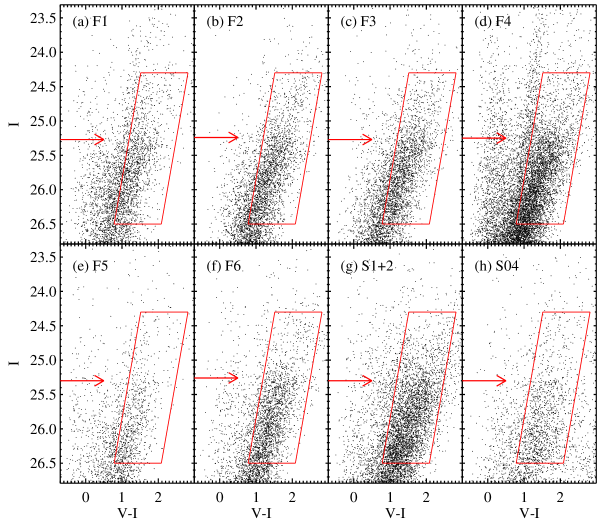
Figure 2 displays the CMDs for the stars in the selected regions of F1, F2, F3, F4, F5, F6, (S1 + S2), and S04 fields. The CMDs for all fields show a prominent red giant branch (RGB) as well as weaker asymptotic giant branch (AGB), massive giants, and blue main sequence. These RGBs are useful for estimating the magnitude of the TRGB and the distance to M101.
3.2 Distance Estimation
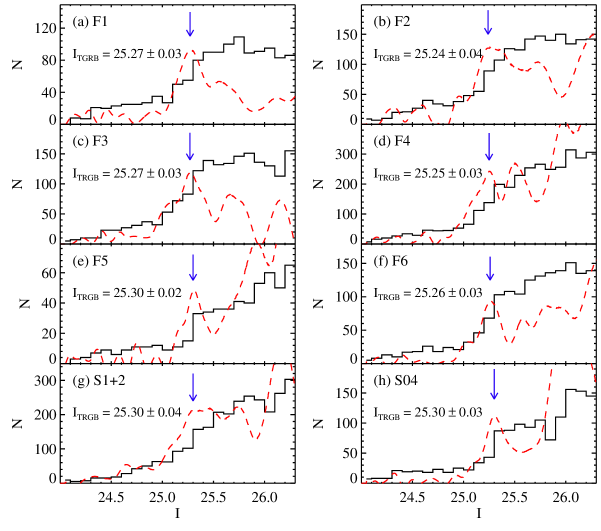
We determined the distance to the target fields using the TRGB method, which is known to be an excellent distance indicator for resolved stellar systems (Lee et al., 1993; Sakai et al., 1996; Méndez et al., 2002; Bellazzini, 2008; Mouhcine et al., 2010; Salaris, 2011). First we derived the -band luminosity functions of the red giants in each field using the stars inside the boundary marked in Figure 2, and plotted them in Figure 3. Figure 3 shows that there appears to be a sudden jump at mag in each field, which corresponds to the TRGB.
Using the edge-detecting algorithm (Sakai et al., 1996; Méndez et al., 2002; Mouhcine et al., 2010), we determined the TRGB magnitude more quantitatively. We calculated an edge-detection response function ( where is the luminosity function of magnitude and is the mean photometric error within a bin of mag about magnitude ), as shown in Figure 3. The errors for the TRGB magnitudes were determined using bootstrap resampling method with one million simulations. In each simulation we resampled randomly the RGB sample with replacement to make a new sample of the same size. We estimated the TRGB magnitude for each simulation using the same procedure, and derived the standard deviation of the estimated TRGB magnitudes. The median color of the TRGB is derived from the colors of the bright red giants close to the TRGB.
We used the recent calibration for the absolute magnitude of the TRGB given in Rizzi et al. (2007): (where is a reddening corrected color of the TRGB), which is very similar to that given in Tammann et al. (2008). Then we calculate the distance modulus using .
We also derived the distance using the composite magnitude for the RGB introduced in Madore et al. (2009): and . This calibration is based on the absolute TRGB magnitude of for , similar to the calibration in Rizzi et al. (2007).
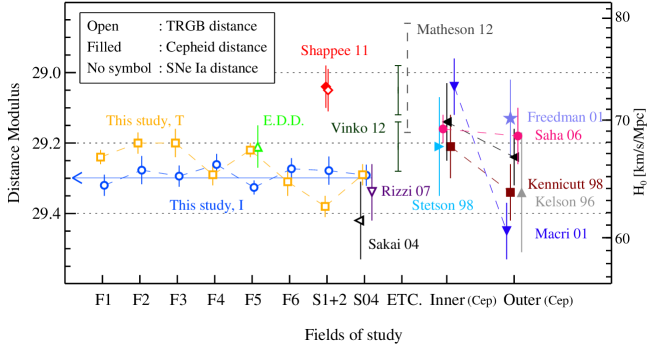
Table 1 lists a summary of the distance determination for the fields in M101 derived in this study, which is also shown in Figure 4. Table 1 includes -band magnitudes of the TRGB, magnitudes of the RGB, color of the RGB (before foreground reddening correction), absolute -band magnitudes of the TRGB, and distance moduli from -band magnitudes and magnitudes. Remarkably the -band magnitudes of the TRGB derived for all nine fields show a small range from 25.24 (F2) to 25.30 (F5, S1, S2 and S04). A weighted mean value is derived to be (where the error is a standard error) with a standard deviation of only 0.02. Similarly the distance moduli for all fields show a small range from (F4) to (F5). We derive a weighted mean value of distance modulus where 0.01 is a random error, corresponding to a linear distance of Mpc. Its systematic error is estimated to be 0.12, considering (a) the TRGB calibration error of 0.12 (Bellazzini et al., 2001, 2004; Mager et al., 2008), (b) the aperture correction error of 0.02, (c) and the standard calibration error of 0.02 for ACS/WFC (Sirianni et al., 2005) and 0.07 for WFPC2 (Stetson, 1998). Similar results are obtained from the magnitude method, , but with three times larger standard deviation (0.07). We adopt the results from the traditional -band magnitude method, as the distance to M101, which shows a smaller scatter than the magnitude results.
4 Discussion
4.1 Comparison with Previous Distance Estimates
We compare our estimates for the distance to M101 with those in the literature based on TRGB, Cepheids, and SN Ia in Figure 4. Recently Shappee & Stanek (2011) derived a TRGB distance from the analysis of S1 and S2 fields, . This value is 0.3 to 0.4 mag smaller than the previous TRGB distance estimates by Sakai et al. (2004) and Rizzi et al. (2007). The TRGB magnitudes for M101 derived in the previous studies are in Sakai et al. (2004), in Rizzi et al. (2007), and in Shappee & Stanek (2011). Therefore the large difference among the previous TRGB distance estimates are mainly due to the difference in the measured TRGB magnitudes. Our mean value of the TRGB magnitudes (after foreground extinction correction), (and for (S1+S2) fields) is close to the value in Rizzi et al. (2007), 0.13 mag brighter than the value in Sakai et al. (2004), and 0.33 mag fainter than the value in Shappee & Stanek (2011). Our values for the S04 field () and for the sum of S1 and S2 fields () are similar to the mean value of nine fields. The large difference in the TRGB magnitudes between this study and Shappee & Stanek (2011) is probably due to contamination by disk stars in the sample used by the latter.
The Cepheid distance estimates for M101 derived in the previous studies show a large range. Two HST fields in M101 (inner field and outer field, as shown Figure 1) were used for Cepheids in the previous studies. They show on average smaller values for the inner field (Stetson et al., 1998; Saha et al., 2006; Kennicutt et al., 1998; Macri et al., 2001; Shappee & Stanek, 2011) than those for the outer field (Kelson et al., 1996; Kennicutt et al., 1998; Macri et al., 2001; Saha et al., 2006). This difference between the inner and outer fields may be considered to be mainly due to metallicity gradient in the galaxy disk. However, the distance modulus difference shows a large range from almost zero (Saha et al., 2006) to ∼ 0.4 mag (Macri et al., 2001), depending on the authors. This difference has been explained. Saha et al. (2006) adopted a metallicity correction very similar to Freedman et al. (2001), which led them to Cepheid distances of 29.16 for the inner field and 29.18 for the outer field. These compare well to the Key Project final value of mag (Freedman et al., 2001). Macri et al. (2001) carried out artificial star tests and showed that their NICMOS photometry for the inner field was by 0.2 mag affected by blending. Cepheid distance estimates show a large scatter (of ∼ 0.3 mag) even for the outer field where blending effect is less severe, depending on the authors. The distance estimates by Freedman et al. (2001); Sakai et al. (2004); Saha et al. (2006) show a good agreement among them, but they are 0.2 mag shorter than those by Kelson et al. (1996); Kennicutt et al. (1998); Macri et al. (2001). The cause for this scatter needs to be investigated.
In contrast, our measurements of the TRGB magnitude for nine fields show a remarkably small dispersion. Note that our measurements show an excellent agreement among independent photometry (for example, between DAOPHOT photometry of ACS images and DOLPHOT photometry of WFPC2 images, among three different sets of HST images (F fields, S1 and S2 fields, and S04 fields), and among all nine fields).
4.2 The Absolute Calibration of SNe Ia and the Hubble Constant
We can use the distance measurement for M101 to check the calibration of SN Ia and to derive a value for the Hubble constant. Using two SN Ia optical light curve fitting methods with photometry of SN 2011fe, Vinko et al. (2012) obtained two estimates for the distance to M101 (assuming km s-1 Mpc -1): from the MLCS2k2 method (Jha et al., 2007) and from the SALT2 method (Guy et al., 2007). They concluded that the difference between these two estimates is considered to be due to difference in the zero point calibration of the fiducial SN peak magnitude in the two methods. Our result is closer to the value from the MLCS2k2 method (Jha et al., 2007), indicating that the calibration of the MLCS2k2 method is closer to the TRGB calibration, for the adopted km s-1 Mpc -1.
Richmond & Smith (2012) presented optical maximum magnitudes of SN 2011fe: , , and , and derived absolute magnitudes of SN 2011fe adopting a distance modulus of . They derived also similar values considering the decline rate of . Adopting our distance measurement, we derive absolute magnitudes of SN 2011fe that are 0.2 mag brighter than those in Richmond & Smith (2012): , , and , and . (, , and , and after the decline rate correction). The derived value of is between of the values derived from nearby SNe Ia in the previous studies: recent values in Riess et al. (2011) () and old values in Gibson et al (2000) () that are similar to those in Sandage et al. (2006).
Near-infrared (NIR) photometry of SN Ia is potentially a very promising tool for cosmology (Kattner et al., 2012; Barone-Nugent et al., 2012). However, recent calibrations of the NIR absolute magnitudes of SN Ia show large differences ( 0.4 mag) (Wood-Vasey et al., 2008; Folatelli et al., 2010; Burns et al., 2011; Mandel et al., 2009, 2011; Kattner et al., 2012), as summarized in Matheson et al. (2012). Our distance measurement for M101 is very useful for calibrating these NIR zero points of the SN Ia templates. Matheson et al. (2012) derived a large range of distance estimates from photometry of SN 2011fe: to 29.17, depending on the adopted calibration. These values are much smaller than our distance measurement.
Matheson et al. (2012) presented maximum magnitudes in each band for SN 2011fe: , , and , and magnitudes at the -band maximum time for SN 2011fe: , , and . ( is ignored here, as in Matheson et al. (2012) (see their Fig. 3)).
From these values with our distance estimate we derive the NIR absolute magnitudes for SN 2011fe: , , and (, , and for the -band maximum time). These values are 0.2 mag or more brighter than recent calibration of the NIR magnitudes for SN Ia available in the literature (Wood-Vasey et al., 2008; Folatelli et al., 2010; Burns et al., 2011; Mandel et al., 2009, 2011; Kattner et al., 2012).
If we use absolute magnitudes of SN 2011fe derived in this study, we obtain a value for the Hubble constant using the equation log (where , , and ) (Reindl et al., 2005), km s-1 Mpc-1(we included the internal luminosity dispersion of SNe Ia of 0.14 mag (Tammann & Reindl (2012)) for calculating the systematic error). This value is similar to that given in Tammann & Reindl (2012) based on six SNe Ia including SN 2011fe, km s-1 Mpc-1, but smaller than other recent determinations (Riess et al., 2011; Freedman et al., 2012), km s-1 Mpc-1. This implies three possibilities: (a) that the optical maximum magnitudes of SN 2011fe may be mag brighter than typical SNe Ia, (b) that the recent calibration of optical maximum magnitudes of SN Ia may be 0.2 mag fainter, or (c) that the value for the Hubble constant may be somewhat lower than the values derived recently in other studies.
5 Summary
We present a new determination of the distance to M101, host of the Type Ia SN 2011fe, using the tip of the red giant branch method (TRGB) from and images of nine fields within this galaxy in the Hubble Space Telescope archive. Primary results are as follows.
-
•
Color-magnitude diagrams of arm-free regions in all fields show a prominent RGB.
-
•
We measured the -band magnitudes of the TRGB, obtaining a mean value of with a standard deviation of only 0.02, using an edge-detection method. From this we derive a weighted mean value of distance modulus , corresponding to a linear distance of Mpc. Its systematic error is estimated to be 0.12. Our measurements of the TRGB distances for nine fields show a small dispersion of only 0.02, much smaller than the previous estimates.
-
•
With this distance value we derive the optical and NIR absolute maximum magnitudes of SN 2011fe (at the maximum of each band and at the -band maximum time). Absolute magnitudes of SN 2011fe are 0.2 mag brighter in the optical band and much more in the NIR than the recent calibrations of SN Ia in the literature.
-
•
From the optical magnitudes of SN 2011fe and our distance measurement for M101 we obtain a value of the Hubble constant, km s-1 Mpc-1, somewhat smaller than other recent determinations Riess et al. (2011); Freedman et al. (2012). This implies (a) that optical maximum magnitudes of SN 2011fe may be 0.2 mag brighter than typical SNe Ia, (b) that the recent calibration of optical maximum magnitudes of SN Ia may be mag fainter, or (c) that the value for the Hubble constant may be somewhat lower than other recent determinations.
The authors are grateful to the anonymous referee for his/her comments that improved the original manuscript. This is supported in part by the Mid-career Researcher Program through an NRF grant funded by the MEST (No.2010-0013875).
References
- Barone-Nugent et al. (2012) Barone-Nugent, R. L., Lidman, C., Wyithe, J. S. B., et al. 2012, MNRAS, 425, 1007
- Bellazzini et al. (2001) Bellazzini, M., Ferraro, F. R., & Pancino, E. 2001, ApJ, 556, 635
- Bellazzini et al. (2004) Bellazzini, M., Ferraro, F. R., Sollima, A., Pancino, E., & Origlia, L. 2004, A&A, 424, 199
- Bellazzini (2008) Bellazzini, M. 2008, Mem. Soc. Astron. Italiana, 79, 440
- Bloom et al. (2012) Bloom, J. S., Kasen, D., Shen, K. J., et al. 2012, ApJ, 744, L17
- Burns et al. (2011) Burns, C. R., Stritzinger, M., Phillips, M. M., et al. 2011, AJ, 141, 19
- Folatelli et al. (2010) Folatelli, G., Phillips, M. M., Burns, C. R., et al. 2010, AJ, 139, 120
- Freedman et al. (2001) Freedman, W. L., Madore, B. F., Gibson, B. K., et al. 2001, ApJ, 553, 47
- Freedman & Madore (2010) Freedman, W. L., & Madore, B. F. 2010, ARA&A, 48, 673
- Freedman et al. (2012) Freedman, W. L., Madore, B. F., Scowcroft, V., et al. 2012, ApJ, 758, 24
- Gibson et al (2000) Gibson, B. K., Stetson, P. B., Freedman, W. L., et al. 2000, ApJ, 529, 723
- Guy et al. (2007) Guy, J., Astier, P., Baumont, S., et al. 2007, A&A, 466, 11
- Jha et al. (2007) Jha, S., Riess, A. G., & Kirshner, R. P. 2007, ApJ, 659, 122
- Kattner et al. (2012) Kattner, S., Leonard, D. C., Burns, C. R., et al. 2012, PASP, 124, 114
- Kelson et al. (1996) Kelson, D. D., Illingworth, G. D., Freedman, W. F., et al. 1996, ApJ, 463, 26
- Kennicutt et al. (1998) Kennicutt, R. C., Jr., Stetson, P. B., Saha, A., et al. 1998, ApJ, 498, 181
- Lee et al. (1993) Lee, M. G., Freedman, W. L., & Madore, B. F. 1993, ApJ, 417, 553
- Liu et al. (2012) Liu, J., Di Stefano, R., Wang, T., & Moe, M. 2012, ApJ, 749, 141
- Macri et al. (2001) Macri, L. M., Calzetti, D., Freedman, W. L., et al. 2001, ApJ, 549, 721
- Madore et al. (2009) Madore, B. F., Mager, V., & Freedman, W. L. 2009, ApJ, 690, 389
- Mager et al. (2008) Mager, V. A., Madore, B. F., & Freedman, W. L. 2008, ApJ, 689, 721
- Mandel et al. (2009) Mandel, K. S., Wood-Vasey, W. M., Friedman, A. S., & Kirshner, R. P. 2009, ApJ, 704, 629
- Mandel et al. (2011) Mandel, K. S., Narayan, G., & Kirshner, R. P. 2011, ApJ, 731, 120
- Matheson et al. (2012) Matheson, T., Joyce, R. R., Allen, L. E., et al. 2012, ApJ, 754, 19
- Méndez et al. (2002) Méndez, B., Davis, M., Moustakas, J., et al. 2002, AJ, 124, 213
- Mouhcine et al. (2010) Mouhcine, M., Harris, W. E., Ibata, R., & Rejkuba, M. 2010, MNRAS, 404, 1157
- Nugent et al. (2011) Nugent, P. E., Sullivan, M., Cenko, S. B., et al. 2011, Nature, 480, 344
- Reindl et al. (2005) Reindl, B., Tammann, G. A., Sandage, A., & Saha, A. 2005, ApJ, 624, 532
- Richmond & Smith (2012) Richmond, M. W., & Smith, H. A. 2012, arXiv:1203.4013
- Riess et al. (2011) Riess, A. G., Macri, L., Casertano, S., et al. 2011, ApJ, 730, 119
- Rizzi et al. (2007) Rizzi, L., Tully, R. B., Makarov, D., et al. 2007, ApJ, 661, 815
- Röpke et al. (2012) Röpke, F. K., Kromer, M., Seitenzahl, I. R., et al. 2012, ApJ, 750, L19
- Saha et al. (2006) Saha, A., Thim, F., Tammann, G. A., et al. 2006, ApJS, 165, 108
- Sakai et al. (1996) Sakai, S., Madore, B. F., & Freedman, W. L. 1996, ApJ, 461, 713
- Sakai et al. (2004) Sakai, S., Ferrarese, L., Kennicutt, R. C., Jr., & Saha, A. 2004, ApJ, 608, 42
- Salaris (2011) Salaris, M. 2011, Ap&SS, 714
- Sandage et al. (2006) Sandage, A., Tammann, G. A., Saha, A., et al. 2006, ApJ, 653, 843
- Schlafly & Finkbeiner (2011) Schlafly, E. F., & Finkbeiner, D. P. 2011, ApJ, 737, 103
- Schlegel et al. (1998) Schlegel, D. J., Finkbeiner, D. P., & Davis, M. 1998, ApJ, 500, 525
- Shappee & Stanek (2011) Shappee, B. J., & Stanek, K. Z. 2011, ApJ, 733, 124
- Sirianni et al. (2005) Sirianni, M., Jee, M. J., Benítez, N., et al. 2005, PASP, 117, 1049
- Stetson (1994) Stetson, P. B. 1994, PASP, 106, 250
- Stetson (1998) Stetson, P. B. 1998, PASP, 110, 1448
- Stetson et al. (1998) Stetson, P. B., Saha, A., Ferrarese, L., et al. 1998, ApJ, 508, 491
- Tammann et al. (2008) Tammann, G. A., Sandage, A., & Reindl, B. 2008, ApJ, 679, 52
- Tammann & Reindl (2012) Tammann, G. A., & Reindl, B. 2012, A&A, in press (arXiv:1208.5054)
- Vinko et al. (2012) Vinko, J., Sarneczky, K., Takats, K., et al. 2012, A&A, 546, 12
- Wood-Vasey et al. (2008) Wood-Vasey, W. M., Friedman, A. S., Bloom, J. S., et al. 2008, ApJ, 689, 377
- Zaritsky et al. (1990) Zaritsky, D., Hill, J. M., & Elston, R. 1990, AJ, 99, 1108
| Field | Region | ||||||
|---|---|---|---|---|---|---|---|
| F1 | |||||||
| F2 | |||||||
| F3 | , Dec | ||||||
| F4 | , R.A. | ||||||
| F5 | |||||||
| F6 | |||||||
| S1 | |||||||
| S2 | |||||||
| S1+2 | |||||||
| S04 | |||||||
| Weighted mean of F16, S1+2 and S04 | |||||||