WIMP DM and first stars: suppression of fragmentation in primordial star formation
Abstract
We present the first 3D simulations to include the effects of dark matter annihilation feedback during the collapse of primordial mini-halos. We begin our simulations from cosmological initial conditions and account for dark matter annihilation in our treatment of the chemical and thermal evolution of the gas. The dark matter is modelled using an analytical density profile that responds to changes in the peak gas density. We find that the gas can collapse to high densities despite the additional energy input from the dark matter. No objects supported purely by dark matter annihilation heating are formed in our simulations. However, we find that the dark matter annihilation heating has a large effect on the evolution of the gas following the formation of the first protostar. Previous simulations without dark matter annihilation found that protostellar discs around Population III stars rapidly fragmented, forming multiple protostars that underwent mergers or ejections. When dark matter annihilation is included, however, these discs become stable to radii of 1000 AU or more. In the cases where fragmentation does occur, it is a wide binary that is formed.
Subject headings:
Dark matter, Population III star formation1. Introduction
Modern cosmology describes a Universe in accelerated expansion, with 73% of its energy density today consisting of an unknown substance dubbed “dark energy”, and the remaining 27% consisting primarily of matter, with a very minor contribution from radiation. It is remarkable that of the whole matter content, only 17% of it can be accounted for by known particles described by the standard model of particle physics, whereas the remainder is of unknown nature, only (at most) weakly interacting with its surroundings. The nature of this dark matter (DM) is still unknown, and theories such as supersymmetry that extend the standard model and provide candidates for the particle making up the DM are currently being tested at the Large Hadron Collider at CERN.
In spite of the unknown nature of the basic constituents of our Universe, its description within the standard cosmological model holds solidly. The growth of structure is predicted to take place in a hierarchical fashion. Smaller DM and gas structures (halos) are predicted to collapse gravitationally at earlier times than more massive ones, and evidence for this is indeed observed.
So far, however, the first generation of stars to have formed in the Universe, after the long period of cosmic silence and darkness known as the cosmic “dark ages” has not been observed. The formation of stars from this first generation – Population III stars – is harboured in the bosom of the very first DM and gas halos to undergo gravitational collapse: structures of masses 10 M/M 107 which become nonlinear at redshifts . These stars are too distant to be observed directly with any current telescope, and so their nature must be probed theoretically. Originally, it was thought that isolated, extremely massive stars (Abel et al., 2000, 2002; Yoshida et al., 2008) would be formed from such primordial halos as they have high temperatures and only simple molecules such as H2 and HD to provide the necessary cooling (e.g. Glover, 2005; Omukai et al., 2005). However, recent work has shown even in these conditions small stellar systems may be formed due to fragmentation occurring in protostellar discs around Population III stars (Clark et al., 2008; Turk et al., 2009; Stacy et al., 2010; Clark et al., 2011a, b; Greif et al., 2011, 2012). Such systems are predicted to have masses ranging from a few tenths to a few tens of a solar mass, with a mass spectrum that is presumably flat (Dopcke et al., 2012).
Interestingly enough, the story of the first stars could be intimately related to that of the DM. One popular class of candidates for the DM particle are the weakly interacting massive particles (WIMPs). These are the lightest supersymmetric partners in supersymmetry theories conserving -parity, or the lightest mode in extra dimension theories under -parity conservation. They are stable and they “naturally” comply with all the phenomenological requirements of DM (Taoso et al., 2008a). Although we refer the reader to Bertone et al. (2005) for a detailed review of WIMPs, we note here that they have two very important properties: they are self-annihilating Majorana particles (i.e. they are their own anti-particles) and they interact only weakly with baryons.
While the effects of WIMPs on stellar formation in the local Universe are suppressed (Ascasibar., 2007), Spolyar et al. (2008) noted that the annihilation of WIMPs accumulated by gas-driven gravitational drag into the center of a collapsing halo would strongly heat the gas at the center of the halo. In the absence of metals – i.e. in a halo forming Population III stars – the energy input could potentially be so large as to overcome the cooling provided by H2 molecules. The authors speculated that this could halt the collapse of the gas, and form what they dubbed a “dark star”: a pseudo-star with a size of an AU or more powered by DMA rather than by nuclear fusion. It was also soon realised that if a canonical protostar were to be formed, it could capture DM through weak scattering between the WIMPs and the baryons constituting the star, and that this could in principle affect the main sequence (MS) evolution of the newly formed star (Iocco, 2008).
Several studies have since addressed these processes in more detail. Freese et al. (2008) and Spolyar et al. (2009) proposed that the accretion of infalling gas could be sustained by DMA indefinitely up to the formation of objects of masses of 105M⊙. However, Iocco et al. (2008) found that such a phase could not last for longer than 104 yr before reaching the Hayashi track, and the findings in Hirano et al. (2011) were intermediate between these extremes. The results of those studying the capture of DM onto a hydrostatic object mediated via weak interaction, are more homogenous. It is found that weakly captured DM can in principle indefinitely power the star as it is sustained not by nuclear reactions but by DMA, leading to a prolongation of the star’s life (Iocco et al., 2008; Yoon et al., 2008; Taoso et al., 2008b). It is not clear, however, how much DM can be consumed in the pre-MS process, and therefore how much is available to be captured during the main sequence (Sivertsson & Gondolo, 2011). Indeed, some of the more extreme models of dark star formation create problems in standard reionisation scenarios due to their predictions of very high stellar masses or very long lifetimes (Schleicher et al., 2008, 2009a). However, in some cases dark stars may delay rather than accelerate the reionisation process (Scott et al., 2011). Direct observation seems challenging for most models of dark stars, Zackrisson et al. (2010), whereas the most extreme objects can already be ruled out with the use of HST observations, (Zackrisson et al., 2010).
Regardless of the efficiencies of these processes, DMA takes place throughout the halo. The effects of DMA will be felt most keenly when the halo has collapsed to high central gas densities, but subtle effects due to the influence of annihilation upon the gas chemistry can take place even earlier in the halo’s life. This has been addressed in Ripamonti et al. (2010), who used a one-dimensional code to self-consistently solve for the chemical, thermal and dynamical evolution of the cloud in the presence of DMA. Intriguingly, the authors found that DMA had little effect on the gas prior to its collapse to near-stellar densities. However, the scope of these results was limited as the maximum resolvable density in the Ripamonti et al. (2010) study was reached before a hydrostatic object was formed. In complementary work, Stacy et al. (2012) addressed the phases after the formation of a hydrostatic object, adopting an ad-hoc prescription for the earlier phase. These authors found that if multiple protostars were present, dynamical interactions would displace them from the DM density peak, thereby removing them from the region where DMA would have the most influence.
In this paper we bridge the gap before and after star formation in one continuous three-dimensional simulation that fully accounts for the effects of DMA, primordial gas chemistry and time-dependent heating and cooling. This allows us to determine at which stage, if any, DMA plays a role in the formation of a Population III star. Our paper is structured as follows: Section 2 outlines the method, Section 3 describes the initial conditions, Sections 4 and 5 present our results, Section 6 discusses the results, and finally Section 7 summarises our conclusions.
2. Method
2.1. Basic approach
We perform the calculations for this paper using the smoothed particle hydrodynamics (SPH) code gadget 2 (Springel, 2005). We have substantially modified this code to include a fully time-dependent chemical network, details of which can be found in the Appendix of Clark et al. (2011a). Our treatment includes: H2 line cooling (Glover & Abel, 2008), which is treated in the optically thick regime using the Sobolev approximation (Yoshida et al., 2006; Clark et al., 2011a); collision-induced emission from very high density H2 (Ripamonti & Abel, 2004); cooling due to the collisional ionisation and recombination of hydrogen and helium (Glover & Mac Low, 2007); as well as heating and cooling arising due to changes in the molecular fraction, shock heating, compressional heating and cooling due to rarefactions. Turk et al. (2011) showed that the choice of the H2 three-body formation rate coefficient influences the resulting dynamics of the gas within the halo. In this work we use the three-body H2 formation rate of Glover (2008) which is intermediate within the range of the published rates.
To treat gas which collapses to scales smaller than the resolution limit of our simulations, we use a sink particle approach. We create sinks using the standard Bate et al. (1995) algorithm. Our particular implementation of this is the same as that used in Jappsen et al. (2005). The minimum number density for sink particle creation is , but it is important to note that candidate regions must also satisfy a series of tests to ensure that they are unambiguously collapsing. The ratio of thermal energy and rotational energy to the magnitude of the gravitational potential energy ( and respectively) for the particles that will be turned into the sink must satisfy the conditions
| (1) |
| (2) |
In addition, the total energy of the particles must be negative, and the divergence of their accelerations must be zero in order to prevent structures that are likely to bounce or be tidally disrupted being turned into sinks. Consequently sink particle formation often occurs above this density threshold.
We set the outer accretion radius of the sink particles, , to 6 AU and the inner accretion radius, , to 4 AU. SPH particles that come within a distance of a sink are accreted only if they are gravitationally bound to that sink. SPH particles that come closer than are always accreted. Once sinks have formed, we account for the accretion luminosity produced by the ongoing accretion of gas onto the sinks using the scheme described in Smith et al. (2011), which assumes that all of the protostars that form are normal Population III protostars, and not dark stars. We would expect the heating produced by accretion onto dark stars to be smaller, owing to their larger radii, and so this procedure gives us an upper limit on the effect of the accretion luminosity.
2.2. Treatment of dark matter annihilation
Most current simulations have insufficient resolution to follow the DM contraction within a primordial halo with the same resolution as that used for the baryons. For example, Abel et al. (2002) had a DM mass resolution of 1.1 M⊙ which meant they could not determine the DM profile at radii smaller than around 0.05 pc. Instead, the method of adiabatic contraction developed by Blumenthal et al. (1986) has been used by various authors (e.g. Spolyar et al., 2008; Ripamonti et al., 2010) to calculate how the DM distribution will respond to changes in the gravitational potential of the gas. Spolyar et al. (2008) applied this method to the collapsing halo simulations of Abel et al. (2002) and Gao et al. (2007) and found that the DM density at the outer edge of the baryonic core after adiabatic contraction was well-fit by the expression
| (3) |
where is the DM density at the edge of the core and is the number density of hydrogen nuclei in the core.111To convert from the DM density in energy units to the value in the more familiar mass density units, one simply multiplies by a factor of . Moreover, it is also possible to express the gas density in energy units; for a gas with primordial composition, we have , where is the number density of hydrogen nuclei.
Given the considerable technical challenges involved if one attempts to follow the evolution of the DM density profile directly, we do not attempt to do so. Instead, we parameterise its effects, with the help of the adiabatic contraction results of Spolyar et al. (2008). The DM density profile is calculated within the code as follows. At each time-step, the point of maximum gravitational potential energy in the halo is found, which we assume to be the point at which the DM density has its maximum value. Next, the maximum baryon density of the halo is found and the DM density at the outer edge of the core calculated from it using Equation 3. Its radial dependence is then described by a two-part power law fit, using power-law slopes drawn from the calculations of Ripamonti et al. (2010). In the outer halo, at distances from the centre of the density profile, we have
| (4) |
where is the radial distance from the centre and is a normalising constant that is equal to the DM density at . The size of the central DM core, , is determined by finding the radius at which the DM densities given by Equations 3 and 4 are equal, which yields
| (5) |
Finally, the DM density profile within the core, at radii , is given by
| (6) |
It is unclear how efficient adiabatic contraction will be within the central regions of the DM halo, given that gravitational collapse of the gas in these regions occurs rapidly. Our adoption of a peaked DM profile within the core may therefore be an overestimate; see, for instance, the discussion of the validity of the adiabatic contraction approximation given in Ripamonti et al. (2010).
Given the DM density profile, the contribution of DMA to the halo energy budget is computed as follows. We follow Spolyar et al. (2008) and adopt the standard DMA cross section of cm3s-1. For the DM particle mass, , we note that astrophysical constraints require that (see e.g. Ackermann et al., 2011; Galli et al., 2011). Additionally the desire to avoid fine-tuning while still explaining the gauge hierarchy problem argues for an upper limit . We therefore adopt a DM particle mass of GeV for our fiducial case, close to the middle of this range of values, but we also explore the effect of varying . Following Valdés & Ferrara (2008), we assume that one third of the energy from DMA is immediately carried away by neutrinos and that the remaining energy is split between direct heating of the gas, ionisation and dissociation of the constituents of the gas, and the excitation of H, He and H2. The fraction that is deposited as heat is given by
| (7) |
and the fraction that goes into ionisation is given by
| (8) |
where is the fractional abundance of electrons. The remaining energy is radiated away in electronic transitions from H, He and H2 and plays no direct role in the evolution of the gas. The total power per unit volume injected by DMA is
| (9) |
where is the number of DMAs per unit volume per unit time. This is given by
| (10) |
where is the number density of DM particles. The resulting energy injection rates per unit volume for heating () and ionisation () are
| (11) |
| (12) |
where is the fraction of the total energy that affects the gas (one third of the energy escapes in the form of neutrinos).
We estimate the optical depth of the gas to the annihilation products, , by assuming that the baryonic density profile is flat within the DM core and declines as a power-law at larger radii. For a profile of this form, the column density of gas, measured radially outwards from a point , is given at by
| (13) |
and at by
| (14) |
where is the virial radius of the halo, which we take to mark the edge of the gas distribution. If we follow Ripamonti et al. (2010) and adopt a constant gas opacity of cm2g-1, and also restrict our attention to scales small compared to , then we can write the optical depth as
| (15) |
In practice, this expression for is an underestimate, for a couple of reasons. First, it assumes that the optical depth in any direction from point is the same as the value that we measure along a ray passing radially outwards, when in reality the optical depths in other directions will be somewhat larger. Second, the baryonic density profiles that we recover in our simulations do not completely match up with the profile we assumed to derive . Our assumed profiles and the real profiles both have power-law slopes in their outer regions, but the real profiles do not have the completely flat core that we assume within . Our estimate of is therefore too small at distances , meaning that our derived heating and ionisation rates may also be too small. In practice, we do not expect this to be a major source of error, as in the regime where DMA becomes important, gas with will typical have , meaning that the heating and ionisation rates are insensitive to the precise value of .
To convert from , the total energy per unit time per unit volume that goes into ionisations, to the ionisation rates of the individual chemical species present in the gas, we follow the procedure outlined in Ripamonti et al. (2007). They identified seven main reactions that can be caused by DMA: the ionisation of H, He, He+ and D, and the dissociation of H2, HD and H. Between them, these seven reactions account for the bulk of the energy lost in the form of ionisations or dissociations, and we follow Ripamonti et al. (2007) and split the energy available for ionisation between these seven species according to their relative abundances.
3. Initial Conditions
| Simulation | Annihilation | DM particle mass [GeV] |
|---|---|---|
| H1-ref | no | 0 |
| H1-lm | yes | 10 |
| H1 | yes | 100 |
| H1-hm | yes | 1000 |
| H2-ref | no | 0 |
| H2 | yes | 100 |
We take our initial conditions from the cosmological simulations and resimulations by Greif et al. (2011). These simulations made use of the novel moving mesh code arepo (Springel, 2010) to fully resolve the formation of five minihalos from cosmological initial conditions. Cells were refined during the evolution to ensure that the Jeans length was always resolved by at least 128 mesh points, up until the point at which the maximum number density in the collapsing gas reached . All of the halos modelled by Greif et al. (2011) formed multiple protostars with a range of masses.
For this work we cut out the central two parsecs of the Greif et al. (2011) simulations and continue their evolution using our modified version of gadget 2 with DMA, implemented as discussed in the previous section. The halos were selected at the point where their central gas number density reached for the first time. We selected this point to begin our resimulation because preliminary modelling using simplified initial conditions showed that this was the point at which indirect feedback from DMA-induced ionisation first becomes important.
Each mesh point in arepo is converted to an SPH particle with the same properties (mass, momentum, etc.) as the original mesh cell associated with that mesh point. As the network for primordial chemistry that is implemented in arepo was derived from the network that we use in gadget, both codes evolve the same set of chemical species and it is straightforward to transfer the chemical abundances from one code to the other. The formation of the first protostar occurs in the central region of the halos where the SPH particle masses are , giving us a mass resolution of around M⊙ (Bate & Burkert, 1997). For a test of the effectiveness of using arepo initial conditions for gadget 2 see Smith et al. (2011).
Greif et al. (2011) simulated the evolution of five different DM halos. In this work, however, we focus on only two of these five: Halo 1 (in the notation of Greif et al. 2011), which in the original calculation rapidly fragments into a multiple system, and Halo 2, which undergoes a phase of HD-dominated cooling, which ultimately leads to less fragmentation (c.f. Clark et al., 2011a). Halo 1 has a mass of 1810 M⊙ within its central 2 pc and we denote it in our study as H1. Halo 2 has a mass of 1240 M⊙ within its central 2 pc, and will be referred to as H2. Halo 1 has only SPH particles and Halo 2 particles, but due to the on-the-fly refinement used in arepo the particle mass in the central regions of the halo is only M⊙ as mentioned above. We did not include any traditional dark matter particles, but instead treated the dark matter analytically as described in the previous section.
For both halos, we run one simulation in which the effects of DMA are not included (H1-ref, H2-ref) and a second which assumes a DM particle mass of 100 GeV (H1, H2). For Halo 1, we also run two simulations with different values of : one in which we set GeV (H1-lm) and a second in which we set GeV (H1-hm). As the power produced per unit volume by DMA scales as , these two runs correspond to cases in which the energy input rate is increased or decreased by an order of magnitude, respectively. As astrophysical constraints strongly disfavour DM masses smaller than , (Schleicher et al., 2009b; Ackermann et al., 2011; Galli et al., 2011), our H1-lm model should give an indication of the largest effect that we can reasonably expect to obtain from DMA. Details of our simulations are summarised in Table 1.
4. Collapse to near stellar densities
4.1. Densities and temperatures
| Simulation | Time ( yr) |
|---|---|
| H1-ref | |
| H1 | |
| H1-lm | |
| H1-hm | |
| H2-ref | |
| H2 |
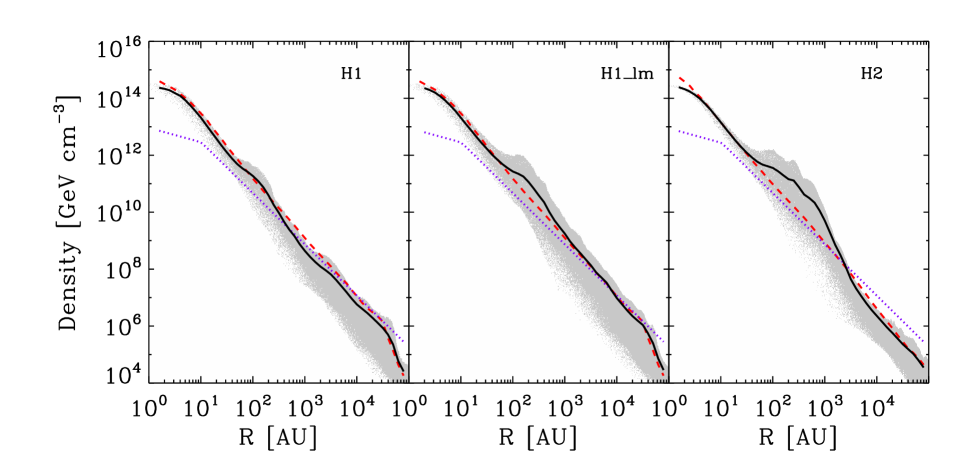
In
we show the density profiles of gas and DM for simulations H1, H1-lm, and H2, plus the two reference models. The simulations are compared when the hydrogen nuclei number density at the centre of the halo first reaches , which corresponds to a dark matter core radius of AU and a time of roughly 6 years before the formation of the first protostar. It is immediately apparent that the gas in each halo is able to collapse to high densities, regardless of the strength of the DMA feedback. This is true even in our maximal feedback model, H1-lm, where the DM particle mass was only 10 GeV. For reference, in Spolyar et al. (2008) it was predicted that collapse would stop at densities of cm-3 for a DM mass of 100 GeV, and at densities of cm-3 for a DM mass of 10 GeV. We find no evidence for this in our simulations. On the other hand, our results are in good agreement with the 1D results of Ripamonti et al. (2010), who found that the gas could collapse to densities of – in all of their models. We also found collapse up to high densities in run H1-hm, performed with a DM particle mass of 1000 GeV, but as the effects of DMA in this case are much smaller than in our fiducial case, we do not discuss this run further in this section.
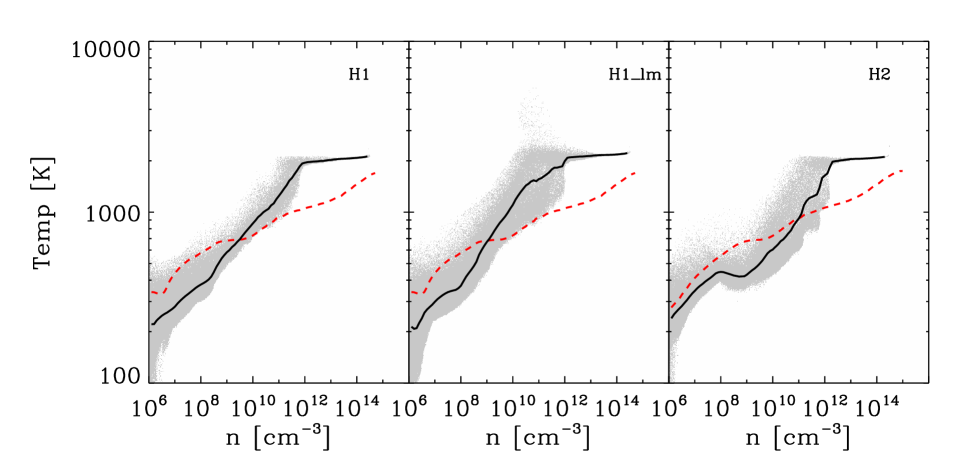
The main effect that DMA has on the density profile of the gas is the clear density enhancement at radii of 100–1000 AU. We also find that in the runs with DMA, the time taken for the gas to collapse to protostellar densities is shorter than in the reference runs (see Table 2). Both of these effects can be understood by an analysis of the temperature structure of the gas. In
we show how the temperature of the gas varies as a function of the gas number density. In the outer regions of the halo, the gas is cooler than in the reference case. At higher densities, however, there is a sharp rise in the gas temperature, taking it above the value in the reference case. Comparison of Figures 1 and 2 shows that the density at which this temperature increase occurs is the same as the density at which we first see the bump in the density profile.
|
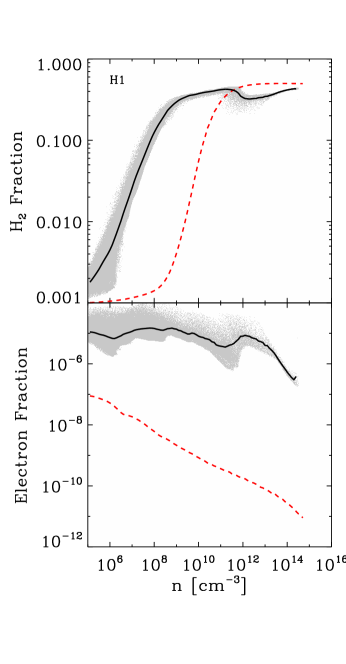
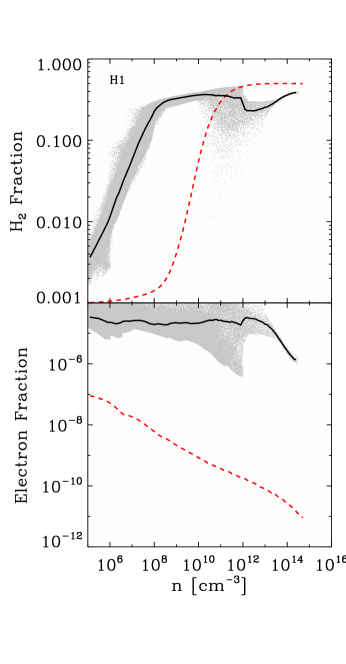
In Figure 5, we show how the fractional abundances222Note that these are defined here as the ratio of the number density of the species of interest to the number density of hydrogen nuclei. This means that gas in which all of the hydrogen is in molecular form has an H2 fractional abundance . of H2 and e- vary as a function of density within our different models. At low densities, DMA-induced ionisation enhances the number of electrons by two or more orders of magnitude. This increases the rate of H2 formation relative to the case without DMA by increasing the effectiveness of the following reaction chain:
| (16) | |||||
| (17) |
As H2 is the main coolant of the gas at these densities, the enhanced H2 abundance leads to more efficient cooling. We therefore find, counter-intuitively, that this lower density gas is cooler in the case with DMA than in the case without DMA. This is in agreement with the results of the 1D simulations of Ripamonti et al. (2010), and provides an explanation for the shorter collapse times of the halos in which DMA is occurring, as for the majority of its lifetime, the gas has less thermal support.
Once the gas reaches a density of around , however, the H2 fraction decreases sharply in the runs with DMA. By comparing this Figure with the temperature distribution shown in Figure 2, we see that this sharp decrease occurs once the gas temperature reaches K. It occurs because at this temperature, collisional dissociation of H2 by the reactions
| (18) | |||||
| (19) | |||||
| (20) |
and by the charge transfer reaction
| (21) |
becomes effective. The increased temperature leads to an increased thermal pressure, which slows the collapse of the gas at these densities and leads to a “pile-up” of material visible as a pronounced bump in the gas density profile. It is also clear from Figure 5 that not all of the H2 is destroyed at this density. The H2 that survives in the higher density gas enables it to dissipate much of the energy introduced into the gas by the DMA, and hence allows it to maintain its temperature at close to 2000 K. This allows gravitational collapse to continue past the point at which DMA heating first outstrips H2 cooling. We examine the physics of this in more detail in the next section.
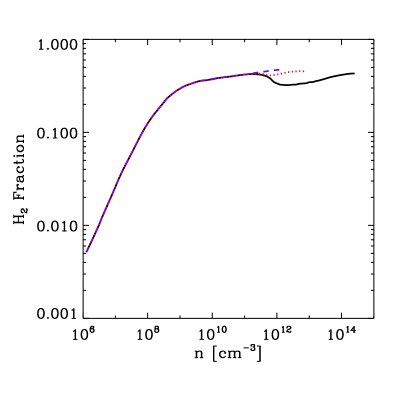
Finally, we note that one must take care in interpreting the behaviour of the H2 abundances shown in Figure 5. It is all too easy to think of the evolution of with density as a time history of the H2 abundance. In this picture, the H2 abundance first increases as the gas collapses, then sharply decreases once the number density reaches , before increasing once more at higher gas densities. However, this is incorrect, as Figure 6 demonstrates. The rise in the H2 abundance in the densest gas that we see if we look at a single snapshot is not due to the reformation of H2 in this gas. Instead, it occurs because the amount of H2 that the gas loses once it reaches a density of around increases as the collapse proceeds. The first gas to collapse – the material that is now at densities above – loses only a relatively small fraction of its H2, while the material falling in later loses much more of its molecular content. In part, this behaviour is due to an increase in the DM number density associated with the gas, caused by the increasing concentration of the halo. However, an additional contribution comes from the fact that gas falling in at later times will generally have a higher infall velocity, and hence will shock more strongly once it reaches this density.
4.2. Heating and cooling rates
4.2.1 Fiducial case
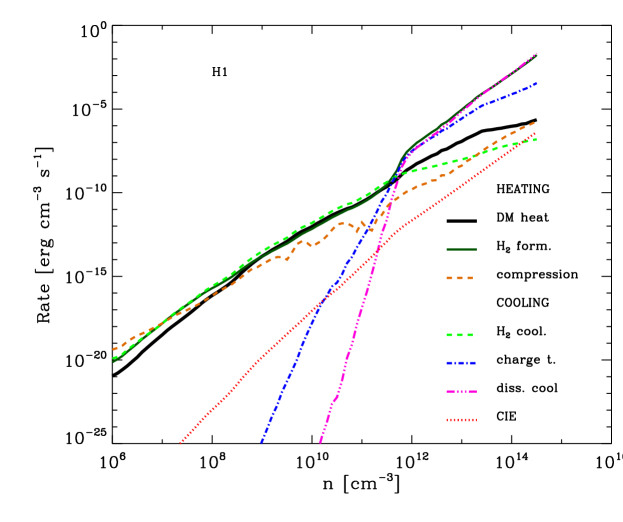
hows the main heating and cooling processes acting in run H1 shortly before the formation of the first protostar, at the time when the central number density first reached . At low densities, compressional heating and H2 formation heating are the two most important heat sources, although even at densities as low as , DMA heating is beginning to contribute to the total heating rate at the level of a few percent or more. The cooling of the gas at these densities is dominated by H2 line cooling. Once the gas density reaches , compressional heating starts to become unimportant, and DMA heating catches up with H2 formation heating, with both subsequently playing important roles in the thermal balance of the gas. The heating produced by these two processes raises the gas temperature, but this enables H2 line cooling to become more effective, and this is able to offset much of the additional heat input from the DMA at densities . Above this density, H2 line cooling becomes relatively ineffective, both because the H2 is starting to dissociate and also because the H2 emission lines become optically thick at high densities. The heating rate due to DMA therefore outstrips the H2 line cooling rate, in agreement with the prediction of Spolyar et al. (2008). However, we see from Figure 7 that this is not the whole story. As the temperature rises, H2 collisional dissociation (reactions 18–20) and the destruction of H2 by charge transfer with H+ (reaction 21) become increasingly effective. These reactions are endothermic, and hence remove thermal energy from the gas. If H2 subsequently reforms, then the associated H2 formation heating will return some of this energy to the gas, but if more H2 is destroyed than can reform, then the overall effect is to dissipate energy. This effect should not be regarded as “cooling” in the same sense as H2 line cooling or CIE cooling, as it will not bring about a decrease in the gas temperature. Instead, it acts more like a thermostat, preventing the temperature from increasing significantly until all of the H2 has been consumed.
The importance of this effect can be appreciated if we compare the time required to destroy all of the H2 at the centre of the halo with the free-fall collapse time of the gas. By considering the energy budget of the gas in this way we can obtain a rough estimate of whether collapse is likely to be halted at densities close to our resolution limit. From Figure 7, we see that at a density , the DMA heating rate per unit volume at the centre of the halo is roughly . If we take the H2 fractional abundance in this gas to be , which is a conservative estimate, then the total amount of energy per unit volume that can be dissipated by dissociating H2 is
| (22) | |||||
| (23) |
where is the binding energy of a single H2 molecule. The time required to destroy all of the H2 is therefore , or around 10 years. In comparison, the free-fall time of the gas at this density is around 2 years. The energy input from the DM therefore cannot destroy the H2 rapidly enough to prevent the gas from collapsing. At even higher densities, the DMA heating rate will be larger. However, the heating rate per unit volume within the core of the DM density profile scales with the central gas density as , and hence . In comparison, the free-fall timescale scales as . Therefore, a large increase in density is required in order to significantly alter the ratio of the H2 dissociation timescale to the free-fall timescale.
In reality collapse of the dense gas is likely to occur on a timescale that could be a factor of a few longer than the free fall timescale. However, even in this case the collapse timescale is shorter than the H2 dissociation timescale, and will remain so until the density increases significantly. It therefore seems unlikely that collapse will halt at a density just above our sink creation threshold, although we cannot say at exactly what point the collapse will halt without performing much higher resolution simulations.
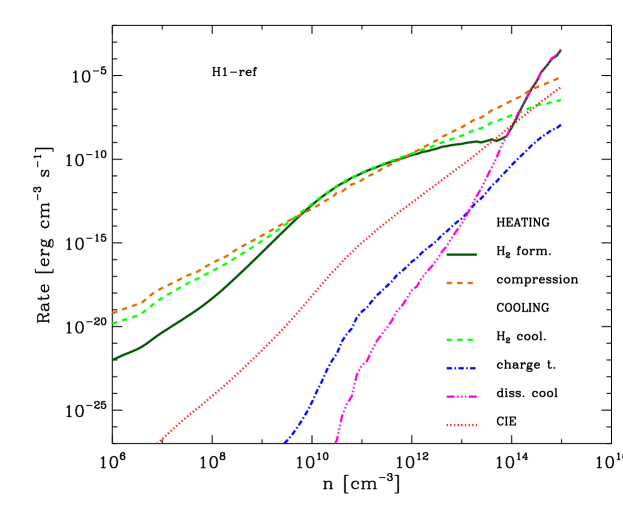
Figure 9 shows the main heating and cooling processes acting in the reference case, run H1-ref. In the absence of DMA heating, the main heating term is compressional heating over most of the range of densities examined, with H2 formation heating becoming important at densities between and , and at . The main source of cooling at is H2 line cooling, while at higher densities, H2 collisional dissociation plays an important role in regulating the temperature of the gas. This is in reasonable agreement with the results of other models; for instance, Yoshida et al. (2006) find that H2 dissociation becomes significant at densities of , at which point the gas temperature is roughly 2000 K. The main effect of the DMA heating seems to be simply to bring the gas to this state at an earlier point in its evolution.
4.2.2 Maximal Case
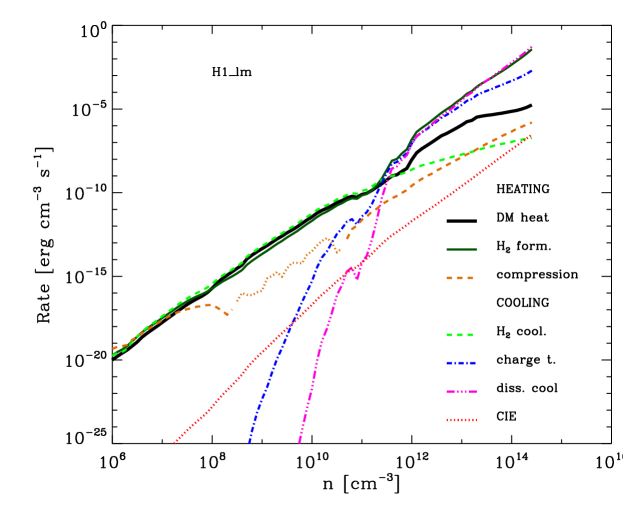
The previous analysis is for the fiducial case where the DM particle mass was 100 GeV. However, even in our maximal case, where the DM particle mass was 10 GeV, we find broadly similar behaviour. In Figure 12, we show the rates of the main heating and cooling processes in run H1-lm shortly before the formation of the first protostar. In this case, we see that DMA heating becomes important at an earlier time and that H2 dissociation becomes the dominant energy dissipation mechanism once the gas density reaches a lower density, , than in the fiducial model. This is consistent with the results plotted in Figure 2, which show that the gas reaches K slightly earlier in its evolution. However, the subsequent behaviour of the gas is very similar in both models. H2 dissociation is such an effective thermostat that an increase in the heating rate by a factor of ten produces only a small increase in the gas temperature. Repeating our previous analysis of the H2 dissociation timescale, we find that in this case , meaning that the gas will probably lose most of its H2 before it collapses to protostellar densities. It is therefore possible that in this extreme case, a “dark star” will form, but if so, then its size will be smaller than our minimum spatial resolution of a few AU. For comparison, Spolyar et al. (2008) predict that even in the 100 GeV case, a dark star of size AU should form, and expect that reducing the DM particle mass will lead to an even larger dark star. We find no evidence for such large DMA supported structures in our simulations.
5. Secondary Fragmentation
So far we have only considered the initial collapse of the halo to stellar densities. However, Stacy et al. (2010) and Clark et al. (2011b) have shown that the protostellar accretion disc that builds up around the first protostar rapidly becomes unstable and fragments. The natural implication is that the first stars to form were generally part of multiple systems, which has profound consequences for our understanding of primordial star formation. It raises the possibility of the first stars being ejected while they were still low mass (Greif et al., 2011) or growing in mass through mergers (Smith et al., 2012; Greif et al., 2012). Evolving close binary systems are also a potential mechanism for creating early gamma ray bursts (Bromm & Loeb, 2006). It is therefore important to discover whether primordial accretion discs are still unstable in the presence of DMA.
In order to enable us to follow the evolution of our simulated halos beyond the point at which the first protostar forms, we use a sink particle treatment, as outlined in Section 2.1. During the evolution of the halo with sink particles we fix the location of the DM peak to exactly coincide with the first sink formed. This mimics the effect of the DM being ‘locked in’ to the first star to form.
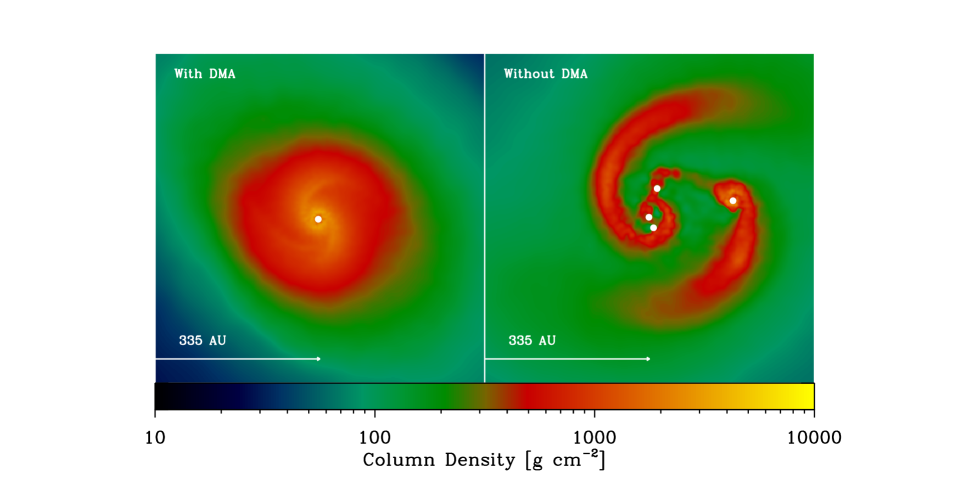
hows a comparison of the column density of the disc in run H1 and in the corresponding reference case without DMA, run H1-ref, at a time 500 years after the formation of the first protostar. In the reference case, the disc has already fragmented, forming four additional protostars. In the case with DMA heating, however, the disc has not fragmented. We continued run H1 until the primary mass reached , which occurred at a time years after the formation of the first protostar, but saw no disc fragmentation during the whole of this period. As our models do not include the effects of ionisation feedback from massive stars, we stopped our simulation at this point. However, we note that studies that have investigated the effect of this ionisation feedback find that it rapidly shuts off the supply of material to the disc, and hence will act to suppress fragmentation at later times (Stacy et al., 2012; Hosokawa et al., 2011).
An indication of disc stability is given by the Toomre Q parameter (Toomre, 1964), which has the form
| (24) |
,where is the sound speed, is the epicyclic frequency, and is the surface density of the disc. In the classical Toomre analysis, discs are stable if they have . Such an analysis is technically only valid when the disc mass is much smaller than that of the central protostar, and the disc is infinitely thin, neither of which are the case here. However, still proves to be a reliable guide as to whether or not the disc is stable, and helps to demonstrate why the inclusion of DMA heating has a large effect on the disc stability.
hows the radially averaged properties of the disc surrounding the central protostar for Halo 1. We plot three cases, the reference case without DMA (H1-ref), the fiducial case with DMA (H1), and the “minimal” case with a high DM particle mass (H1-hm). The comparison between the disc properties is made at a time of 217 yr after the first sink particle forms in each simulation. For the reference case, this corresponds to a time just before disc fragmentation. (The model of low DM mass, H1-lm, shall be discussed in more detail later.)

All of our discs rotate at a similar rate, for instance H1 has a mean radial velocity of 4.9 kms-1 in the gas denser than cm-3 and H1-ref has a mean radial velocity of 4.2 kms-1in the gas at this density. Consequently, the most relevant terms are the surface density of the disc and the sound speed.
hows that the surface density of the disc is not substantially changed by the DMA. However, the disc temperature is considerably increased in the DM case compared to the reference case. This raises the sound speed and causes the Q value to rise above 1 in the DM cases, whereas in the reference case it falls below one and the disc fragments.
lso shows the H2 fraction within the disc. In the reference case, the disc is fully molecular, but in the DM cases the disc is partially dissociated. As the disc evolves the H2 fraction further decreases until all the molecular gas is destroyed. After this point the energy can no longer be absorbed by the destruction of H2 and the temperature of the disc will rapidly rise. Thus it becomes increasingly difficult for the disc to fragment as it evolves, which explains why we see no fragmentation in run H1 despite running the simulation to a central primary mass of .
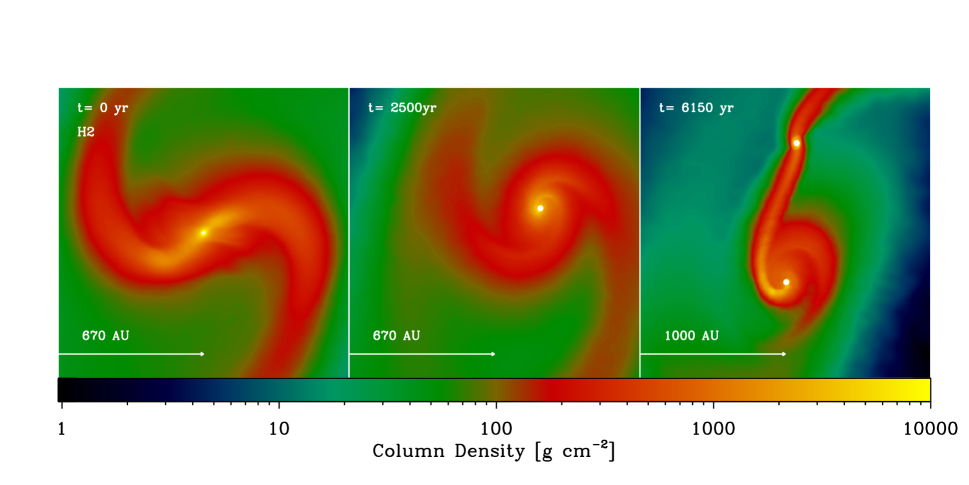
hows a column density projection for a slice through the centre of run H2 at three different output times. In this case, a second sink forms at large radii where the gas is cooler. The fragmentation in run H2 is substantially different from that seen in the reference model. Without DMA, a secondary sink forms within 155 years at a distance of 14.8 AU from the primary. This is followed by additional fragmentation such that when the simulation has run for a thousand years, there are 7 sinks. In contrast to this, the DM simulation does not form a secondary object until , and the fragmentation occurs at a distance of 1012 AU from the primary. The two stars then form a wide binary system.
| Simulation | Separation [AU] | Primary Mass [] |
|---|---|---|
| H1-ref | 31.7 | 1.63 |
| H1 | - | - |
| H1-lm | 1629 | 11.8 |
| H1-hm | - | - |
| H2-ref | 14.8 | 0.68 |
| H2 | 1012 | 10.3 |
Table 3 summarises the secondary fragmentation in all of our simulations. It is interesting that secondary fragmentation occurs in run H2 but not in run H1 for our fiducial DM mass case.
hows that in run H2, a larger bump forms in the density profile than in run H1. Similarly, there is also secondary fragmentation in H1-lm at distances of around a thousand AU where there was a significant enhancement in the density profile. At such large radii the gas is far enough away from the peak DM density that DMA cannot dissociate H2 and the gas remains fully molecular, allowing it to cool effectively. Runs H1-lm and H2 both had higher DMA levels than H1 and H1-hm and consequently a greater density enhancement outside the DM core. (Our normalisation of the DM in Halo 2 meant that the ratio of baryonic matter to DM was slightly lower in this case.) Consequently it can be concluded that DMA suppresses fragmentation in the disc close to the primary but it can actually encourage fragmentation in spiral arms at distances of a few thousand AU.
Another striking difference between the cases with and without DMA is the mass of the primary at the time that the disc first fragments. In the reference case, the primary is a low mass object which is evolving adiabatically. Its internal structure is that of an extended ball of gas (Omukai & Palla, 2003) and it will be prone to interactions with close neighbours. With DMA, however, the primary is around ten solar masses at the point of fragmentation, at which point it undergoes an expansion as it redistributes its internal entropy and will shortly thereafter begin contracting to the main sequence. The later evolutionary stage of the primary and greater distance from the secondary in the DMA case mean it is unlikely that the stars will influence each other significantly during their formation.
The left and middle panels of
re centred on the original position at which the sink particle is originally formed. It can be seen that there is some drift in the position of the sink after the first few thousand years. As our DM halo is analytic and cannot dynamically respond to the baryons we assume that the DM is locked into the first protostar and follows this centre as its position migrates. Similarly our idealised DM halo is oblivious to the formation of spiral arms in the baryonic component of the halo. It is conceivable that both the drift of the sink particle and the transfer of energy from the spiral arms to the DM distribution could heat the central DM distribution and somewhat decrease the DM central density. Studies with a highly resolved live DM halo and high resolution baryonic component would be needed to fully address this issue.
6. Discussion
6.1. Do dark stars form?
In their original study, Spolyar et al. (2008) made the simple assumption that the gravitational collapse of the gas would come to a halt as soon as the heating rate produced by DMA exceeded the H2 cooling rate. As a result, they predicted the formation of large ( AU or more) protostellar objects supported by DMA heating, the so-called “dark stars”. However, their assumption is incorrect. Ripamonti et al. (2010) first showed, using 1D spherically-symmetric models, that the collapse does not halt once the DM heating rate exceeds the H2 cooling rate, and in our present study we confirm their results. The key factor that allows collapse to continue is the collisional dissociation of H2. This acts as a thermostat, preventing the gas temperature from increasing significantly above 2000 K until all of the H2 is destroyed. A simple estimate of the timescale on which the H2 is destroyed shows that even in the most extreme case, it is comparable to the free-fall time of the gas, meaning that the gas can reach much higher densities (and hence smaller length scales) than anticipated in the Spolyar et al. (2008) study. As a result, we find no evidence for the formation of dark stars within our simulations, although we note that we cannot rule out the formation of such objects if they form above densities of cm-3, have initial masses of less than 0.01 M⊙ and radii of less than an AU, as this is below our resolution limit.
6.2. Stellar Multiplicity
Perhaps the most striking finding of our work is the large reduction of the level of fragmentation within the protostellar accretion disc. Of our four simulations with DM, secondary fragmentation occurred in only two cases and then only at large radii. Much of the recent focus of studies of Population III star formation has been on the fragmentation of protostellar discs (see e.g. Clark et al., 2011b; Greif et al., 2011; Smith et al., 2011). Greif et al. (2012) have shown that fragmentation occurs on scales of 10 AU or smaller, and that mergers between protostars should be common. The possibility of mergers and interactions between protostars was also highlighted by Smith et al. (2012), who show that the high accretion rates experienced by the young protostars lead to large, extended, “fluffy” objects that have a higher probability of interacting than more conventional protostars.
Such scenarios are far less likely when the effects of DMA are taken into account. In this picture either a single massive star forms at the centre of the halo, or a secondary forms in a wide binary with a separation of around 1,000 AU. Fragmentation on such scales was also seen by Stacy et al. (2010) in lower resolution studies which focussed on scales larger than the inner disc around the protostar. In our model, when secondary fragmentation begins the mass of the primary protostar is already greater than 10 solar masses. McKee & Tan (2008) find that for an accretion rate of M⊙ yr-1 an ionised HII region will form around the protostar after it obtains a mass of around 20 M⊙ , depending upon its rotation. Such an ionised region is likely to form even earlier in our model due to the additional ionisation of hydrogen from DMA. Thus it is possible that at the point when secondary stars form the original protostar will already be surrounded by an HII region and any further growth of the primary will be determined by the balance of radiative transfer effects. Hosokawa et al. (2012) find that UV radiation from primordial protostars would photo-evaporate their accretion discs once they achieved a mass of around 43 M⊙ . We note however that similar claims for present day high-mass star formation (Yorke & Sonnhalter, 2002) have not borne out in detailed 3D calculations (Krumholz et al., 2009; Peters et al., 2010; Kuiper et al., 2012).
6.3. Accuracy of DM model
The biggest assumption in our model is the adoption of an analytic DM halo rather than a live halo. No calculation has yet been able to fully follow the contraction and fragmentation of baryonic matter down to AU scales with a comparable resolution in DM. Simulations by Abel et al. (2002) followed the collapse of a minihalo with a mass resolution of 1.1 M⊙ for the DM component and confirmed that the DM had a peaked profile to radii as small as AU. Previous work by Ripamonti et al. (2010) and Spolyar et al. (2008) adopt the method proposed by Blumenthal et al. (1986) to model the contraction of a DM halo due to baryonic collapse, and upon these results we base our DM profile. In the Appendix of Ripamonti et al. (2010), the applicability of this method is discussed and found to be in better agreement with the current numerical findings than alternative models Steigman et al. (e.g. 1978). We are therefore confident that our model for increasing the DM density with increasing baryon density is reasonable. If anything such a profile may give a slight overestimate of DM density at the centre of the halo. This would further reduce the effective of DMA heating, and make it even less likely that any “dark stars” are formed.
A bigger potential uncertainty in our adopted DM profile, however, is the assumption of spherical symmetry. Before the formation of the first sink particle this is a reasonable simplification, as the baryon profile itself is smooth and centrally concentrated. However, after the first sink particle is formed, this rapidly changes within the central regions of the halo. A disc quickly develops, and strong spiral arm features develop within the disc. It is possible that interactions between these high asymmetric features and inhomogeneities in the DM density distribution could lead to a transfer of energy to the DM component and a flattening of the central DM distribution, in a similar manner to that thought to occur from a rotating bar in disc galaxies (Weinberg & Katz, 2002). To fully resolve these issues, calculations with a live three-dimensional halo component would be needed.
Another important issue is whether the central protostar remains within the centre of the DM distribution, as this affects the amount of DM that can be captured by the protostar by particle scattering, which strongly influences the lifetime of any dark star phase (Iocco et al., 2008; Taoso et al., 2008a; Yoon et al., 2008). In our calculations, we find that the central protostar moves by a significant amount after its formation, as a result of the fact that accretion onto the protostar does not occur in a perfectly symmetrical fashion, and also because it is being acted on by torques from the asymmetrical gas distribution in the protostellar accretion disc. We have assumed that the DM responds in a similar fashion, and that the peak in the DM distribution follows the central protostar. However, if an offset were to develop between the DM cusp and the baryon peak, dynamical heating of the DM would occur and the resulting reduction in the DM density would reduce the amount of annihilation.
This issue has been addressed recently by Stacy et al. (2012), who performed a calculation in which they re-simulated the inner regions of a halo with a live DM halo of similar resolution to that of the gas after the formation of an initial sink particle. The effects of DMA were not, however, included. They formed additional sink particles at around 1,000 AU and found that the motion of the star-disc system became displaced from the DM density peak and that after 5,000 yr there was insufficient DM to influence the formation and evolution of the protostars. However, Stacy et al. (2012) do not resolve protostar formation in the inner disc around the central object and do not include DMA and so cannot comment on fragmentation in this regime. In our runs without DMA, secondary fragmentation occurred on timescales of only a few hundred years. It is therefore likely that there will be sufficient DM during the period in which the inner disc is prone to fragmentation to maintain the findings of this paper.
7. Conclusions
We have for the first time included the effects of dark matter annihilation into 3D simulations of the collapse and fragmentation of cosmological minihalos. We used the SPH code gadget 2, which has been modified to include a time-dependent chemical network which includes the effects of dark matter annihilations. The dark matter distribution was modelled analytically based on the predictions of adiabatic contraction (Blumenthal et al., 1986) and the results of Spolyar et al. (2008) and Ripamonti et al. (2010). We adopted a fiducial dark matter particle mass of 100 GeV but also ran simulations with particles masses an order of magnitude larger and smaller to account for uncertainties in our knowledge of the true dark matter particle mass and annihilation cross-section.
Our main findings are as follows:
-
1.
Dark matter annihilation does not halt the gravitational collapse of the gas on the scales considered here, contrary to the suggestion made by Spolyar et al. (2008). The reason for this is that collisional dissociation of H2 provides an effective way to dissipate large amounts of energy even in the regime where H2 line cooling is ineffective, and hence prevents the gas temperature from increasing much above 2000 K. The timescale for H2 destruction is typically longer than the free-fall time of the gas, even at high gas densities, and so the central protostar should be able to reach very high densities. This is true even when a dark matter particle mass of only 10 GeV is adopted, which gives a maximal effect for dark matter annihilation. It is therefore plausible that a conventional star will form, rather than a “dark star”, although confirmation of this point awaits a simulation able to follow the collapse of the gas all the way up to protostellar densities.
-
2.
Dark matter annihilation prevents subsequent fragmentation in the disc around the central protostar within a radius 1,000 AU, regardless of whether this central object is a “dark star” or a normal protostar. This is primarily due to the dark matter annihilation heating raising the temperature of the dense gas to a level at which the protostellar accretion disc becomes stable. Over time, dark matter annihilation will destroy all of the H2 within the vicinity of the central protostar, making further fragmentation impossible. At distances larger than around 1,000 AU, however, the effects of dark matter annihilation are less pronounced and fragmentation can occur in some cases, typically resulting in the formation of a wide binary system.
Acknowledgements
We gratefully acknowledge Thomas Greif for providing the initial conditions used for this work. R.J.S, DRGS and R.S.K. acknowledge support from the DFG via the SPP 1573 Physics of the ISM (grants SM321/1-1, KL 1358/14-1 & SCHL 1964/1-1). R.J.S. and R.S.K. also acknowledges the support of the Landesstiftung Baden-Württemberg under research contract P-LS-SPll/18 (Internationale Spitzenforschung ll) and the SFB 881 The Milky Way System subprojects B1, B2 and B4. DRGS thanks for funding via the SFB 963/1 ”Astrophysical Flow Instabilities and Turbulence”.
References
- Abel et al. (2000) Abel, T., Bryan, G. L., & Norman, M. L. 2000, ApJ, 540, 39
- Abel et al. (2002) —. 2002, Science, 295, 93
- Ackermann et al. (2011) Ackermann, M. et al. 2011, Phys. Rev. Lett., 107, 241302
- Ascasibar. (2007) Ascasibar., Y. 2007, A&A, 462, 65
- Bate et al. (1995) Bate, M. R., Bonnell, I. A., & Price, N. M. 1995, MNRAS, 277, 362
- Bate & Burkert (1997) Bate, M. R. & Burkert, A. 1997, MNRAS, 288, 1060
- Bertone et al. (2005) Bertone, G., Hooper, D., & Silk, J. 2005, Phys. Rep., 405, 279
- Blumenthal et al. (1986) Blumenthal, G. R., Faber, S. M., Flores, R., & Primack, J. R. 1986, ApJ, 301, 27
- Bromm & Loeb (2006) Bromm, V. & Loeb, A. 2006, ApJ, 642, 382
- Clark et al. (2008) Clark, P. C., Glover, S. C. O., & Klessen, R. S. 2008, ApJ, 672, 757
- Clark et al. (2011a) Clark, P. C., Glover, S. C. O., Klessen, R. S., & Bromm, V. 2011a, ApJ, 727, 110
- Clark et al. (2011b) Clark, P. C., Glover, S. C. O., Smith, R. J., Greif, T. H., Klessen, R. S., & Bromm, V. 2011b, Science, 331, 1040
- Dopcke et al. (2012) Dopcke, G., Glover, S. C. O., Clark, P. C., & Klessen, R. S. 2012, arXiv:1203.6842
- Fargion et al. (1995) Fargion, D., Khlopov, M. Y., Konoplich, R. V., & Mignani, R. 1995, Phys. Rev. D, 52, 1828
- Federrath et al. (2010) Federrath, C., Banerjee, R., Clark, P. C., & Klessen, R. S. 2010, ApJ, 713, 269
- Freese et al. (2008) Freese, K., Bodenheimer, P., Spolyar, D., & Gondolo, P. 2008, ApJL, 685, L101
- Galli et al. (2011) Galli, S., Iocco, F., Bertone, G., & Melchiorri, A. 2011, Phys. Rev. D, 84, 027302
- Gao et al. (2007) Gao, L., Yoshida, N., Abel, T., Frenk, C. S., Jenkins, A., & Springel, V. 2007, MNRAS, 378, 449
- Glover (2005) Glover, S. 2005, Space Sci. Rev., 117, 445
- Glover (2008) Glover, S. 2008, in American Institute of Physics Conference Series, Vol. 990, First Stars III, ed. B. W. O’Shea & A. Heger, 25–29
- Glover & Abel (2008) Glover, S. C. O. & Abel, T. 2008, MNRAS, 388, 1627
- Glover & Mac Low (2007) Glover, S. C. O. & Mac Low, M. 2007, ApJS, 169, 239
- Greif et al. (2011) Greif, T., Springel, V., White, S., Glover, S., Clark, P., Smith, R., Klessen, R., & Bromm, V. 2011, ApJ, 737, 75
- Greif et al. (2012) Greif, T. H., Bromm, V., Clark, P. C., Glover, S. C. O., Smith, R. J., Klessen, R. S., Yoshida, N., & Springel, V. 2012, MNRAS, 424
- Hirano et al. (2011) Hirano, S., Umeda, H., & Yoshida, N. 2011, ApJ, 736, 58
- Hosokawa et al. (2012) Hosokawa, T., Omukai, K., & Yorke, H. W. 2012, ArXiv e-prints
- Hosokawa et al. (2011) Hosokawa, T., Omukai, K., Yoshida, N., & Yorke, H. W. 2011, Science, 334, 1250
- Iocco (2008) Iocco, F. 2008, ApJ, 677, L1
- Iocco et al. (2008) Iocco, F., Bressan, A., Ripamonti, E., Schneider, R., Ferrara, A., et al. 2008, MNRAS, 390, 1655
- Jappsen et al. (2005) Jappsen, A.-K., Klessen, R. S., Larson, R. B., Li, Y., & Mac Low, M.-M. 2005, A&A, 435, 611
- Krumholz et al. (2009) Krumholz, M. R., Klein, R. I., McKee, C. F., Offner, S. S. R., & Cunningham, A. J. 2009, Science, 323, 754
- Kuiper et al. (2012) Kuiper, R., Klahr, H., Beuther, H., & Henning, T. 2012, A&A, 537, A122
- McKee & Tan (2008) McKee, C. F. & Tan, J. C. 2008, ApJ, 681, 771
- Omukai & Palla (2003) Omukai, K. & Palla, F. 2003, ApJ, 589, 677
- Omukai et al. (2005) Omukai, K., Tsuribe, T., Schneider, R., & Ferrara, A. 2005, ApJ, 626, 627
- Peters et al. (2010) Peters, T., Banerjee, R., Klessen, R. S., Mac Low, M., Galván-Madrid, R., & Keto, E. R. 2010, ApJ, 711, 1017
- Ripamonti & Abel (2004) Ripamonti, E. & Abel, T. 2004, MNRAS, 348, 1019
- Ripamonti et al. (2010) Ripamonti, E., Iocco, F., Ferrara, A., Schneider, R., Bressan, A., & Marigo, P. 2010, MNRAS, 406, 2605
- Ripamonti et al. (2007) Ripamonti, E., Mapelli, M., & Ferrara, A. 2007, MNRAS, 375, 1399
- Schleicher et al. (2008) Schleicher, D. R. G., Banerjee, R., & Klessen, R. S. 2008, Phys. Rev. D, 78, 083005
- Schleicher et al. (2009a) —. 2009a, Phys. Rev. D, 79, 043510
- Schleicher et al. (2009b) Schleicher, D. R. G., Glover, S. C. O., Banerjee, R., & Klessen, R. S. 2009b, Phys. Rev. D, 79, 023515
- Scott et al. (2011) Scott, P., Venkatesan, A., Roebber, E., Gondolo, P., Pierpaoli, E., & Holder, G. 2011, ApJ, 742, 129
- Sivertsson & Gondolo (2011) Sivertsson, S. & Gondolo, P. 2011, ApJ, 729, 51
- Smith et al. (2011) Smith, R. J., Glover, S. C. O., Clark, P. C., Greif, T., & Klessen, R. S. 2011, MNRAS, 414, 3633
- Smith et al. (2012) Smith, R. J., Hosokawa, T., Omukai, K., Glover, S. C. O., & Klessen, R. S. 2012, MNRAS, 424, 457
- Spolyar et al. (2009) Spolyar, D., Bodenheimer, P., Freese, K., & Gondolo, P. 2009, ApJ, 705, 1031
- Spolyar et al. (2008) Spolyar, D., Freese, K., & Gondolo, P. 2008, Phys. Rev. Lett., 100, 051101
- Springel (2005) Springel, V. 2005, MNRAS, 364, 1105
- Springel (2010) —. 2010, MNRAS, 401, 791
- Stacy et al. (2010) Stacy, A., Greif, T. H., & Bromm, V. 2010, MNRAS, 403, 45
- Stacy et al. (2012) Stacy, A., Pawlik, A. H., Bromm, V., & Loeb, A. 2012, MNRAS, 421, 894
- Steigman et al. (1978) Steigman, G., Sarazin, C. L., Quintana, H., & Faulkner, J. 1978, AJ, 83, 1050
- Taoso et al. (2008a) Taoso, M., Bertone, G., & Masiero, A. 2008a, JCAP, 0803, 022
- Taoso et al. (2008b) Taoso, M., Bertone, G., Meynet, G., & Ekstrom, S. 2008b, Phys. Rev. D., 78, 123510
- Toomre (1964) Toomre, A. 1964, ApJ, 139, 1217
- Turk et al. (2009) Turk, M. J., Abel, T., & O’Shea, B. 2009, Science, 325, 601
- Turk et al. (2011) Turk, M. J., Clark, P., Glover, S. C. O., Greif, T. H., Abel, T., Klessen, R., & Bromm, V. 2011, ApJ, 726, 55
- Valdés & Ferrara (2008) Valdés, M. & Ferrara, A. 2008, MNRAS, 387, L8
- Weinberg & Katz (2002) Weinberg, M. D. & Katz, N. 2002, ApJ, 580, 627
- Yoon et al. (2008) Yoon, S.-C., Iocco, F., & Akiyama, S. 2008, ApJ, 688, L1
- Yorke & Sonnhalter (2002) Yorke, H. W. & Sonnhalter, C. 2002, ApJ, 569, 846
- Yoshida et al. (2008) Yoshida, N., Omukai, K., & Hernquist, L. 2008, Science, 321, 669
- Yoshida et al. (2006) Yoshida, N., Omukai, K., Hernquist, L., & Abel, T. 2006, ApJ, 652, 6
- Zackrisson et al. (2010) Zackrisson, E., Scott, P., Rydberg, C.-E., Iocco, F., Edvardsson, B., et al. 2010, ApJ, 717, 257
- Zackrisson et al. (2010) Zackrisson, E., Scott, P., Rydberg, C.-E., Iocco, F., Sivertsson, S., Östlin, G., Mellema, G., Iliev, I. T., & Shapiro, P. R. 2010, MNRAS, 407, L74