The Properties of the Star-Forming Interstellar Medium at = 0.8–2.2 from HiZELS: Star-Formation and Clump Scaling Laws in Gas Rich, Turbulent Disks
Abstract
We present adaptive optics assisted integral field spectroscopy of nine H-selected galaxies at = 0.84–2.23 drawn from the HiZELS narrow-band survey. Our observations map the kinematics of these star-forming galaxies on kpc-scales. We demonstrate that within the ISM of these galaxies, the velocity dispersion of the star-forming gas () follows a scaling relation + (where is the star formation surface density and the constant includes the stellar surface density). Assuming the disks are marginally stable (Toomre = 1), this follows from the Kennicutt-Schmidt relation ( = ), and we derive best fit parameters of = 1.34 0.15 and = 3.4 10-4 M⊙ yr-1 kpc-2, consistent with the local relation, and implying cold molecular gas masses of Mgas = 109-10 M⊙ and molecular gas fractions Mgas / (Mgas + M⋆) = 0.3 0.1, with a range of 10 – 75%. We also identify eleven kpc-scale star-forming regions (clumps) within our sample and show that their sizes are comparable to the wavelength of the fastest growing mode. The luminosities and velocity dispersions of these clumps follow the same scaling relations as local Hii regions, although their star formation densities are a factor 15 5 higher than typically found locally. We discuss how the clump properties are related to the disk, and show that their high masses and luminosities are a consequence of the high disk surface density.
Subject headings:
galaxies: starburst, galaxies: evolution, galaxies: high-redshift1. Introduction
The majority of the stars in the most massive galaxies (M 1011 M⊙) formed around 8 – 10 billion years ago, an epoch when star formation was at its peak (Hopkins & Beacom, 2006; Sobral et al., 2012b). Galaxies at this epoch appear to be gas-rich ( = 20 – 80%; Tacconi et al. 2010; Daddi et al. 2010; Geach et al. 2011) and turbulent (Lehnert et al., 2009), with high velocity dispersions given their rotational velocities ( = 30 – 100 km s-1, / 0.2 – 1; e.g. Förster Schreiber et al. 2009; Genzel et al. 2008; Wisnioski et al. 2011; Bothwell et al. 2012). Within the dense and highly pressurised inter-stellar medium (ISM) of these high-redshift galaxies, it has been suggestes that star formation may be triggered by fragmentation of dynamically unstable gas (in contrast to star-formation occurring in giant molecular clouds in the Milky-Way which continually condense from a stable disk and then dissipate). This process may lead to the to the formation of massive ( 108-9 M⊙) star-forming regions (e.g. Elmegreen et al., 2007; Bournaud & Elmegreen, 2009) and give rise to the the clumpy morphologies that are often seen in high-redshift starbursts (Elmegreen et al., 2009).
In order to explain the ubiquity of “clumpy” disks seen in images of high-redshift galaxies, numerical simulations have also suggested that most massive, star-forming galaxies at = 1 – 3 continually accrete gas from the inter-galactic medium along cold and clumpy streams from the cosmic web (Kereš et al., 2005; Dekel et al., 2009; Bournaud & Elmegreen, 2009; van de Voort et al., 2011). This mode of accretion is at its most efficient at 1 – 2, and offers a natural route for maintaining the high gas surface densities, star formation rates and clumpy morphologies of galaxies at these epochs. In such models, the gas disks fragment into a few bound clumps which are a factor 10 – 100 more massive than star-forming complexes in local galaxies. The gravitational release of energy as the most massive clumps form, torques between in-spiraling clumps and energy injection from star formation are all likely to contribute to maintaining the high turbulence velocity dispersion of the inter-stellar medium (ISM) (e.g. Bournaud & Elmegreen, 2009; Lehnert et al., 2009; Genzel et al., 2008, 2011).
In order to refine or refute these models, the observational challenge is now to quantitatively measure the internal properties of high-redshift galaxies, such as their cold molecular gas mass and surface density, disk scaling relations, chemical make up, and distribution and intensity of star formation. Indeed, constraining the evolution of the star formation and gas scaling relations with redshift, stellar mass and/or gas fraction are required in order to understand star formation throughout the Universe. In particular, such observations are vital to determine if the prescriptions for star formation which have been developed at = 0 can be applied to the rapidly evolving ISM of gas-rich, high-redshift galaxies (Krumholz & Dekel, 2010; Hopkins, 2012).
To gain a census of the dominant route by which galaxies assemble the bulk of their stellar mass within a well selected sample of high-redshift galaxies, we have conducted a wide field (several degree-scale) near-infrared narrow-band survey (the High-Z Emission Line Survey; HiZELS) which targets H emitting galaxies in four precise ( = 0.03) redshift slices: = 0.40, 0.84, 1.47 and 2.23 (Geach et al., 2008; Sobral et al., 2009, 2010, 2011, 2012a, 2012b). This survey provides a large, star formation limited sample of identically selected H emitters with properties “typical” of galaxies which will likely evolve into L⋆ galaxies by = 0, but seen at a time when they are assembling the bulk of their stellar mass, and thus at a critical stage in their evolutionary history. Moreover, since HiZELS was carried out in the best-studied extra-galactic survey fields, there is a wealth of multi-wavelength data, including 16 – 36 medium and broad-band photometry (from rest-frame UV – mid-infrared wavelengths allowing robust stellar masses to be derived), Herschel 250 – 500m imaging (allowing bolometric luminosities and star formation rates to be derived) as well as high-resolution morphologies for a subset from the Hubble Space Telescope CANDELS and COSMOS ACS surveys.
In this paper, we present adaptive optics assisted integral field spectroscopy of nine star-forming galaxies selected from HiZELS. The galaxies studied here have H-derived star formation rates of 1 – 27 M⊙ yr-1 and will likely evolve into L⋆ galaxies by = 0. They are therefore representative of the high-redshift star-forming population. We use the data to explore the scaling relations between the star formation distribution intensity and gas dynamics within the ISM, as well as the properties of the largest star-forming regions. We adopt a cosmology with = 0.73, = 0.27, and H0 = 72 km s-1 Mpc-1 in which 0.12′′ corresponds to a physical scale of 0.8 kpc at = 1.47, the median redshift of our survey. All quoted magnitudes are on the AB system. For all of the star formation rates and stellar mass estimates, we use a Chabrier (2003) initial mass function (IMF).
2. Observations
Details of the target selection, observations and data-reduction are given in Swinbank et al. (2012). Briefly, we selected nine galaxies from HiZELS with H fluxes 0.7 – 1.6 10-16 erg s-1 cm-2 (star formation rates111Adopting SFRHa = 4.6 10-42 L(H) (erg s-1)of SFRHα = 1 – 27 M⊙ yr-1) which lie within 30′′ of bright (R 15) stars. We performed natural guide star adaptive optics (AO) observations with the SINFONI IFU between 2009 September and 2011 April in 0.6′′ seeing and photometric conditions with exposure times between 3.6 to 13.4 ks. At the three redshift slices of our targets, = 0.84[2], = 1.47[6] and = 2.23[1], the H emission line is redshifted to 1.21, 1.61 and 2.12m (i.e. into the , and -bands respectively). The median strehl achieved for our observations is 20% and the median encircled energy within 0.1′′ (the approximate spatial resolution of our observations) is 25%.
The data were reduced using the SINFONI esorex data reduction pipeline which extracts, flat-fields, wavelength calibrates and forms the data-cube for each exposure. The final (stacked) data-cube for each galaxy was generated by aligning the individual data-cubes and then combining them using an average with a 3- clip to reject cosmic rays. For flux calibration, standard stars were observed each night either immediately before or after the science exposures and were reduced in an identical manner to the science observations.
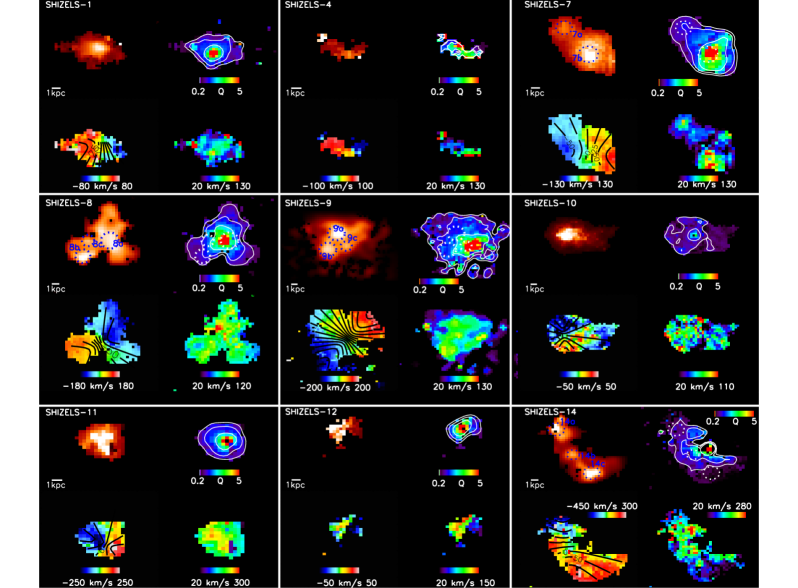
As Fig. 1 shows, all nine galaxies in our SINFONI-HiZELS survey (SHiZELS) display strong H emission, with luminosities of L 1041.4-42.4 erg s-1. Fitting the H and [Nii]6548,6583 emission lines pixel-by-pixel using a minimisation procedure we construct intensity, velocity and velocity dispersion maps of our sample and show these in Fig. 1 (see also Swinbank et al. 2012 for details).
3. Analysis & Discussion
3.1. Galaxy Dynamics and Star Formation
As Swinbank et al. (2012) demonstrate, the ratio of dynamical-to-dispersion support for this sample is sin() / = 0.3 – 3, with a median of 1.1 0.3, which is consistent with similar measurements for both AO and non-AO studies of star-forming galaxies at this epoch (e.g. Förster Schreiber et al., 2009). The velocity fields and low kinemetry values of the SHiZELS galaxies (total velocity asymmetry, Ktot = 0.2 – 0.5) also suggest that at least six galaxies (SHiZELS 1, 7, 8, 9, 10, & 11) have dynamics consistent with large, rotating disks, although all display small-scale deviations from the best-fit dynamical model, with data model = 3010 km s-1, with a range from data model = 15 – 70 km s-1 (Swinbank et al., 2012).
We also use the multi-wavelength imaging to calculate the rest-frame SEDs of the galaxies in our sample and so derive the stellar mass, reddenning and estimates of the star-formation history (Sobral et al., 2011). From the broad-band SEDs (Fig. 1 of Swinbank et al. 2012), the average E(B V) for our sample is E(B V) = 0.28 0.10 which corresponds to Av = 1.110.27 mag and indicates AHα = 0.91 0.21 mag. The resulting dust-corrected H star formation rate for the sample is SFRHα = 16 5 M⊙ yr-1, which is consistent with that inferred from the far-infrared SEDs using stacked Herschel SPIRE observations222Adopting SFRFIR = 2.7 10-44 LFIR (erg s-1)(SFRFIR = 18 8 M⊙ yr-1; Swinbank et al. 2012)
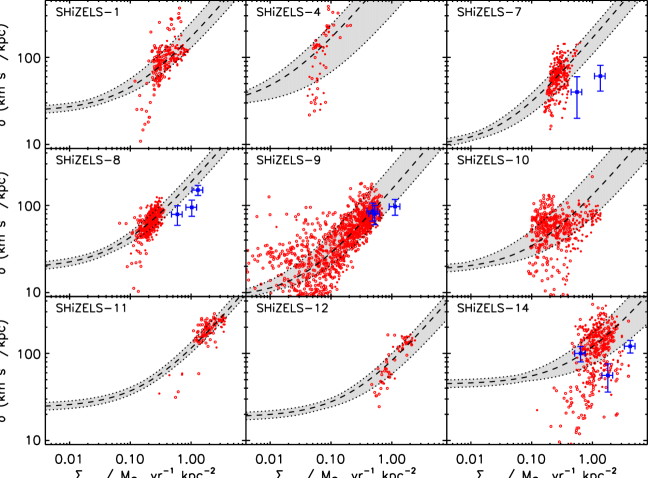
Next, to investigate the star formation occurring within the ISM of each galaxy, we measure the star formation surface density and velocity dispersion of each pixel in the maps. Since we do not have spatially resolved reddening maps, for each galaxy we simply correct the star formation rate in each pixel using the best-fit E(B V) for that system. We also remove the rotational contribution to the line width at each pixel by calculating the local V / R across the point spread function (PSF) for each pixel (Davies et al., 2011). In Fig. 2 we plot the resulting line of sight velocity dispersion () as a function of star formation surface density () for each galaxy in our sample. We see that there appears to be a correlation between and , and as Krumholz & Dekel (2010) show, this power-law correlation may be a natural consequence of the gas and star formation surface density scaling laws. For example, first consider the Toomre stability criterion, , (Toomre, 1964).
| (1) |
where denotes the line of sight velocity dispersion, is the average surface density of the disk, = / where is the rotational velocity of the disk, is the disk radius and = for a flat rotation curve. Galaxy whose disks have 1 are unstable to local gravitational collapse and will fragment into clumps, whereas those with 1 have sufficient rotational support for the gas to withstand and collapse. As Hopkins (2012) (e.g. see also Cacciato et al., 2012) point out, gas-rich galaxies are usually driven to 1 since regions with 1 begin forming stars, leading to super-linear feedback which eventually arrests further collapse due to energy/momentum injection (recovering 1). For galaxies with 1, there is no collapse, no dense regions form and hence no star formation (and so such galaxies would not be selected as star-forming systems).
Following Rafikov (2001), and focusing on the largest unstable fluctuations, the appropriate combination of gas and stellar surface density ( and respectively) is
| (2) |
where = / is the ratio of the velocity dispersion of the stellar component to that of the gas (see also the discussion in Romeo & Wiegert 2011)..
Next, Kennicutt (1998b) show that the gas and star formation surface densities follow a scaling relation
| (3) |
For local, star-forming galaxies, the exponent, and the absolute star formation efficiency, = 1.5 0.4 10-4 (Kennicutt, 1998a) implying an efficiency for star formation per unit mass of 0.04 which holds across at least four orders of magnitude in gas surface density.
Combining these relations, the velocity dispersion, , should therefore scale as
| (4) |
where and are measured in M⊙ yr-1 and M⊙ kpc-2 respectively, is in kpc, in km s-1, and = 4.302 10-6 kpc M (km s-1)2. With a power law index of = 1.4, and a marginally stable disk ( = 1), for each galaxy we therefore expect a power law relation + (Krumholz et al., 2012).
Table 1: Targets & Galaxy Properties
| ID | RA | Dec | SFR | E (B V) | () | () | ||||
|---|---|---|---|---|---|---|---|---|---|---|
| (J2000) | (J2000) | (M⊙/yr) | (kpc) | (km s-1) | (km s-1) | |||||
| SHiZELS-1 | 02 18 26.3 | 04 47 01.6 | 0.8425 | 2 | 1.8 0.3 | 9815 | 11211 | 0.4 0.1 | 10.03 0.15 | 9.4 0.4 |
| SHiZELS-4 | 10 01 55.3 | 02 14 02.6 | 0.8317 | 1 | 1.4 0.5 | 7720 | … | 0.0 0.2 | 9.74 0.12 | 8.9 0.4 |
| SHiZELS-7 | 02 17 00.4 | 05 01 50.8 | 1.4550 | 8 | 3.7 0.2 | 7511 | 14510 | 0.2 0.2 | 9.81 0.28 | 9.8 0.4 |
| SHiZELS-8 | 02 18 21.0 | 05 19 07.8 | 1.4608 | 7 | 3.1 0.3 | 6910 | 16012 | 0.2 0.2 | 10.32 0.28 | 9.8 0.4 |
| SHiZELS-9 | 02 17 13.0 | 04 54 40.7 | 1.4625 | 6 | 4.1 0.2 | 6211 | 19020 | 0.2 0.2 | 10.08 0.28 | 9.8 0.4 |
| SHiZELS-10 | 02 17 39.0 | 04 44 43.1 | 1.4471 | 10 | 2.3 0.2 | 648 | 3012 | 0.3 0.2 | 9.42 0.33 | 9.9 0.4 |
| SHiZELS-11 | 02 18 21.2 | 05 02 48.9 | 1.4858 | 8 | 1.3 0.4 | 19018 | 22415 | 0.5 0.2 | 11.01 0.24 | 10.1 0.4 |
| SHiZELS-12 | 02 19 01.4 | 04 58 14.6 | 1.4676 | 5 | 0.9 0.5 | 11510 | … | 0.3 0.2 | 10.59 0.30 | 9.6 0.4 |
| SHiZELS-14 | 10 00 51.6 | +02:33 34.5 | 2.2418 | 27 | 4.6 0.4 | 13117 | … | 0.4 0.1 | 10.90 0.20 | 10.1 0.4 |
| Median | … | … | 1.46 | 7 2 | 2.4 0.7 | 7519 | 14731 | 0.3 0.1 | 10.25 0.50 | 9.8 0.2 |
Notes: a H star formation rate using the calibration from Kennicutt (1998a) with a Chabrier IMF; SFRHα = 4.6 10-42 LHα. b H half light radius, deconvolved for the PSF. cAverage velocity dispersion for each galaxy, corrected for beam-smearing due to the PSF. d denotes the best-fit asymptotic rotation speed of the galaxy, and is corrected for inclination (see Swinbank et al. 2012 for details on the kinematic modeling of these galaxies).
In order to test whether this model provides an adequate description of our data, we fit the – distribution for each galaxy in our sample. To estimate the stellar surface density, , we we follow Sobral et al. (2011) and perform a full SED fit of the rest-frame UV – mid-infrared photometry using the Bruzual & Charlot (2003) and Bruzual (2007) population synthesis models. We use photometry from up to 36 (COSMOS) and 16 (UDS) wide, medium and narrow bands (spanning GALEX far-UV and near-UV bands to Spitzer/IRAC) and calculate the rest-frame spectral energy distribution, reddening, star-formation history and stellar mass (Sobral et al., 2010). The stellar masses of these galaxies range from 109.7-11.0 M⊙ (Table 1; see also Swinbank et al. 2012).
Since the stellar masses are calculated from 2′′ aperture photometry (and then corrected to total magnitudes using aperture corrections, Sobral et al. 2010), to estimate the stellar surface density in the same area as our IFU observations, we assume that stellar light follows an exponential profile with Sersic index, nserc = 1 – 2 and calculate the fraction of the total stellar mass within the disk radius, (which we define as two times the H half light radius, ). Allowing a range of power-law index from = 1.0 – 1.8 and a ratio of stellar- to gas- velocity dispersion of = 1 – 2 (Korchagin et al., 2003), we calculate the best-fit absolute star formation efficiency, and in Fig. 2 we overlay the best-fit solutions. Over the range = 1.0 – 1.8, the best fit absolute star formation efficiency for the sample is = (4.1 2.4) 10-4 M⊙ yr-1 kpc-2 (where the error-bar incorporates the galaxy-to-galaxy variation, a range of = 1 – 2, and the errors on the stellar masses of each galaxy). We note that at low star formation rates and stellar masses, there is a non-zero velocity dispersion due to the sound speed () of the gas ( 10 km s-1 for the Milky Way at the solar circle) which we have neglected since this is below both the resolution limit of our observations and the minimum velocity dispersion caused the stellar disks in these systems.
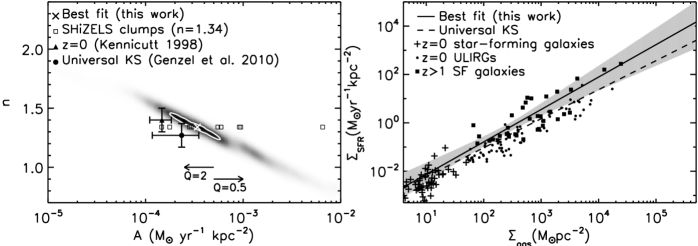
We can improve these constraints further assuming that star formation in each galaxy behaves in a similar way. We reiterate that this model assumes the star formation is occurring in a marginally Toomre stable disk, where the star formation follows the Kennicutt-Schmidt Law. Over a range = 10-5 – 10-2 (M⊙ yr-1 kpc-2) and = 0.8 – 2.5 we construct a likelihood distribution for all nine galaxies and then convolve these to provide a composite likelihood distribution, and show this in Fig. 3. Although the values of and are clearly degenerate, the best-fit solutions have = 1.340.15 and = 3.4 10-4 M⊙ yr-1 kpc-2 Our derived values for the absolute star-formation efficiency, , and power-law index, are within the 1- of the values derived for local galaxies (e.g. Kennicutt, 1998b; Leroy et al., 2008).
Using the 12CO to trace the cold molecular gas, Genzel et al. (2010) showed that gas and star-formation surface densities of high-redshift ( 1.5) star-forming galaxies and ULIRGs are also well described by the Kennicutt-Schmidt relation with coefficients = 1.17 0.10 and A = (3.3 1.5) 10-4 M⊙ yr-1 kpc-2, which is comparable to the coefficients we derive from our sample.
In Fig. 3 we plot the star formation and gas-surface surface density for both local and high-redshift star-forming galaxies and ULIRGs from Genzel et al. (2010) and overlay the range of acceptable solutions implied by our data. We reiterate that we have adopted = 1 for this analysis and note that if we adopt 1 then the absolute star formation efficiency will be increased proportionally (as shown in Fig. 3). Nevertheless, this shows that the values of and we derive are consistent with the local and high-redshift star-forming galaxies and ULIRGs, but free from uncertainties associated with converting 12CO luminosities to molecular gas mass, CO excitation or spatial extent of the gas reservoir.
Using the values of and we have derived, we infer cold molecular gas masses for the galaxies in our sample of Mgas = 109-10 M⊙ with a median Mgas = 7 2 109 M⊙. This suggests a cold molecular gas fraction of Mgas / (Mgas + M⋆) = 0.3 0.1 but with a range of 10 – 75%, similar to those derived for other high-redshift starbursts in other surveys (Tacconi et al., 2010; Daddi et al., 2010; Swinbank et al., 2011).
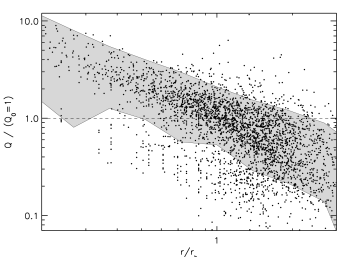
Finally, with estimates of the disk surface density, we can use Eq. 1 to construct maps of the spatially resolved Toomre parameter, . Since we set = 1 to derive the coefficients and , by construction the average across the population is unity, but the relative range of within the ISM of each galaxy is unaffected by this assumption. In Fig. 1 we show the maps of for each galaxy in our sample (with contours marking = 0.5, 1.0 and 2.0). This shows that there is a range of Toomre across the ISM, and to highlight the variation with radius, in Fig. 4 we show the Toomre parameter within each pixel of each galaxy as a function of radius (normalised to the half light radius, ). This shows that in the central regions, on average the Toomre increases by a factor 4 compared to at the half light radius, whilst a radii greater than , decreases by approximately the same factor.
3.1.1 Identification of Star-Forming Regions
As Fig. 1 shows, the galaxies in our sample exhibit a range of H morphologies, from compact (e.g. SHiZELS 11 & 12) to very extended/clumpy (e.g. SHiZELS 7, 8, 9 & 14). To identify star-forming regions on kpc scales and measure their basic properties we isolate the star-forming clumps above the background () by first converting the H flux map into photon counts (accounting for telescope efficiency) and then search for 3 over-densities above the radially averaged background light distribution. In this calculation, we demand that any region is at least as large as the PSF. We identify eleven such regions and highlight these in Fig. 1.
It is still possible that selecting star-forming regions in this way may give misleading results due to random associations and signal-to-noise effects. We therefore use the H surface brightness distribution from the galaxies and randomly generate mock images to test how many times a “clump” is identified. We find that only 2 1 spurious clumps (in our sample of eleven galaxies) could be random associations.
Next, we extract the velocity dispersion and luminosity of each clump from the using an isophote defining the star-forming region and report their values in Table 2 (the clump velocity dispersions have been corrected for the local velocity gradient from the galaxy dynamics and sizes are deconvolved for the PSF). Using the velocity dispersion and star formation density of each clump, and fixing the power-law index in the Kennicutt-Schmidt relation to = 1.34, we compute their absolute star formation efficiencies, deriving a median = 5.4 1.5 10-4 (Fig. 3). This corresponds to an offset (at fixed ) from the galaxy-average of / = 1.3 0.4. Equivalently, if we fix the absolute star formation efficiency to that of the galaxy-average, then the Toomre parameter in these regions is = 0.8 0.4.
Table 2: Physical Properties of the Star-Forming Clumps
| Galaxy | SFR | [Nii]/H | ||
|---|---|---|---|---|
| (M⊙ yr-1) | (km s-1) | (kpc) | ||
| SHiZELS-7 | 0.5 0.1 | 40 10 | 0.07 0.03 | 0.8 0.2 |
| SHiZELS-7 | 1.3 0.1 | 61 12 | 0.34 0.03 | 1.0 0.2 |
| SHiZELS-8 | 2.0 0.1 | 79 10 | 0.36 0.03 | 0.7 0.2 |
| SHiZELS-8 | 1.6 0.2 | 95 14 | 0.26 0.04 | 0.8 0.2 |
| SHiZELS-8 | 1.9 0.1 | 140 20 | 0.21 0.04 | 0.9 0.2 |
| SHiZELS-9 | 2.1 0.2 | 97 15 | 0.31 0.04 | 0.7 0.2 |
| SHiZELS-9 | 2.3 0.1 | 80 10 | 0.26 0.03 | 1.3 0.2 |
| SHiZELS-9 | 0.9 0.1 | 86 14 | 0.40 0.03 | 0.7 |
| SHiZELS-14 | 0.5 0.1 | 56 12 | 0.12 0.04 | 0.9 0.2 |
| SHiZELS-14 | 1.1 0.2 | 121 20 | 0.24 0.03 | 0.7 |
| SHiZELS-14 | 0.2 0.1 | 100 25 | 0.03 0.05 | 0.9 0.3 |
| Median | 1.4 0.4 | 88 9 | 0.24 0.06 | 0.85 0.10 |
Notes: Half light radius, rh, is deconvolved for PSF and the velocity dispersion, , is corrected for local velocity gradient (see § 3.1). The star formation rates (SFR) are calculated from the H line luminosity using SFRHα = 4.6 10-42 LHα.
3.2. The Scaling Relations of Local and High-Redshift Star-Forming Regions
The internal kinematics and luminosities of Hii regions in local galaxies, derived from the line widths of their emission lines, have been the subject of various studies for some time (e.g. Terlevich & Melnick, 1981; Arsenault et al., 1990; Rozas et al., 1998, 2006; Relaño et al., 2005). In particular, if the large line widths of star-forming Hii regions reflect the virialization of the gas then they can be used to determine their masses. However, it is unlikely that this condition holds exactly at any time during the evolution of a Hii region due to the input of radiative and mechanical energy, principally from their ionizing stars (e.g. Castor et al., 1975). Nonetheless, the least evolved Hii regions may well be within a factor of a few (2 – 3) of having their kinematics determined by their virial masses (at an early stage, the stellar ionizing luminosities are maximized whereas the mechanical energy input is minimized; Leitherer et al. 1999). In the case of Hii regions close to virial equilibrium, the use of the line-width to compute gaseous masses offers a relatively direct means to study the properties since it is independent of the small-scale structure (density, filling factor, etc.).
Terlevich & Melnick (1981) showed that the H luminosity of the most luminous Hii regions varies as L(H) . This result suggests that the most luminous Hii regions are likely to be virialized, so that information about their masses, and the resultant mass-luminosity relation, could be obtained using the virial theorem (they also claimed a relation between a radius parameter and the square of the velocity dispersion for Hii regions, as further evidence for virialization). However, more recent studies, in particular by Rozas et al. (2006) suggest that in super-giant Hii regions, L may be a more appropriate scaling (the lower exponent arises since Hii regions with the largest luminosities are generally density-bound, which means that a significant fraction of the ionizing radiation escapes and so does not contribute to the luminosity, making shallower slopes physically possible).
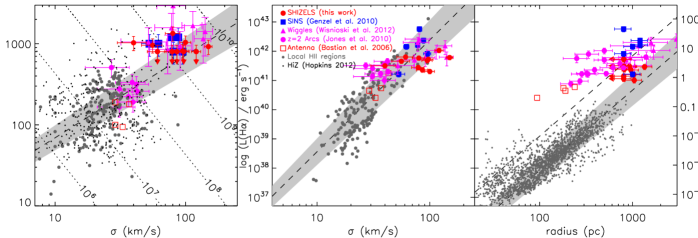
To investigate the scaling relations of star-forming regions, in Fig. 5 we show the relations between luminosity, size and velocity dispersion of the clumps in our sample compared to Giant Molecular Clouds (GMCs) and Hii regions in the Milky Way and local galaxies (Terlevich & Melnick, 1981; Arsenault et al., 1990; Bordalo & Telles, 2011; Fuentes-Masip et al., 2000; Rozas et al., 2006). In this plot, we also include the measurements of giant star-forming regions from other high-redshift star-forming galaxies at 1 from Wisnioski et al. (2012), the 1 – 2 galaxies from SINS (Genzel et al., 2011), and the clumps identified in strongly lensed 1.5 – 3 galaxies from Jones et al. (2010) and Stark et al. (2008).
Despite the scatter, the radius – and – Luminosity relations of the high-redshift clumps approximately follow the same scaling relations as those locally, but extending up to kpc scales. Indeed, including all of the data-points in the fits, we derive the scaling between size (), luminosity () and velocity dispersion () of
| (5) |
and
| (6) |
Equation 5 suggests . If the clouds are self-gravitating clouds with , then the virial density is constant. The relation L is in reasonable agreement with the early work from Terlevich & Melnick (1981), and steeper than that found for super-giant Hii regions in local galaxies (Rozas et al., 2006), although the large error bars (on both the local and high-redshift data) preclude any firm conclusions. Clearly a larger sample is required to confirm this result and/or test whether the scatter in the data is intrinsic.
If the star-forming regions we have identified are short lived, then these scaling relations effectively reflect initial collapse conditions of the clump as it formed, since a clump can not evolve far from those initial conditions (e.g. Ceverino et al., 2010). In this case, the relation between radius, velocity dispersion and gas mass should follow = / () (see § 3.3). In Fig. 5 we therefore overlay contours of constant gas mass in the r – plane, which suggests that the initial gas masses for the clumps is = 2 1 109 M⊙ a factor 1000 more massive then the star-forming complexes in local galaxies (e.g. see also Elmegreen et al. 2009; Genzel et al. 2011; Wisnioski et al. 2012). Assuming our gas mass estimates from § 3.1, then these star-forming regions may contain as much as 10 – 20% of the cold molecular gas in the disk.
Turning to the relation between size and luminosity of the star-forming regions, it is evident from Fig. 5 that the star formation densities of the high-redshift clumps higher than those locally. Indeed, local star-forming regions follows a scaling relation
| (7) |
We do not have sufficient number of objects or the dynamic range to measure both the slope and zero-point of the size-luminosity relation in the high-redshift clumps, and so instead we fix the slope of the local relation (which is ) and fit for the zero-point evolution and obtain
| (8) |
This suggests that high-redshift star-forming regions have luminosities at a fixed size that are on average a factor 15 5 larger than those locally (see also Swinbank et al. 2009, 2010; Jones et al. 2010; Wisnioski et al. 2012). We note that high luminosities at fixed size have been found in local starbursts, such as in the Antennae (Bastian et al., 2006), whilst offsets of factors 50 have been inferred for star-forming regions in high-redshift galaxies (e.g. Swinbank et al., 2009; Jones et al., 2010; Wisnioski et al., 2012).
3.3. The Relation between the Disk and Clump Properties
It is possible to relate the properties of the clumps to the overall properties of the disk (e.g. Hopkins et al., 2012). For example, the velocity dispersion of the fastest growing Jeans unstable mode which can not be stabilised by rotation in a gas disk is given by
| (9) |
(e.g. Escala & Larson, 2008; Elmegreen, 2009; Dekel et al., 2009; Genzel et al., 2011; Livermore et al., 2012). The critical density for collapse (), on scale from a turbulent ISM is given by
| (10) |
where is the line of sight velocity turbulent velocity dispersion and is the Jeans mass. The critical density for collapse therefore scales as
| (11) |
Assuming that the cloud contracts by a factor 2.5 as it collapses, the post-collapse surface density of the cloud is
| (12) |
(see also Livermore et al., 2012). Thus, the surface density of the collapsed cloud is independent of radius and proportional to the surface density of the disk, with the normalisation set by the collapse factor and under the assumption = 1. Hopkins (2012) show that this model provides an reasonable fit to giant molecular clouds in the Milky-Way, and further, suggests that the surface density (and hence surface brightness) of clouds should increase with the surface density of the disk.
Using our estimates of the stellar and gas masses and spatial extent of the galaxies in our sample, we derive disk surface densities of = 1.1 0.4 109 M⊙ kpc-2, and hence expect the mass surface densities of the star-forming regions that form to have mass surface densities of 1010 M⊙ kpc-2. It is instructive to compare this to the average mass surface density of the clumps. For example, assuming that their velocity dispersions are virial and adopting = / , using the average velocity dispersion and size of the clumps (Table 2), we derive an average clump mass surface density of = 8 2 109 M⊙ kpc-2 with = 5 (appropriate for a uniform density sphere). Although this calculation should be considered crude as it is unclear whether the velocity dispersions we measure are virial, it is encouraging that the predicted surface mass densities of the clumps are similar to those inferred from their velocity dispersions and sizes.
Finally, Hopkins (2012) (see also Escala & Larson 2008 and Livermore et al. 2012) show that for a marginally stable disk of finite thickness, density structures on scales greater than will tend to be stabilised by rotation which leads to an exponential cut off of the clump mass function above
| (13) |
or
| (14) |
This suggests that the most massive clumps that can form in a disk (“the cut off mass”) depends strongly on the disk surface density – increasing the disk surface density increases mass of the clumps that are able to form (e.g. Escala, 2011). However, there is also a competing (stabilising) factor from the epicyclic frequency such that a fixed radius, higher circular velocities reduce the mass of the largest clumps able to form.
Applying equation 14 to the Milky-Way, with a cold molecular gas fraction of 10%, = 2 (Korchagin et al., 2003), the average surface density is = 35 M⊙ pc-2 and for = 220 km s-1/ 8 kpc (Feast & Whitelock, 1997) the cut off mass should be 107 M⊙, in good agreement with the characteristic mass of the largest galactic GMCs (e.g. Stark & Lee, 2006)
How does the cut-off mass for our high-redshift sample compare to local galaxies? For = 2, and using the scaling relations derived in § 3.1 to estimate the gas mass (Table 1), ( = 3.4 10-4 M⊙ yr-1 kpc-2 and = 1.34) we derive a range of cut off masses of M0 = 0.3 – 30 109 M⊙ (with a median and error of the sample of = 9 5 109 M⊙). This is similar to the mass inferred for the brightest star-forming regions seen in high-resolution images of other high-redshift galaxies (Elmegreen, 1989; Elmegreen et al., 2007, 2009; Bournaud & Elmegreen, 2009; Förster Schreiber et al., 2011b; Genzel et al., 2011; Wisnioski et al., 2012), and a factor 1000 higher than the largest characteristic mass of a star-forming region in the Milky-Way.
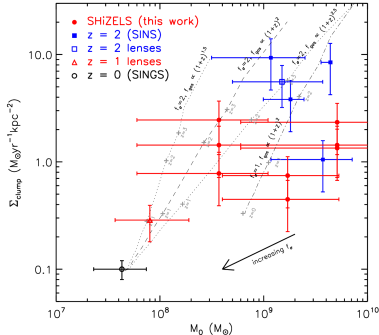
In Fig. 6 we plot our estimates of the the cut off mass versus the clump star-formation densities for the galaxies in our sample (see also Livermore et al., 2012). We use the H derived star-formation rate for each clump, corrected for galaxy reddening (note that we do not have reddening estimates for individual clumps and so we assume a factor 2 uncertainty in their star formation surface density). We also include estimates of the cut off mass and star formation surface density from the SINS survey of 2 galaxies from Genzel et al. (2011) (with dynamics measured from Förster Schreiber et al. 2009 and Cresci et al. 2009), as well as measurements from the lensing samples of Livermore et al. (2012) ( 1) and Jones et al. (2010) ( 2). Although the error-bars on individual measurements are large (particularly due to the uncertainties in deriving the gas surface density from the Kennicutt-Schmidt law), as can be seen from Fig. 6, galaxies with high cut-off masses tend to have higher clump luminosity surface densities.
It is also useful to adopt simple models for the evolution of galaxy disks and gas fraction to investigate how the cut off mass and clump properties may be expected to evolve with redshift. For example, Dutton et al. (2011) present an analytic model for the evolution of disk scaling relations (size, rotational velocity and stellar mass with redshift; see Dutton et al. 2011 Table 3). Combining with a simple model for the evolution of the gas fraction (1 + )b with = 1.5 – 2.5 (Geach et al., 2011) and using Eq. 12 and Eq. 14 we show the expected evolution of the cut-off mass and clump luminosity surface density with redshift. This shows that as the gas fraction increases (and adopting evolving models for the size, disk and circular velocity of galaxies), then the cut off mass should increase by a factor 10 – 100, over the redshift range = 0–2.5 whilst the star formation density of the clumps should increase by a approximately an order of magnitude over the same redshift range. Although this is a simple model, this framework allows us to understand why the properties of the star-forming clumps within the ISM of our sample of high-redshift galaxies are different to those typically found in star-forming galaxies locally.
4. Conclusions
We have presented resolved spectroscopy of nine star-forming galaxies at = 0.84 – 2.23 selected from the UKIRT/HiZELS survey. These galaxies have reddenning corrected star-formation rates of SFR = 16 5 M⊙ yr-1 and so are representative of the high-redshift population (Sobral et al., 2012b). The H dynamics suggest that the ionised gas in at least six galaxies is in the form of large, rotating disks. We use the inferred rotation speeds of these systems, together with the spatial extent of the H to investigate the star formation within the ISM, and we derive the following main conclusions:
The star formation and velocity dispersion within the ISM of these high-redshift galaxies follow a power-law relation of the form + where the coefficients, and are set by the Kennicutt-Schmidt Law ( = ) and the constant includes the disk stellar surface density of finite thickness. Assuming the gas disks are marginally stable ( = 1) we combine the solutions for each galaxy and derive best-fit parameters of power-law exponent, = 1.340.15 and absolute star formation efficiency, = 3.4 10-4 M⊙ yr-1 kpc-2. These values are consistent with the parameters derived via 12CO observations for both local and high-redshift star-forming galaxies, but free from any assumptions about 12CO – H2 conversion factors, 12CO excitation or the spatial extent of the gas reservoir.
Applying these coefficients, we infer cold molecular gas masses in the range Mgas = 109-10 M⊙ with a median Mgas = 7 2 109 M⊙ and hence a cold molecular gas fraction of Mgas / (Mgas + M⋆) = 0.3 0.1 but with a range of 10 – 75%.
Using a simple analytic model, we show that the largest structures that can form within the disk (the cut-off mass, ) are set by the disk surface density with a competing (stabilising) force from the epicyclic frequency such that M. For the galaxies in our sample, we derive cut off masses of 109 M⊙, a factor 1000 higher than the largest characteristic mass of GMCs in the Milky-Way.
Within the ISM of these galaxies, we reliably isolate eleven kpc-scale star-forming regions and measure their properites. We show that their luminosities and velocity dispersions follow the same scaling relations between size and velocity dispersion as local Hii regions. Assuming the line widths are virial, the masses derived for these star-forming regions are consistent with those implied by the cut-off mass. However, we find that the luminosity densities of these star-forming regions are a factor 15 higher than those typically found locally, which we attribute to the requirement that the surface density of the (collapsed) cloud must be 10 that of the disk.
Overall, the scaling relations we have derived suggest that the star formation processes in high-redshift disks are similar to those in local spiral galaxies, but occurring in systems with a gas rich and turbulent ISM. Given the paucity of gas-rich, clumpy disk-like high-redshift galaxies (Elmegreen et al., 2007, 2009; Förster Schreiber et al., 2011a), the next step in these studies is to spatially resolve the cold molecular gas via CO spectroscopy in a well selected sample in order to better constrain the interation between star-formation and gas dynamics. Through comparisons with cosmologically based numerical simulations (e.g. Crain et al., 2009; van de Voort et al., 2011; Ceverino et al., 2010), as well as high resolution simulations of individual gas-rich disks (e.g. Agertz et al., 2009; Krumholz & Burkert, 2010) such observations may begin to differentiate whether the dominant mode of accretion is via three-dimensional cold gas flows accrete from the inter-galactic medium, or from two-dimensions from outskirts of the disk as gas cools from the hot halo.
acknowledgments
We would like to thank the anonymous referee for their constructive report which significantly improved the content and clarity of this paper. We thank Mario van der Ancker for help and support with the SINFONI planning/observations, and Richard Bower, Avashi Dekel, Reinhard Genzel, Rachael Livermore, Natascha Förster-Schreiber, and Phil Hopkins for a number of very useful discussions. AMS gratefully acknowledges an STFC Advanced Fellowship. DS is supported by a NOVA fellowship. IRS acknowledges support from STFC and a Leverhume Senior Fellowship. JEG is supported by a Banting Fellowship, administered by the Natural Sciences and Engineering Research Council of Canada. This research was also supported in part by the National Science Foundation under Grant No. NSF PHY11-25915. The data presented here are based on observations with the SINFONI spectrograph on the ESO/VLT under program 084.B-0300.
References
- Agertz et al. (2009) Agertz, O., Teyssier, R., & Moore, B. 2009, MNRAS, 397, L64
- Arsenault et al. (1990) Arsenault, R., Roy, J.-R., & Boulesteix, J. 1990, A&A, 234, 23
- Bastian et al. (2006) Bastian, N., Emsellem, E., Kissler-Patig, M., & Maraston, C. 2006, A&A, 445, 471
- Bordalo & Telles (2011) Bordalo, V. & Telles, E. 2011, ApJ, 735, 52
- Bothwell et al. (2012) Bothwell, M. S., Smail, I., Chapman, S. C., Genzel, R., Ivison, R. J., Tacconi, L. J., Alaghband-Zadeh, S., & Bertoldi, F. et al. 2012, ArXiv e-prints
- Bournaud & Elmegreen (2009) Bournaud, F. & Elmegreen, B. G. 2009, ApJL, 694, L158
- Bruzual & Charlot (2003) Bruzual, G. & Charlot, S. 2003, MNRAS, 344, 1000
- Cacciato et al. (2012) Cacciato, M., Dekel, A., & Genel, S. 2012, MNRAS, 421, 818
- Castor et al. (1975) Castor, J. I., Abbott, D. C., & Klein, R. I. 1975, ApJ, 195, 157
- Ceverino et al. (2010) Ceverino, D., Dekel, A., & Bournaud, F. 2010, MNRAS, 404, 2151
- Chabrier (2003) Chabrier, G. 2003, PASP, 115, 763
- Crain et al. (2009) Crain, R. A., Theuns, T., Dalla Vecchia, C., Eke, V. R., Frenk, C. S., Jenkins, A., & Kay, S. T. 2009, MNRAS, 399, 1773
- Cresci et al. (2009) Cresci, G., Hicks, E. K. S., Genzel, R., Schreiber, N. M. F., Davies, R., Bouché, N., Buschkamp, P., & Genel, S. et al. 2009, ApJ, 697, 115
- Daddi et al. (2010) Daddi, E., Bournaud, F., Walter, F., Dannerbauer, H., Carilli, C. L., Dickinson, M., Elbaz, D., & Morrison G. et al. 2010, ApJ, 713, 686
- Davies et al. (2011) Davies, R., Förster Schreiber, N. M., Cresci, G., Genzel, R., Bouché, N., Burkert, A., Buschkamp, P., & Genel, S. et al. 2011, ApJ, 741, 69
- Dekel et al. (2009) Dekel, A., Birnboim, Y., Engel, G., Freundlich, J., Goerdt, T., Mumcuoglu, M., Neistein, A., & Pichon, C et al. 2009, Nature, 457, 451
- Dutton et al. (2011) Dutton, A. A., van den Bosch, F. C., Faber, S. M., Simard, L., Kassin, S. A., Koo, D. C., Bundy, K., & Huang, J. et al. 2011, MNRAS, 410, 1660
- Elmegreen (1989) Elmegreen, B. G. 1989, ApJ, 344, 306
- Elmegreen (2009) Elmegreen, B. G. 2009, in IAU Symposium, Vol. 254, IAU Symposium, ed. J. Andersen, J. Bland-Hawthorn, & B. Nordström, 289–300
- Elmegreen et al. (2009) Elmegreen, B. G., Elmegreen, D. M., Fernandez, M. X., & Lemonias, J. J. 2009, ApJ, 692, 12
- Elmegreen et al. (2007) Elmegreen, D. M., Elmegreen, B. G., Ravindranath, S., & Coe, D. A. 2007, ApJ, 658, 763
- Escala (2011) Escala, A. 2011, ApJ, 735, 56
- Escala & Larson (2008) Escala, A. & Larson, R. B. 2008, ApJL, 685, L31
- Feast & Whitelock (1997) Feast, M. & Whitelock, P. 1997, MNRAS, 291, 683
- Förster Schreiber et al. (2009) Förster Schreiber, N. M., Genzel, R., Bouché, N., Cresci, G., Davies, R., Buschkamp, P., Shapiro, K., & Tacconi, L. J.. et al. 2009, ApJ, 706, 1364
- Förster Schreiber et al. (2011a) Förster Schreiber, N. M., Shapley, A. E., Erb, D. K., Genzel, R., Steidel, C. C., Bouché, N., Cresci, G., & Davies, R. 2011a, ApJ, 731, 65
- Förster Schreiber et al. (2011b) Förster Schreiber, N. M., Shapley, A. E., Genzel, R., Bouché, N., Cresci, G., Davies, R., Erb, D. K., Genel, S., Lutz, D., Newman, S., Shapiro, K. L., Steidel, C. C., Sternberg, A., & Tacconi, L. J. 2011b, ApJ, 739, 45
- Fuentes-Masip et al. (2000) Fuentes-Masip, O., Muñoz-Tuñón, C., Castañeda, H. O., & Tenorio-Tagle, G. 2000, AJ, 120, 752
- Geach et al. (2008) Geach, J. E., Smail, I., Best, P. N., Kurk, J., Casali, M., Ivison, R. J., & Coppin, K. 2008, MNRAS, 388, 1473
- Geach et al. (2011) Geach, J. E., Smail, I., Moran, S. M., MacArthur, L. A., Lagos, C. d. P., & Edge, A. C. 2011, ApJL, 730, L19
- Genzel et al. (2008) Genzel, R., Burkert, A., Bouché, N., Cresci, G., Förster Schreiber, N. M., Shapley, A., Shapiro, K., & Tacconi, L. J., et al. 2008, ApJ, 687, 59
- Genzel et al. (2011) Genzel, R., Newman, S., Jones, T., Förster Schreiber, N. M., Shapiro, K., Genel, S., Lilly, S. J., & Renzini, A. et al. 2011, ApJ, 733, 101
- Genzel et al. (2010) Genzel, R., Tacconi, L. J., Gracia-Carpio, J., Sternberg, A., Cooper, M. C., Shapiro, K., Bolatto, A., & Bouche, N. et al.,. 2010, MNRAS, 407, 2091
- Hopkins & Beacom (2006) Hopkins, A. M. & Beacom, J. F. 2006, ApJ, 651, 142
- Hopkins (2012) Hopkins, P. F. 2012, MNRAS, 423, 2016
- Hopkins et al. (2012) Hopkins, P. F., Quataert, E., & Murray, N. 2012, MNRAS, 421, 3488
- Jones et al. (2010) Jones, T. A., Swinbank, A. M., Ellis, R. S., Richard, J., & Stark, D. P. 2010, MNRAS, 404, 1247
- Kennicutt (1998a) Kennicutt, R. C. 1998a, ARAA, 36, 189
- Kennicutt (1998b) Kennicutt, Jr., R. C. 1998b, ApJ, 498, 541
- Kennicutt et al. (2003) Kennicutt, Jr., R. C., Armus, L., Bendo, G., Calzetti, D., Dale, D. A., Draine, B. T., Engelbracht, C. W., & Gordon, K. D. et al. 2003, PASP, 115, 928
- Kereš et al. (2005) Kereš, D., Katz, N., Weinberg, D. H., & Davé, R. 2005, MNRAS, 363, 2
- Korchagin et al. (2003) Korchagin, V. I., Girard, T. M., Borkova, T. V., Dinescu, D. I., & van Altena, W. F. 2003, AJ, 126, 2896
- Krumholz & Burkert (2010) Krumholz, M. & Burkert, A. 2010, ApJ, 724, 895
- Krumholz & Dekel (2010) Krumholz, M. R. & Dekel, A. 2010, MNRAS, 406, 112
- Krumholz et al. (2012) Krumholz, M. R., Dekel, A., & McKee, C. F. 2012, ApJ, 745, 69
- Lehnert et al. (2009) Lehnert, M. D., Nesvadba, N. P. H., Tiran, L. L., Matteo, P. D., van Driel, W., Douglas, L. S., Chemin, L., & Bournaud, F. 2009, ApJ, 699, 1660
- Leitherer et al. (1999) Leitherer, C., Schaerer, D., Goldader, J. D., Delgado, R. M. G., Robert, C., Kune, D. F., de Mello, D. F., Devost, D., & Heckman, T. M. 1999, ApJS, 123, 3
- Leroy et al. (2008) Leroy, A. K., Walter, F., Brinks, E., Bigiel, F., de Blok, W. J. G., Madore, B., & Thornley, M. D. 2008, AJ, 136, 2782
- Livermore et al. (2012) Livermore, R. C., Jones, T., Richard, J., Bower, R. G., Ellis, R. S., Swinbank, A. M., Rigby, J. R., & Smail, I. et al. 2012, ArXiv e-prints
- Rafikov (2001) Rafikov, R. R. 2001, MNRAS, 323, 445
- Relaño et al. (2005) Relaño, M., Beckman, J. E., Zurita, A., Rozas, M., & Giammanco, C. 2005, A&A, 431, 235
- Romeo & Wiegert (2011) Romeo, A. B. & Wiegert, J. 2011, MNRAS, 416, 1191
- Rozas et al. (1998) Rozas, M., Castaneda, H. O., & Beckman, J. E. 1998, A&A, 330, 873
- Rozas et al. (2006) Rozas, M., Richer, M. G., López, J. A., Relaño, M., & Beckman, J. E. 2006, A&A, 455, 539
- Sobral et al. (2010) Sobral, D., Best, P. N., Geach, J. E., Smail, I., Cirasuolo, M., Garn, T., Dalton, G. B., & Kurk, J. 2010, MNRAS, 404, 1551
- Sobral et al. (2009) Sobral, D., Best, P. N., Geach, J. E., Smail, I., Kurk, J., Cirasuolo, M., Casali, M., & Ivison, R. J. et al. 2009, MNRAS, 398, 75
- Sobral et al. (2012a) Sobral, D., Best, P. N., Matsuda, Y., Smail, I., Geach, J. E., & Cirasuolo, M. 2012a, MNRAS, 420, 1926
- Sobral et al. (2011) Sobral, D., Best, P. N., Smail, I., Geach, J. E., Cirasuolo, M., Garn, T., & Dalton, G. B. 2011, MNRAS, 411, 675
- Sobral et al. (2012b) Sobral, D., Smail, I., Best, P. N., Geach, J. E., Matsuda, Y., Stott, J. P., Cirasuolo, M., & Kurk, J. 2012b, ArXiv:1202.3436
- Stark & Lee (2006) Stark, A. A. & Lee, Y. 2006, ApJL, 641, L113
- Stark et al. (2008) Stark, D. P., Swinbank, A. M., Ellis, R. S., Dye, S., Smail, I. R., & Richard, J. 2008, Nature, 455, 775
- Swinbank et al. (2011) Swinbank, A. M., Papadopoulos, P. P., Cox, P., Krips, M., Ivison, R. J., Smail, I., Thomson, A. P., Neri, R., Richard, J., & Ebeling, H. 2011, ApJ, 742, 11
- Swinbank et al. (2010) Swinbank, A. M., Smail, I., Longmore, S., Harris, A. I., Baker, A. J., De Breuck, C., Richard, J., & Edge, A. C. et al. 2010, Nature, 464, 733
- Swinbank et al. (2012) Swinbank, A. M., Sobral, D., Smail, I., Geach, J. E., Best, P. N., McCarthy, I. G., Crain, R. A., & Theuns, T. 2012, MNRAS, 426, 935
- Swinbank et al. (2009) Swinbank, A. M., Webb, T. M., Richard, J., Bower, R. G., Ellis, R. S., Illingworth, G., Jones, T., Kriek, M., Smail, I., Stark, D. P., & van Dokkum, P. 2009, MNRAS, 400, 1121
- Tacconi et al. (2010) Tacconi, L. J., Genzel, R., Neri, R., Cox, P., Cooper, M. C., Shapiro, K., Bolatto, A., & Bournaud, F., et al. 2010, Nature, 463, 781
- Terlevich & Melnick (1981) Terlevich, R. & Melnick, J. 1981, MNRAS, 195, 839
- Toomre (1964) Toomre, A. 1964, ApJ, 139, 1217
- van de Voort et al. (2011) van de Voort, F., Schaye, J., Booth, C. M., Haas, M. R., & Dalla Vecchia, C. 2011, MNRAS, 414, 2458
- Wisnioski et al. (2012) Wisnioski, E., Glazebrook, K., Blake, C., Poole, G. B., Green, A. W., Wyder, T., & Martin, C. 2012, ArXiv e-prints
- Wisnioski et al. (2011) Wisnioski, E., Glazebrook, K., Blake, C., Wyder, T., Martin, C., Poole, G. B., Sharp, R., & Couch, W. et al. 2011, MNRAS, 417, 2601