Discovery of multi-phase cold accretion in a massive galaxy at z=0.7
Abstract
We present detailed photo+collisional ionization models and kinematic models of the multi-phase absorbing gas, detected within the HST/COS, HST/STIS, and Keck/HIRES spectra of the background quasar TON 153, at 104 kpc along the projected minor axis of a star-forming spiral galaxy (). Complementary photometry and stellar population models indicate that the host galaxy is dominated by a Gyr stellar population with slightly greater than solar metallicity and has an estimated log and a log. Photoionization models of the low ionization absorption, (Mgi, Siii, Mgii and Ciii) which trace the bulk of the hydrogen, constrain the multi-component gas to be cold (log) and metal poor (). A lagging halo model reproduces the low ionization absorption kinematics, suggesting gas coupled to the disk angular momentum, consistent with cold accretion mode material in simulations. The Civ and Ovi absorption is best modeled in a separate collisionally ionized metal-poor () warm phase with log. Although their kinematics are consistent with a wind model, given the dex difference between the galaxy stellar metallicity and the absorption metallicity indicates the gas cannot arise from galactic winds. We discuss and conclude that although the quasar sight-line passes along the galaxy minor axis at projected distance of 0.3 virial radii, well inside its virial shock radius, the combination of the relative kinematics, temperatures, and relative metallicities indicated that the multi-phase absorbing gas arises from cold accretion around this massive galaxy. Our results appear to contradict recent interpretations that absorption probing the projected minor axis of a galaxy is sampling winds.
keywords:
—galaxies: ISM, haloes —quasars: absorption lines.1 Introduction
Over the last decade, simulations have shown that galaxy evolution is highly dependent on gas accretion occurring via two modes: hot and cold accretion. Current cosmological simulations demonstrate that the majority of gas accreted at early epochs onto galaxies occurs via the cold mode, which has temperatures of K and metallicities of . Cold-mode gas is preferentially accreted along cosmic filaments/streams and have high densities and low cooling times providing a large supply of gas penetrating through hot halos surrounding galaxies (keres05; dekel06; ocvirk08; keres09; brooks09; dekel09; ceverino10; stewart11a; stewart11b; freeke11a; freeke11b; faucher-giguere11). It is expected that cold accretion should comprise no more than 7% of the total Hi mass density at (kacprzak11c).
It is further expected that cold accretion truncates when the host galaxy mass exceeds M, since infalling gas becomes shock heated to the halo viral temperature () and is predicted to dramatically reduce the cold accretion cross-section to a tiny fraction (e.g., dekel06; keres05; ocvirk08; dekel09; keres09; stewart11a; brooks09; freeke11a; freeke11b) of the observed halo gas cross-section (kacprzak08; chen10a). However, it is expected that these dense filaments can still survive within hot halos and could provide an efficient means of feeding massive galaxies with pristine gas (e.g., keres05).
The study of absorbing foreground gas detected in background quasar spectra allows us to probe these otherwise unobservable comic filaments and outflows. Mgii absorption is ideal for detecting cold mode and hot mode accretion, wind outflows, etc., since it probes gas with a large range of neutral hydrogen column densities, cm (archiveI; weakII) with gas temperature of around 30,00040,000 K and average total hydrogen densities of atoms cm (cvc03; ding05). It has also been thoroughly demonstrated that Mgii absorption is produced within gaseous halos surrounding galaxies and is not produced within the intergalactic medium (IGM) (see cwc-china).
Over the last decade, strong Mgii absorption has also been observed to directly trace 1001000 km s galactic-scale outflows (tremonti07; weiner09; martin09; rubin10; coil11; martin12) that extend out to at least 50 kpc along the galaxy minor axis (bordoloi11; bouche11; kacprzak12). Galactic winds have been observed over a large range of redshifts and detected using a range of ions (see steidel10, and references therein). Correlations between galaxy colors and star formation rates with Mgii equivalent widths also indirectly suggest that absorption is produced in outflows (zibetti07; noterdaeme10; nestor11).
However, Mgii has been observed infalling (martin12) into highly inclined galaxies with velocities of 100200 km s (rubin11). This is consistent with kacprzak11b who showed that absorption strength is correlated with the orientation of the galaxy major axis, implying that a significant fraction of weaker Mgii absorption systems are likely accreting toward the galaxy via cold flows. The bimodal azimuthal angle distribution of quasar sight-lines around Mgii absorption selected galaxies also suggests that infall occurs along the projected galaxy major axis (bouche11; kacprzak12). These cold-flow streams likely produce a circumgalactic co-rotating gas component that is predominately infalling towards the galaxy and, in absorption, these structures are expected to have km s velocity offsets relative to the host galaxy and in the same direction of galaxy rotation (stewart11b). These models are consistent with previous observations of steidel02 and kacprzak10a that show Mgii absorption residing fully to one side of the galaxy systemic velocity and usually aligned with expected galaxy rotation direction, with the absorption essentially mimicking the extension of the galaxy rotation curve out into the halo. We expect low ionization states, such as Mgi, Mgii, Siii, Cii and Ciii to be ideal for tracing cold mode accretion given metallicity, temperatures and densities expected.
A reliable means of determining the origins of the absorbing gas is to obtain both the host-galaxy and absorption-line metallicity. Absorption-line metallicities for a handful of systems have been determined to range between [M/H] to while existing near sub-L galaxies that have nearly solar metallicities (zonak04; chen05; tripp05; cooksey08; kacprzak10b; ribaudo11; thom11). It is postulated that these extremely low metallicity absorption systems are likely accreting onto their host galaxies and possibly trace cold mode accretion, which is still expected for these sub-L galaxies. In the rare case where absorption-line metallicities are larger than the host galaxy is suggestive that the absorption is probing winds (peroux11).
Here we target a particular galaxy that has Mgii absorption consistent with disk-like kinematics, possibly tracing cold accretion. The absorption also contains a separate warm phase as indicated by separate strong Civ absorption that does not coincide with Mgii. We have obtained supplementary HST/COS data in order to determine the physical properties of the gas. In this paper, we perform kinematic and photo+collisional ionization models of multi-phase absorbing gas obtained from HST/COS, HST/STIS, and Keck/HIRES, which is associated with star-forming spiral galaxy at . In § 2 we describe our targeted galaxy and our data. We discuss our absorption-line analysis in § 3. In § LABEL:sec:galresults we describe the host galaxy properties determined from broad-band photometry and stellar population models. In § LABEL:sec:absresults we describe the results of our kinematics and photo+collisional ionization models and the physical properties of the absorbing gas. In § LABEL:sec:dis, we discuss the possible origins of the absorption and our concluding remarks are in § LABEL:sec:conclusion. Throughout we adopt an H km sMpc, , cosmology.
2 Target Field and Observations
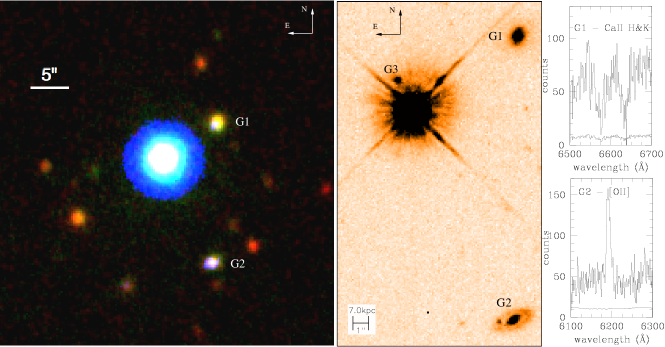
TON 153, also known as Q1317227, is a bright (V=16.0 mag) quasar at 1.017. Inspection of a low resolution quasar spectrum revealed two Mgii absorption systems at and (ss92). Following a spectroscopic survey of galaxies in close angular proximity to the quasar sight-line, steidel02 discovered galaxies G1 and G2 shown in Figure 1. The quiescent early-type galaxy G1 has a redshift of and the star-forming disk galaxy G2 has a redshift of . churchill07 demonstrated that G1 was associated with a Ly complex that did not have any observable metals even though it resides at kpc; well within the 100 kpc where metals are expected (e.g., chen01; kacprzak08; chen10a; tumlinson11). In a companion paper (churchill12b), we further discuss G1 and its associated absorption lines. The galaxy G2 is at kpc and is associated with extensive metal-line/LLS absorption at (ss92; bachall93; bahcall96; archiveI; ding05; churchill07) and is the focus of this paper.
2.1 HST Imaging
In Figure 1 we present a 4700 second HST/WFPC–2 F702W image (PID 5984; PI Steidel) that was reduced using the WFPC-2 Associations Science Products Pipeline (WASPP111http://archive.stsci.edu/hst/wfpc2/pipeline.html). Note that the F702W filter provides a bandpass similar to a rest-frame Johnson B-band filter for galaxies at . Galaxy magnitudes and luminosities were obtained from churchill12a and are based on the AB system. The GIM2D software (simard02) was used to obtain quantified galaxy morphological parameters that were published in kacprzak11b and churchill12a.
2.2 Ground-based Imaging
To further constrain the properties of G2, we analyzed multi-band and imaging. The -bands were obtained using SPIcam CCD imager on the APO 3.5 m telescope. SPIcam has a field of view of and a spatial resolution of /pixel. Our observations were taken with on-chip binning of which provides a plate scale of 0.28/pixel. The images were taken as part of a large survey program and were observed over 4 nights between March 2006 and March 2007 providing total exposure times in the of 5190, 4630 and 4350 seconds, respectively, with typical seeing of .
Multiple frames were taken in each filter and each frame was individually reduced using standard IDL and IRAF222IRAF is written and supported by the IRAF programming group at the National Optical Astronomy Observatories (NOAO) in Tucson, Arizona. NOAO is operated by the Association of Universities for Research in Astronomy (AURA), Inc. under cooperative agreement with the National Science Foundation. packages. Pixel-to-pixel variations were removed using a combination of dome and twilight sky flat fields. Due to PSF/seeing variations over the long exposures, cosmic rays were removed from each frame separately. The SPIcam pixels are sufficiently small that interpolation errors do not lead to significant photometric uncertainties. The astrometry was calibrated by matching field stars from each frame to USNO A2.0 catalog stars.
The photometric zeropoints were established using a number of stars from the SDSS catalog. Since the APO filter/detector combination does not exactly match that of the SDSS survey, there can exist color terms between the two systems. We derived these color terms by analyzing the SDSS stellar photometry from over 30 fields and produced a single photometric solution. We adopt the color term derived from the large set of observations and the average corrections are of the order of 0.1 magnitudes.
Deep near-infrared (Ks) band images were obtained in 1994 February 24 using the Kitt Peak 4-m Mayall telescope and the IRIM NICMOS 3 camera with 0.6/pixel. These images were part of a more extensive Mgii galaxy survey of sdp94. The images were reduced using the contributed IRAF package DIMSUM333http://iraf.noao.edu/iraf/ftp/contrib/dimsumV3/. DIMSUM was contributed by P. Eisenhardt, M. Dickinson, S. A. Stanford, & F. Valdez.. The photometric zeropoints were established using a number of stars from the 2MASS point-source catalog (skrutskie06).
In Figure 1 we present a color composite image centered on TON 153 with galaxies G1 and G2 labeled. See companion paper churchill12b for further discussions of the properties of G1. Note that all other objects near the quasar sight-line are red compared to the two galaxies, indicating that all the other objects are likely at much higher redshifts and that G1 and G2 are likely isolated objects. churchill12b noted that the ROSAT X-ray luminosity limit for this field is four orders of magnitude less than what is expect for cluster centers and is consistent with the expected luminosity for early-type galaxy halos at . In addition, the absorption metallicities determined by churchill12b for G1, and those found here, are 12dex lower than expected for inter-cluster medium. Thus, it is likely that the absorption does not arise in a cluster environment.
The galaxy G3 is located within 1 northeast of the quasar sight-line and has not been successfully identified spectroscopically since the quasar is bright. It is possible that this object is responsible for either the absorption associated with G1, G2, the absorption system, absorption at the quasar redshift, or other metal-lines identified in this sight-line. If G3 is at , than churchill12b estimates its mass to be a factor of ten less than the mass of G2 and would have a similar metallicity to G2 according to mass-gas metallicity relations (e.g., savaglio05). Thus, if G3 is at the same redshift of G2, it could be considered as a satellite of G2 and would occupy the same gaseous and dark matter halo.
Photometry for calibration and science was extracted using SExtractor (bertin96) using the MAGAUTO measurements. Corrections for Galactic dust extinction were applied to the galaxies using the dust maps of schlegel98. We obtained final dust-, color- and seeing-corrected AB magnitudes for G1 of , , and (churchill12b) and for G2 of , , and .
2.3 Galaxy Spectroscopy
The galaxies shown in Figure 1 were spectroscopically identified by steidel02 and their spectra were first presented in churchill07. A possible object seen within 1 from the quasar seen in the image has not been successfully identified spectroscopically since the quasar is bright. The details of the Keck/LRIS spectroscopic observations can be found in steidel02 and churchill07; churchill12b. The spectra are both vacuum and heliocentric velocity corrected. Galaxy G1, identified by Caii H & K absorption yields a , is associated with broad Ly complex that spans 1400 km s and yet contains only very weak metals lines (churchill07; churchill12b). Galaxy G2 was identified by a [Oii] emission line, placing it at . This galaxy is associated with extensive metal-line/LLS absorption at (bachall93; bahcall96; archiveI; ding05; churchill07) and is the focus of this paper. We discuss G2’s associated metals-lines in the next sections.
2.4 Quasar Spectroscopy
Some of the absorption properties were measured from a 3600 second Keck/HIRES () exposure observed in 1995 January. The details of the observation and data reduction are described in cv01. In addition, a 12,000 second HST/STIS E230M () exposure was obtained (PID 8672; PI Churchill) and the data reduction details are found in ding05.
Recent HST/COS observations of the quasar () were obtained using the FUV G160M grating and the NUV G185M grating (PID 11667; PI Churchill). The FUV observations were centered at 1600 Å and took place on 25 June 2010 with an exposure time of 12,580 seconds. The NUV observations consisted of two exposures that occurred on 26 May 2010 and were optimally co-added. The first 5420 second NUV exposure was centered at 1921 Å and the 4970 second NUV exposure was centered at 1941 Å. The COS spectra were reduced using the standard HST IRAF pipeline. All spectra are both vacuum and heliocentric velocity corrected.
It is important to note that the wavelength solutions across these multiple instruments are consistent at the sub-pixel level. This was verified across all spectrographs by centroiding common ionization absorption lines from the data presented here and the data from churchill12b.
Analysis of the absorption profiles was performed using interactive software (see weakI; archiveI; cv01) for local continuum fitting, objective feature identification, and measuring absorption properties. Velocity widths and equivalent widths of the absorption systems are measured between the pixels where the equivalent width per resolution element recovers to the detection threshold (weakI).
3 Quasar Absorption-line Analysis
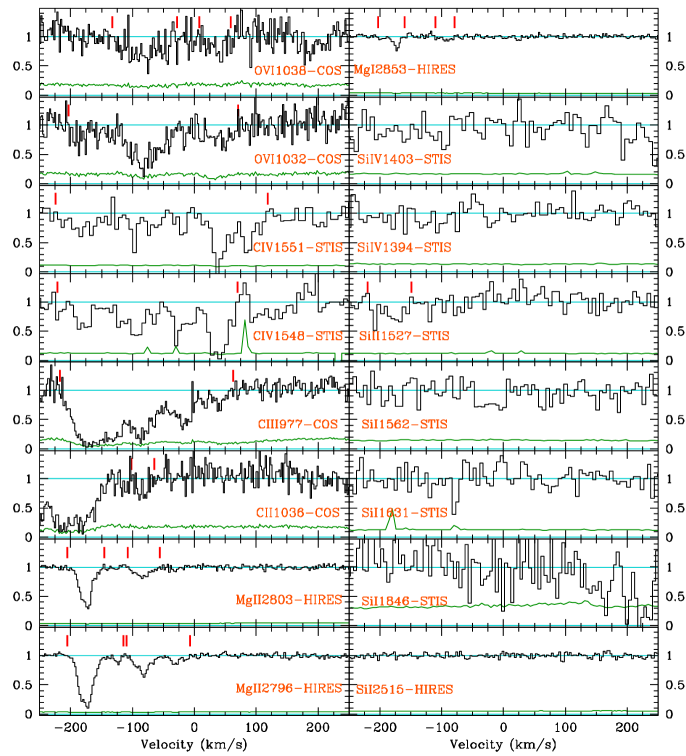
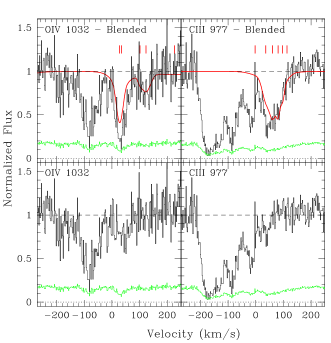
In Figure 2 we present the absorption-line data and in Table 1 we present the measured equivalent widths and column densities. We discuss below how the column densities and/or limits were computed for each transition. We further discuss how we account for higher redshift hydrogen-line blends that contaminate the Ovi 1032 and Ciii 977 transitions (see Figure 3).
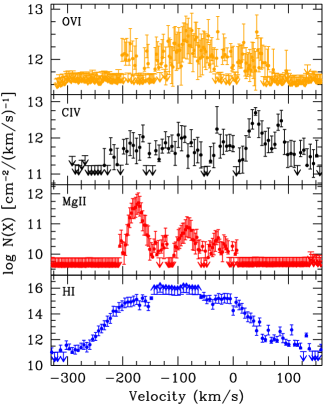
The Hi column density was adopted from churchill07, obtained by simultaneously fitting the Ly, Ly, and Lyman break obtained from a FOS spectrum, was determined to be . This is consistent with the results of rao06, who fit only the Ly line, and determined the column density to be . If we were to use the Rao et al value, our derived metallicities would decrease be 0.27 dex.
We also note upon analyzing the Civ doublet, we have deemed the reddest component seen in the Civ 1551 transition, at roughly 80 km s, to be real and has been included in our analysis. This feature does not appear in the Civ 1548 line since this region is contaminated by poor sky subtraction. This component was omitted by the analysis of ding05 but included here.
| Ion | Instrument/ | log | log | log | |||
|---|---|---|---|---|---|---|---|
| Telescope | (Å) | (Å) | (Å) | ||||
| Mgii 2796 | HIRES/Keck | 0.3480.007 | 0.3480.007 | 0.0049 | |||
| Mgii 2803 | HIRES/Keck | 0.1980.006 | 0.1980.006 | 0.0060 | |||
| MgII | 13.11 | 13.11 | 11.06 | ||||
| Mgi 2853 | HIRES/Keck | 0.0390.005 | 0.0390.005 | 0.0049 | |||
| MgI | 11.54 | 11.54 | 10.58 | ||||
| Sii 2515 | HIRES/Keck | 0.0066 | 0.0066 | 0.0066 | |||
| Sii 1846 | STIS/HST | 0.053 | 0.053 | 0.053 | |||
| Sii 1631 | STIS/HST | 0.019 | 0.019 | 0.019 | |||
| Sii 1562 | STIS/HST | 0.023 | 0.023 | 0.023 | |||
| SiI | 11.8 | 11.8 | 11.8 | ||||
| Siii 1527 | STIS/HST | 0.0670.013 | 0.0670.013 | 0.018 | |||
| SiII | 13.16 | 13.16 | 12.6 | ||||
| Siiv 1394 | STIS/HST | 0.019 | 0.019 | 0.019 | |||
| Siiv 1403 | STIS/HST | 0.023 | 0.023 | 0.023 | |||
| SiIV | 12.4 | 12.4 | 12.4 | ||||
| Cii 1036 | COS/HST | 0.0180.005 | 0.0180.005 | 0.012 | |||
| CII | 13.1 | ||||||
| Ciii 977 | COS/HST | 0.4670.008 | 0.4310.007 | 0.0360.004 | |||
| CIII | 14.20 | 14.18 | 12.88 | ||||
| Civ 1548 | STIS/HST | 0.5080.027 | 0.3150.024 | 0.1930.031 | |||
| Civ 1551 | STIS/HST | 0.4170.026 | 0.1890.021 | 0.2280.018 | |||
| CIV | 14.41 | 14.11 | 14.15 | ||||
| Ovi 1032 | COS/HST | 0.2330.012 | 0.1890.011 | 0.0440.006 | |||
| Ovi 1038 | COS/HST | 0.1050.010 | 0.0760.008 | 0.0290.007 | |||
| OVI | 14.49 | 14.33 | 13.94 | ||||
| HI | FOS/HST | 18.30.3 | 18.30.3 | ||||
| COS/HST | 16.03 |
The equivalent width limits are computed at the 3-level and are for an unresolved cloud. The column densities are measured using the AOD method and the column density limits are computed using the COG analysis (see text).
and log are quoted for absorption blueward () redward () of the galaxy systemic velocity. The velocity windows used to compute log are km s for gas blueward of the G2 systemic velocity and km s for gas redward of the G2 systemic velocity.
Cii is blended with an unknown line at km s, which is why the Cii is expressed as a lower limit. The exact value quoted is valid over the velocity window shown in Figure 2.
Civ 1551 is affected by poor sky subtraction and is expressed as a lower limit.The exact value quoted is valid over the velocity window shown in Figure 2.
The Hi column density is adopted from churchill07 and was determined by simultaneously fitting the Ly, Ly, and the Lyman limit absorption.