There are no starless massive proto-clusters in the first quadrant of the Galaxy
Abstract
We search the mm Bolocam Galactic Plane Survey for clumps containing sufficient mass to form star clusters. 18 candidate massive proto-clusters are identified in the first Galactic quadrant outside of the central kiloparsec. This sample is complete to clumps with mass M and radius pc. The overall Galactic massive cluster formation rate is , which is in agreement with the rates inferred from Galactic open clusters and M31 massive clusters. We find that all massive proto-clusters in the first quadrant are actively forming massive stars and place an upper limit of Myr on the lifetime of the starless phase of massive cluster formation. If massive clusters go through a starless phase with all of their mass in a single clump, the lifetime of this phase is very short.
Subject headings:
stars: formation — ISM: clouds — open clusters and associations: general — galaxies: star clusters: general1. Introduction
The Milky Way contains about 150 Globular clusters (GCs) with masses of to over and tens of thousands of open clusters containing from 100 to over stars. However, young massive clusters containing of stars are rare, with only a handful known (Portegies Zwart et al. 2010). While no GCs have formed in the Milky Way within the last 5 Gyr, open clusters that survive many crossing times continue to form. A few of these clusters have stellar masses greater than M⊙ and therefore qualify as young massive clusters (YMCs; Portegies Zwart et al. 2010). YMCs must either form from clumps having masses greater than and sizes comparable to the final cluster or be formed from a larger, more diffuse reservoir, in which case massive protocluster clumps may be rare or nonexistent (Kennicutt & Evans 2012).
Massive proto-clusters (MPCs) are massive clusters (M ) in the process of forming from a dense gas cloud. In Bressert et al. (2012), we examine the theoretical properties of MPCs: MPCs are assumed to form from massive, cold starless clumps analagous to pre-stellar cores (Williams et al. 2000). In this paper, we refer to two classes of objects: starless MPCs, which have very low luminosity and do not contain OB stars, and MPCs, which are gas-rich but have already formed OB stars. The only currently known starless MPC is G0.253+0.016, which lies within the dense central molecular zone and is subject to greater environmental stresses than similar objects in the Galactic plane (Longmore et al. 2012).
Because massive clusters contain many massive stars, at some point during their evolution ionization pressure will prevail over protostellar outflows as the dominant feedback mechanism. Other sources of feedback are less than ionization pressure up until the first supernova explosion (Bressert et al. 2012). These proto-clusters must have masses M 111We define a star formation efficiency ., or about for an assumed SFE=30% (an upper limit on the star formation efficiency), confined in a radius pc, in order to remain bound against ionization feedback. These properties motivate our search for proto-clusters in the Bolocam Galactic Plane Survey (BGPS; Aguirre et al. 2011, http://irsa.ipac.caltech.edu/data/BOLOCAM_GPS/).
The distinction between relatively short-lived ‘open clusters’ and long-lived ( Gyr) bound clusters occurs at about (Portegies Zwart et al. 2010). Clusters with will be destroyed by interactions with giant molecular clouds over the course of a few hundred million years after they have dispersed their gas (Kruijssen et al. 2011), while clusters with may survive Gyr. Closer to the Galactic center, within approximately a kiloparsec, all clusters will be destroyed on shorter timescales by strong tidal forces or interactions with molecular clouds.
In the Galaxy, there are few known massive clusters. Portegies Zwart et al. (2010) catalogs a few of them, of which NGC 3603, Trumpler 14, and Westerlund 1 and 2 are the likely descendants of the objects we investigate. These clusters have pc, , and ages Myr. We present a census of their ancestral analogs.
2. Observations and Analysis
2.1. The Bolocam Galactic Plane Survey
The BGPS is a 1.1 mm survey of the first quadrant of the Galactic plane in the range with resolution sensitive to a maximum spatial scale of (Aguirre et al. 2011; Ginsburg et al. in prep). The BGPS ‘Bolocat’ v1.0 catalog includes sources identified by a watershed decomposition algorithm and flux measurements within apertures of radius 20″, 40″, and 60″ (Rosolowsky et al. 2010).
We searched the BGPS for candidate MPCs in the 1st quadrant (; 5991 sources). The inner 6 degrees of the Galaxy are excluded because physical conditions are significantly different from those in the rest of the galaxy (Yusef-Zadeh et al. 2009) and the BGPS is confusion-limited in that region.
2.2. Source Selection & Completeness
We identify a flux-limited sample by setting our search criteria to include all sources with in a 20″ radius out to 26 kpc, or a physical radius of 2.5 pc at that distance. The radius cutoff is motivated by completeness and physical considerations: the cutoff of 26 kpc includes the entire star forming disk in our targeted longitudes, and pc corresponds to the radius at which a mass has an escape speed , i.e. ionized gas will be bound. The maximum radius and minimum mass imply a minimum mean density , which implies a maximum free-fall time Myr.
Using the Bolocat v1.0 catalog, we first set a flux limit on the sample by assuming the maximum distance of kpc and imposing a mass cutoff of inside a 20″ (2.5 pc) radius aperture. Following equation 19 in Aguirre et al. (2011):
| (1) |
and assuming K, the implied flux cutoff is 1.13 Jy 222As per Rosolowsky et al. (2010), Aguirre et al. (2011), and Ginsburg et al. (in prep), a factor of 1.5 calibration correction and 1.46 aperture correction are required for the 20″ radius aperture fluxes reported in the catalog. These factors have been applied to the data. , above which 456 ‘flux-cutoff’ candidates were selected in the Bolocat v1.0 catalog. Cutoffs of 4.3 Jy for the 40″ and 10.2 Jy for the 60″ Bolocat v1.0 apertures were used to select more nearby candidates inside the same physical radius, but no sources were selected based on these larger apertures.
The BGPS is insensitive to scales larger than 120″ (Ginsburg et al. in prep)333Ginsburg et al. (in prep) presents v2.0 of the BGPS. As a result, the survey is incomplete below a distance
from the Sun. Within this radius, alternate methods must be sought to determine the total mass within pc. Although the sample is incomplete for kpc, sources that have sufficient mass despite the 120″ spatial filtering are included.
Distances to BGPS-selected candidates were determined primarily via literature search. Where distances were unavailable, we used velocity measurements from Schlingman et al. (2011) and assumed the far distance for source selection. We then resolved the kinematic distance ambiguity towards these sources by searching for associated near-infrared stellar extinction features from the UKIDSS GPS (Lucas et al. 2008). Most literature distances were determined using a rotation curve model and some method of kinematic distance ambiguity resolution. Because the literature used different rotation curve models, there is a systematic error in distance resulting in a systematic error in mass. We used the larger 40″ radius apertures to determine the flux for sources at kpc and 60″ radius apertures for sources at kpc (corresponding to pc).
The masses were computed assuming a temperature K, opacity , and gas-to-dust ratio of 100 (Aguirre et al. 2011) 444K is more appropriate for a typical pre-star-forming clump than an evolved HII-region hosting one (Dunham et al. 2010, e.g.). However, because we are interested in cold progenitors as well as actively forming clusters, the selection is based on K, which is more inclusive. . The mass estimate drops by a factor of if the temperature assumed is doubled to K.
Ginsburg et al. (2011) notes that significant free-free contamination, as high as 80%, is possible for some 1.1 mm sources, so the selected candidates may prove to be more moderate-mass and evolved proto-clusters. We used the NRAO VLA Archive Survey (NVAS; Crossley et al. 2008) to estimate the free-free contamination for the sample. For most sources, the free-free contamination inferred from the VLA observations is small (), but for a subset the contamination was assuming that the free-free emission is optically thin. Corrected masses using the measured free-free contamination and higher dust temperatures are listed in Table 1; these are reasonable lower limits on the total mass of these regions. All of the contamination estimates are technically lower limits both because of the assumption that the free-free emission is optically thin and because the VLA filters out large-scale flux. However, in most cases, the emission is likely to be dominated by optically thin emission (evolved HII regions tend to be optically thin and bright, while compact HII regions are optically thick but relatively faint; Keto 2002) and for most sources VLA C or D-array observations were used, and at 3.6 and 6 cm the largest angular scale recovered is 180-300 ″, greater than the largest angular scale in the BGPS.
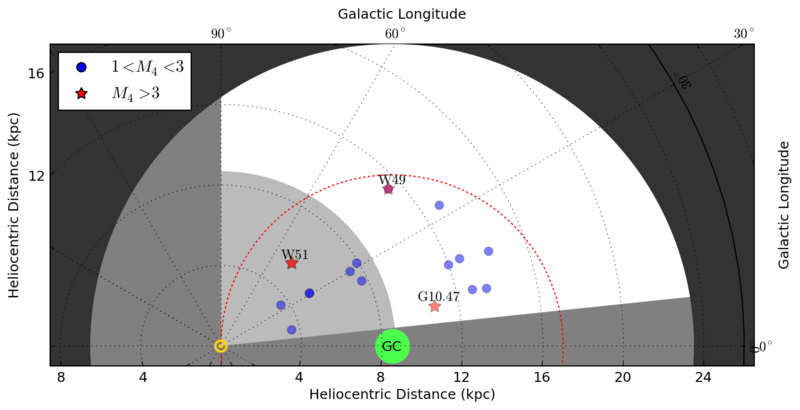
Applying a cutoff of M left 18 protocluster candidates out of the original 456. The more stringent cut M leaves only 3 MPCs .
The final candidate list contains only sources with (the completeness limit; see Table 1). The table lists their physical properties, their literature distance, their mass (assuming and a free-free subtracted lower-limit) , and their inferred escape speed () assuming a radius equal to the aperture size at that distance. The table also includes measurements of the IRAS luminosity in the 60 and 100 m bands within the source aperture.
2.3. Source Separation
These 18 candidates include some overlapping sources. There are two clumps in W51 separated by about 1.5 pc and 4.5 along the line of sight that are each independently massive enough to be classified as MPCs, but are only discussed as a single entity because they are likely to merge if their three-dimensional separation is similar to their projected distance. The candidates in W49 are more widely separated, about 4.4 pc and 7 along the line of sight, but could still merge.
Additionally, 9 of the 18 are within 8.7 kpc, so the mass estimates are lower limits. These are promising candidates for follow-up, but cannot be considered complete for population studies. If our radius restriction is dropped to 1.5 pc, the minimum complete distance drops to 5.2 kpc and the three lowest-mass sources in Table 1 no longer qualify, but otherwise the source list remains unchanged. Our analysis is therefore robust to the selection criteria used.
3. Results
3.1. Cluster formation rate
The massive clumps in Table 1 can be used to constrain the Galactic formation rate of massive clusters (MCs) above if we assume that the number of observed proto-clusters is a representative sample. The region surveyed covers a fraction of the surface area of the Galaxy assuming the star forming disk has a radius of 15 kpc555The observed fraction of the galaxy changes to 21% if we only include the area within the solar circle as discussed in §4.. The cumulative cluster formation rate above a cluster mass is given by
where Myr is the assumed cluster formation timescale 666, the time from the start of star formation until gas expulsion, is a poorly understood quantity, but is reasonably constrained to be Myr from the age spread in the Orion Nebula cluster (Hillenbrand 1997) and Myr because the most massive stars will go supernova by that time.. With the measured proto-clusters, we infer a Galactic formation rate
This cluster formation rate is statistically weak, with Poisson error of about 3.5 and can be improved with more complete surveys (e.g., Hi-Gal, Molinari et al. 2010). This formation rate is an upper limit because all of the estimated masses are upper limits as discussed in Section 2.2.
3.2. Comparison to Clusters in Andromeda
We use cluster observations in M31 from Vansevičius et al. (2009) to infer the massive cluster formation rate in M31. They observe 2 clusters with and ages Myr in 15% of the M31 star-forming disk. The implied cluster formation rate in Andromeda is . Given M31’s total star formation rate lower than the Galactic rate (Andromeda , Milky Way ; Barmby et al. 2006; Chomiuk & Povich 2011), the predicted Galactic cluster formation rate is (assuming the CFR scales linearly with the SFR; Bastian 2008). The scaled-up Andromeda cluster formation rate matches the observed Galactic cluster formation rate. The samples are small, but as a sanity check, the agreement is comforting.
3.3. Star Formation Activity
In the sample of potential proto-clusters, all have formed massive stars based on a literature search and IRAS measurements. A few of the low mass sources, G012.209-00.104, G012.627-00.016, G019.474+00.171, and G031.414+00.307 have relatively low IRAS luminosities () and little free-free emission. However, all are detected in the radio as H II regions (some ultracompact) and have luminosities indicating early-B type powering stars.
Non-detection of ‘starless’ proto-cluster clumps implies an upper limit on the starless lifetime. For an assumed Myr, the upper limit on the starless proto-MC clump is assuming Poisson statistics and using all 18 sources. This limit is consistent with massive star formation on the clump free-fall timescale ( Myr). It implies that massive stars form rapidly when these large masses are condensed into cluster-scale regions and hints that massive stars are among the first to form in massive clusters.
4. Discussion
Assuming a lower limit 30% SFE and T, 3 candidates in Table 1 will become massive clusters like NGC 3603: G010.472+00.026, W51, and W49 (G043.169+00.01). Even if T, W49 is still likely to form a MC, although G10.47 would be too small. W51, which is within the spatial-filtering incompleteness zone, passes the cutoff and is likely to form a pair of massive clusters. However, if the dust in W51 is warm and the free-free contamination is considered, the total mass in each of the W51 clumps is below the 3 cutoff.
The BGPS covers about 30% of the Galactic star-forming disk in the range 1 kpc kpc. We can extrapolate our 3 detections to predict that there are 10 () proto-clusters in the Galaxy outside of the Galactic center. The agreement between the SFR-based prediction from M31 and our observations implies that we have selected genuine massive proto-clusters (MPCs).
These most massive sources have escape speeds greater than the sound speed in ionized gas, indicating that they can continue to accrete gas even after the formation of massive stars. Assuming they are embedded in larger-scale gas reservoirs, we are measuring lower bounds on the ‘final’ clump plus cluster mass.
All of the young massive proto-clusters candidates observed are within the solar circle despite our survey covering more area outside of the solar circle. The outer radius limit for massive cluster formation is consistent with the observed metallicity shift noted at the same radius by Lépine et al. (2011). They identify the solar circle as the corotation radius of pattern speed and orbits within the Galaxy (within this radius, stars orbit faster than the spiral pattern). The fact that this radius also represents a cutoff between the inner, massive-cluster-forming disk and the outer, massive-cluster-free disk hints that gas crossing spiral arms may be the triggering mechanism for massive cluster formation. However, given the small numbers, the detected clusters are consistent with a gaussian + exponential disk distribution following that described by Wolfire et al. (2003).
Future work should include a census for MPCs within kpc using the Herschel Hi-Gal survey (Molinari et al. 2010) and in the Southern plane with ATLASGAL (Schuller et al. 2009). Some surveys have already identified proto-clusters in these regions (e.g. Faúndez et al. 2004; Battersby et al. 2011), but they are not complete. A complete survey of distances will be essential for continuum surveys to be used.
There are two modes of massive cluster formation consistent with our observations that can be observationally distinguished. Either a compact starless massive proto-cluster phase does occur and is short, or the mass to be included in the cluster is accumulated from larger volumes over longer timescales. Extending our proto-cluster survey to the Southern sky, e.g. using the ATLASGAL and Hi-Gal surveys, will either discover starless MPCs or strengthen the arguments that there is no starless MPC phase. If instead massive clusters form by large scale ( pc) accretion, substantial reservoirs of gas should surround these most massive regions and be flowing into them. Signatures of this accretion process should be visible: MPCs should contain molecular filamentary structures feeding into their centers (e.g. Correnti et al. 2012; Hennemann et al. 2012; Liu et al. 2012). Alternatively, lower mass clumps may merge to form massive clusters (Fujii et al. 2012), in which case clusters of clumps - which should be detectable in extant galactic plane surveys - are the likely precursors to massive clusters. Finally, massive clusters may form from the global collapse of structures on scales larger than we have probed, which could also produce clusters of clumps.
5. Conclusions
Using the BGPS, we have performed the first flux-limited census of massive proto-cluster candidates. We found 18 candidates that will be part of the next generation of open clusters and 3 that could form massive clusters similar to NGC 3603 ( ). We have measured a Galactic massive cluster formation rate assuming that clusters are equally likely to form everywhere within the range 1 kpc 15 kpc. The observed MPC counts are consistent with observed cluster counts in Andromeda scaled up by assuming a formation timescale of 2 Myr.
Despite this survey being the first sensitive to pre-star-forming MPC clumps, none were detected. This lack of detected pre-star-forming MPCs suggests a timescale upper limit of about Myr for the pre-massive-star phase of massive cluster formation, and hints that massive clusters may never form highly condensed clumps () prior to forming massive stars. It leaves open the possibility that massive clusters form from large-scale ( pc) accretion onto smaller clumps over a prolonged ( Myr) star formation timescale.
Observations are needed to distinguish competing models for MC formation: Birth from isolated massive proto-cluster clumps, either compact and rapid or diffuse and slow, or from smaller clumps that never have a mass as large as the final cluster mass. This sample of the 18 most massive proto-cluster clumps in the first quadrant (where they can be observed by both the VLA and ALMA) presents an ideal starting point for these observations.
6. Acknowledgements
We thank the referee for thorough and very helpful comments that strengthened this Letter. This work was supported by NSF grant AST 1009847.
References
- Aguirre et al. (2011) Aguirre, J. E. et al. 2011, ApJS, 192, 4
- Araya et al. (2002) Araya, E., Hofner, P., Churchwell, E., & Kurtz, S. 2002, ApJS, 138, 63
- Barmby et al. (2006) Barmby, P. et al. 2006, ApJ, 650, L45
- Bastian (2008) Bastian, N. 2008, MNRAS, 390, 759
- Battersby et al. (2011) Battersby, C. et al. 2011, A&A, 535, A128
- Bressert et al. (2012) Bressert, E., Ginsburg, A., Battersby, C., Bally, J., Longmore, S., & Testi, L. 2012, ArXiv e-prints
- Chomiuk & Povich (2011) Chomiuk, L. & Povich, M. S. 2011, AJ, 142, 197
- Churchwell et al. (1990) Churchwell, E., Walmsley, C. M., & Cesaroni, R. 1990, A&AS, 83, 119
- Correnti et al. (2012) Correnti, M. et al. 2012, Ap&SS, 340, 263
- Crossley et al. (2008) Crossley, J. H., Sjouwerman, L. O., Fomalont, E. B., & Radziwill, N. M. 2008, in Society of Photo-Optical Instrumentation Engineers (SPIE) Conference Series, Vol. 7016, Society of Photo-Optical Instrumentation Engineers (SPIE) Conference Series
- Dunham et al. (2010) Dunham, M. K. et al. 2010, ApJ, 717, 1157
- Faúndez et al. (2004) Faúndez, S., Bronfman, L., Garay, G., Chini, R., Nyman, L.-Å., & May, J. 2004, A&A, 426, 97
- Fish et al. (2003) Fish, V. L., Reid, M. J., Argon, A. L., & Menten, K. M. 2003, ApJ, 596, 328
- Fujii et al. (2012) Fujii, M. S., Saitoh, T. R., & Portegies Zwart, S. F. 2012, ApJ, 753, 85
- Ginsburg et al. (2011) Ginsburg, A., Darling, J., Battersby, C., Zeiger, B., & Bally, J. 2011, ApJ, 736, 149
- Ginsburg et al. (in prep) Ginsburg, A. G. et al. in prep, ApJS
- Gwinn et al. (1992) Gwinn, C. R., Moran, J. M., & Reid, M. J. 1992, ApJ, 393, 149
- Hennemann et al. (2012) Hennemann, M. et al. 2012, A&A, 543, L3
- Hillenbrand (1997) Hillenbrand, L. A. 1997, AJ, 113, 1733
- Kennicutt & Evans (2012) Kennicutt, Jr., R. C. & Evans, II, N. J. 2012, ArXiv e-prints
- Keto (2002) Keto, E. 2002, ApJ, 580, 980
- Kruijssen et al. (2011) Kruijssen, J. M. D., Pelupessy, F. I., Lamers, H. J. G. L. M., Portegies Zwart, S. F., & Icke, V. 2011, MNRAS, 414, 1339
- Lépine et al. (2011) Lépine, J. R. D. et al. 2011, MNRAS, 417, 698
- Liu et al. (2012) Liu, H. B., Quintana-Lacaci, G., Wang, K., Ho, P. T. P., Li, Z.-Y., Zhang, Q., & Zhang, Z.-Y. 2012, ApJ, 745, 61
- Longmore et al. (2012) Longmore, S. N. et al. 2012, ApJ, 746, 117
- Lucas et al. (2008) Lucas, P. W. et al. 2008, MNRAS, 391, 136
- Molinari et al. (2010) Molinari, S. et al. 2010, A&A, 518, L100
- Pandian et al. (2008) Pandian, J. D., Momjian, E., & Goldsmith, P. F. 2008, A&A, 486, 191
- Portegies Zwart et al. (2010) Portegies Zwart, S. F., McMillan, S. L. W., & Gieles, M. 2010, ARA&A, 48, 431
- Rosolowsky et al. (2010) Rosolowsky, E. et al. 2010, ApJS, 188, 123
- Sato et al. (2010) Sato, M., Reid, M. J., Brunthaler, A., & Menten, K. M. 2010
- Schlingman et al. (2011) Schlingman, W. M. et al. 2011, ApJS, 195, 14
- Schuller et al. (2009) Schuller, F. et al. 2009, A&A, 504, 415
- Sewilo et al. (2004) Sewilo, M., Watson, C., Araya, E., Churchwell, E., Hofner, P., & Kurtz, S. 2004, ApJS, 154, 553
- Urquhart et al. (2012) Urquhart, J. S. et al. 2012, MNRAS, 420, 1656
- Vansevičius et al. (2009) Vansevičius, V., Kodaira, K., Narbutis, D., Stonkutė, R., Bridžius, A., Deveikis, V., & Semionov, D. 2009, ApJ, 703, 1872
- Vig et al. (2008) Vig, S., Cesaroni, R., Testi, L., Beltrán, M. T., & Codella, C. 2008, A&A, 488, 605
- Williams et al. (2000) Williams, J. P., Blitz, L., & McKee, C. F. 2000, Protostars and Planets IV, 97
- Wolfire et al. (2003) Wolfire, M. G., McKee, C. F., Hollenbach, D., & Tielens, A. G. G. M. 2003, ApJ, 587, 278
- Xu et al. (2003) Xu, Y., Zheng, X.-W., & Jiang, D.-R. 2003, CJAA, 3, 49
- Yusef-Zadeh et al. (2009) Yusef-Zadeh, F. et al. 2009, ApJ, 702, 178
| Name | Common | Distance | M(20K) | M(40K) | aM(min) | Radius | L(IRAS) | |||
|---|---|---|---|---|---|---|---|---|---|---|
| Name | kpc | pc | cm-3 | km s-1 | ||||||
| G010.472+00.026 | G10.47 | 10.87 | 38 | 16 | 16 | 2.1 | 1.4 | 12.7 | 0.01 | 5.0 |
| G012.209-00.104 | - | 13.57 | 14 | 6 | 5 | 1.3 | 2.3 | 9.9 | 0.05 | 0.61 |
| G012.627-00.016 | - | 12.89 | 10 | 4 | 3 | 2.5 | 0.2 | 5.9 | 0.05 | 0.59 |
| G012.809-00.200 | W33 | 3.67 | 12 | 5 | 3 | 1.0 | 3.8 | 10.2 | 0.32 | 3.0 |
| G019.474+00.171 | - | 14.112 | 11 | 4 | 4 | 1.4 | 1.6 | 8.6 | 0.02 | 0.26 |
| G019.609-00.233 | G19.6 | 12.07 | 26 | 11 | 7 | 2.3 | 0.7 | 10.0 | 0.31 | 6.4 |
| G020.082-00.135 | IR18253 | 12.610 | 13 | 5 | 4 | 2.4 | 0.3 | 6.8 | 0.14 | 2.8 |
| G024.791+00.083 | G24.78 | 7.711 | 14 | 6 | 5 | 2.2 | 0.4 | 7.4 | 0.11 | 1.5 |
| G029.955-00.018 | - | 7.43 | 10 | 4 | 2 | 2.2 | 0.3 | 6.4 | 0.34 | 5.3 |
| G030.704-00.067 | W43b | 5.16 | 11 | 4 | 4 | 1.5 | 1.1 | 8.0 | 0.11 | 1.0 |
| G030.820-00.055 | W43a | 5.110 | 11 | 4 | 4 | 1.5 | 1.2 | 8.1 | 0.13 | 1.9 |
| G031.414+00.307 | G31.41 | 7.92 | 18 | 7 | 7 | 2.3 | 0.5 | 8.3 | 0.05 | 0.8 |
| G032.798+00.193 | G32.80 | 12.91 | 22 | 9 | 7 | 2.5 | 0.5 | 8.9 | 0.27 | 6.9 |
| G034.258+00.154 | G34 | 3.64 | 13 | 5 | 4 | 1.0 | 4 | 10.5 | 0.12 | 2.7 |
| G043.164-00.031 | W49 | 11.45 | 24 | 10 | 6 | 2.2 | 0.7 | 9.7 | 0.38 | 9.9 |
| G043.169+00.009 | W49 | 11.45 | 120 | 52 | 39 | 2.2 | 4 | 22.2 | 0.25 | 16.0 |
| G049.489-00.370 | W51IRS2 | 5.48 | 48 | 20 | 14 | 1.6 | 4.3 | 16.2 | 0.27 | 4.5 |
| G049.489-00.386 | W51MAIN | 5.48 | 52 | 22 | 15 | 1.6 | 4.7 | 17.0 | 0.29 | 4.7 |
1: Araya et al. (2002), 2: Churchwell et al. (1990), 3: Fish et al. (2003), 4: Ginsburg et al. (2011), 5: Gwinn et al. (1992), 7: Pandian et al. (2008), 8: Sato et al. (2010), 9: Sewilo et al. (2004), 10: Urquhart et al. (2012), 11: Vig et al. (2008), 12: Xu et al. (2003). 6: The distances to G030.704 was determined using the near kinematic distance from the velocity of the HHT-observed HCO+ line (Schlingman et al. 2011). a: The minimum likely mass, . b: The fraction of flux from free-free emission (as opposed to dust emission) at mm