Multifractal scaling of flux penetration in the Iron-based Superconductor Ba(Fe0.93Co0.07)2As2
Abstract
The penetration of magnetic flux fronts in the optimally-doped iron-based superconductor Ba(Fe1-xCox)2As2 () is studied by means of magneto-optical imaging and Bitter decoration. The higher-order analysis of roughening and growth of the magnetic flux front reveals anomalous scaling properties, indicative of non-Gaussian correlations of the disorder potential. While higher-order spatial correlation functions reveal multi-fractal behavior for the roughening, the usual Kardar-Parisi-Zhang growth exponent is found. Both exponents are found to be independent of temperature. The scaling behavior is manifestly different from that found for other modes of flux penetration, such as that mediated by avalanches, suggesting that multi-scaling is a powerful tool for the characterization of roughened interfaces. We propose a scenario for vortex penetration based on two-dimensional percolation and cluster aggregation for an inhomogeneously disordered superconductor.
pacs:
74.25.Wx,68.35.Ct,64.60.al,74.25.OpI Introduction
Vortex line pinning and the ensuing irreversible magnetic properties of type-II superconductors have been studied for many years. These are usually described in terms of the Bean model and its generalizations.Bean62 ; Zeldov94 ; Brandt1996 ; Brandt98i ; Brandt98ii ; Mikitik2000 ; Mikitik2001 While the Bean model accounts for global magnetic properties such as magnetization hysteresis loops and macroscopic flux distributions, it does not describe the local fluctuations of vortex densities in time and space,Surdeanu99 ; Surdeanu98 nor the roughness of the magnetic flux penetration front. Here is the coarse-grained flux density, averaged over a distance of the order of the penetration depth , and is the flux quantum. Due to the wide range of phenomena in which front growth and roughening occur, such as fluid flow in porous media,He92 propagation of the ignition front in burning paper,Surdeanu99 ; Maunuksela97 or the advancement of a rice pile,Pastor97 ; Aegerter2003 ; Aegerter2004 ; Lorincz2007 ; Denisov2012 and the many analogies between these different phenomena, the subject has raised a huge amount of interest over the last 25 years.
The analysis of local variations of the magnetic flux front height is commonly performed using the height-height correlation functionBarabasi95
| (1) |
where corresponds to the local deviation from the average front position, and denotes averaging over the spatial coordinate as well as time. In our case, time steps correspond to increments in the applied magnetic field .
The quantity (1) enables one to simultaneously determine both the roughness exponent and the growth exponent by fitting the respective evolution
| (2) | |||
| (3) |
The saturation length is the distance over which the front shape influences the height at a given site. The saturation time is the time scale beyond which the influence of the previous evolution of the front is lost.
Theoretical models predict different scaling properties of a roughened interface (i.e. different scaling exponents), depending on its (non)equilibrium state, the type of disorder to which it is subjected, and on its relaxational dynamics.Hagston99 Usually, one has a competition between two antagonistic mechanisms, such as the elasticity of the interface, which tends to smooth it, and its interaction with a disorder potential, responsible for roughening. A powerful theoretical approach to kinetic roughening is represented by the so-called Kardar-Parisi-Zhang (KPZ) modelKardar86 which describes the temporal evolution of the height variable ,
| (4) |
Here is an effective surface tension; quantifies the importance of lateral growth and vanishes for zero velocity, and is an external force. The disorder term has a Gaussian distribution with zero mean, and . Eq. (4) well describes diverse phenomena of kinetic roughening such as ballistic deposition or Eden modelsKardar86 but also the advancement of flux fronts in type II superconductors.Surdeanu99 This is due to the growth of the front height being perpendicular to the front itself, since the Lorentz force on the flux vortices reads . The KPZ model predicts well-defined roughness and growth exponents, and . In parallel, however, a wide variety of exponents has been reported in other systems, including wetting, imbibition, percolation, bacteria invasion, and so forth.Amaral94 ; Amaral95 Among different approaches to account for such phenomena, Barabási et al. proposed to apply the concept of multifractality to interface roughness.Barabasi91 ; Barabasi92 ; Santucci2007 Multifractality has been associated with a power-law distribution of the noise amplitude , that accounts for rare events in the roughening or growing process. It is also relevant for the roughening of linear polymers on percolation clusters. Janssen2007 ; Blavatska2010 ; Janssen2012 Alternatively, a multifractal formalism may be useful if different length scales compete in the growth process, or if depinning occurs at preferential sites. In those cases, rare events such as avalanches may drive the kinetic properties.Leschhorn94 ; Paczuski96
Regarding magnetic flux fronts in superconductors, Surdeanu et al.Surdeanu99 were the first to study different models to account for the roughening of the interface between the mixed state and Meissner phase in thin–film cuprate superconductors. The authorsSurdeanu99 distinguished two regimes in roughening and growth: the short–range interaction regime, well-described by the Directed Percolation Depinning (DPD) model,Amaral95 and the long–range regime, described by a usual 1+1-KPZ equation. By mapping the front progression through a quenched disorder potential on the problem of percolation, the DPD model predicts values and . On the other hand, Eq. (4) explicitly includes temporal fluctuations of the disorder. DPD-like behavior was also reported for flux penetration in Nb thin films on Si-substrates, over a narrow temperature window between smooth flux fronts at high , and an avalanche-dominated regime at low .Vlasko-Vlasov2004 The authorsVlasko-Vlasov2004 noted that the observed scaling might be due to KPZ behavior in the presence of spatially correlated (non-Gaussian) disorder.
In this paper we characterize the penetrating flux front in single crystals of the optimally–doped iron-based superconductor Ba(Fe0.93Co0.07)2As2 using the recently developed multi-scaling approach. The roughened front shows self-affine behavior, indicating non-Gaussian correlations of the disorder potential. Strikingly, the growth exponent is in agreement with the KPZ model. The multiscaling of the front roughness is clearly different from that produced by either avalanche dynamics in Nb thin films,Welling2004i ; Welling2004ii ; Aranson2005 or depinning of a ferroelectric domain wall from a mixture of strong and weak pinning sites.Guyonnet2012
We propose a tentative interpretation based on the findings of Ref. Demirdis2011, for Ba(Fe1-xCox)2As2. That work reports that nanometer-scale inhomogeneity of the superconducting properties is at the origin of the lack of even intermediate–range vortex positional order, and of the significant vortex density fluctuations observed on field cooling.Demirdis2011 Spatial variations of superconducting parameters such as the critical temperature, , or the superfluid density, , would result in a random network of more-or-less favorable sites, suggesting the analogy with a percolation cluster. Independent evidence for such nanoscale disorder in Ba(Fe1-xCox)2As2 was presented in Ref. Massee2009, . The difference in multi-scaling of the roughness and growth exponents suggests the percolation and aggregation of different clusters (front sections) with different fractal dimension.
II Experimental Details
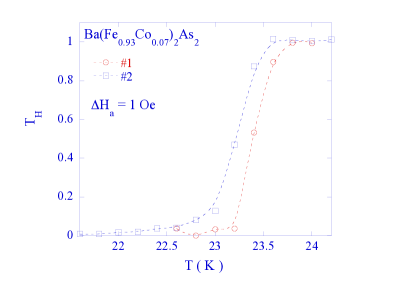
Optimally–doped Ba(Fe1-xCox)2As2 single crystals, with and critical temperature K, were grown using the self-flux method, as described in Ref. Rullier-Albenque2009, . The crystal composition was analyzed using a Camebax SX50 electron microprobe yielding the Co content within 0.5% absolute accuracy. Rectangular samples were cut from different crystals using a W wire saw (wire diameter 20 m) and 1 m SiC grit suspended in mineral oil. In particular, sample # 1 has a length of 994 m, a width of 571 m, and a thickness of 32 m. Its critical current density (at K) is . Sample # 2 has a length of 835 m, a width of 733 m, a thickness of 27 m, and . The penetration of magnetic flux into the selected samples was visualized by the magneto-optical imaging (MOI) method.Dorosinskii92 ; Uehara2010 A ferrimagnetic garnet indicator film with in-plane anisotropy is placed on top of the sample. A non-zero perpendicular component of the magnetic induction induces an out-of-plane rotation of the magnetization, and, thereby, a Faraday rotation of the polarization of light traversing the garnet. An Al mirror evaporated on the hind side of the garnet reflects the impinging light, which is then observed using a polarized light microscope with nearly crossed polarizer and analyzer. Regions with nonzero then show up as bright when observed through the analyzer. The differential magneto-optical techniqueDemirdis2011 was used to characterize the superconducting transition. Fig. 1 shows that these are rather narrow for the material under study, of the order of 0.5 K.
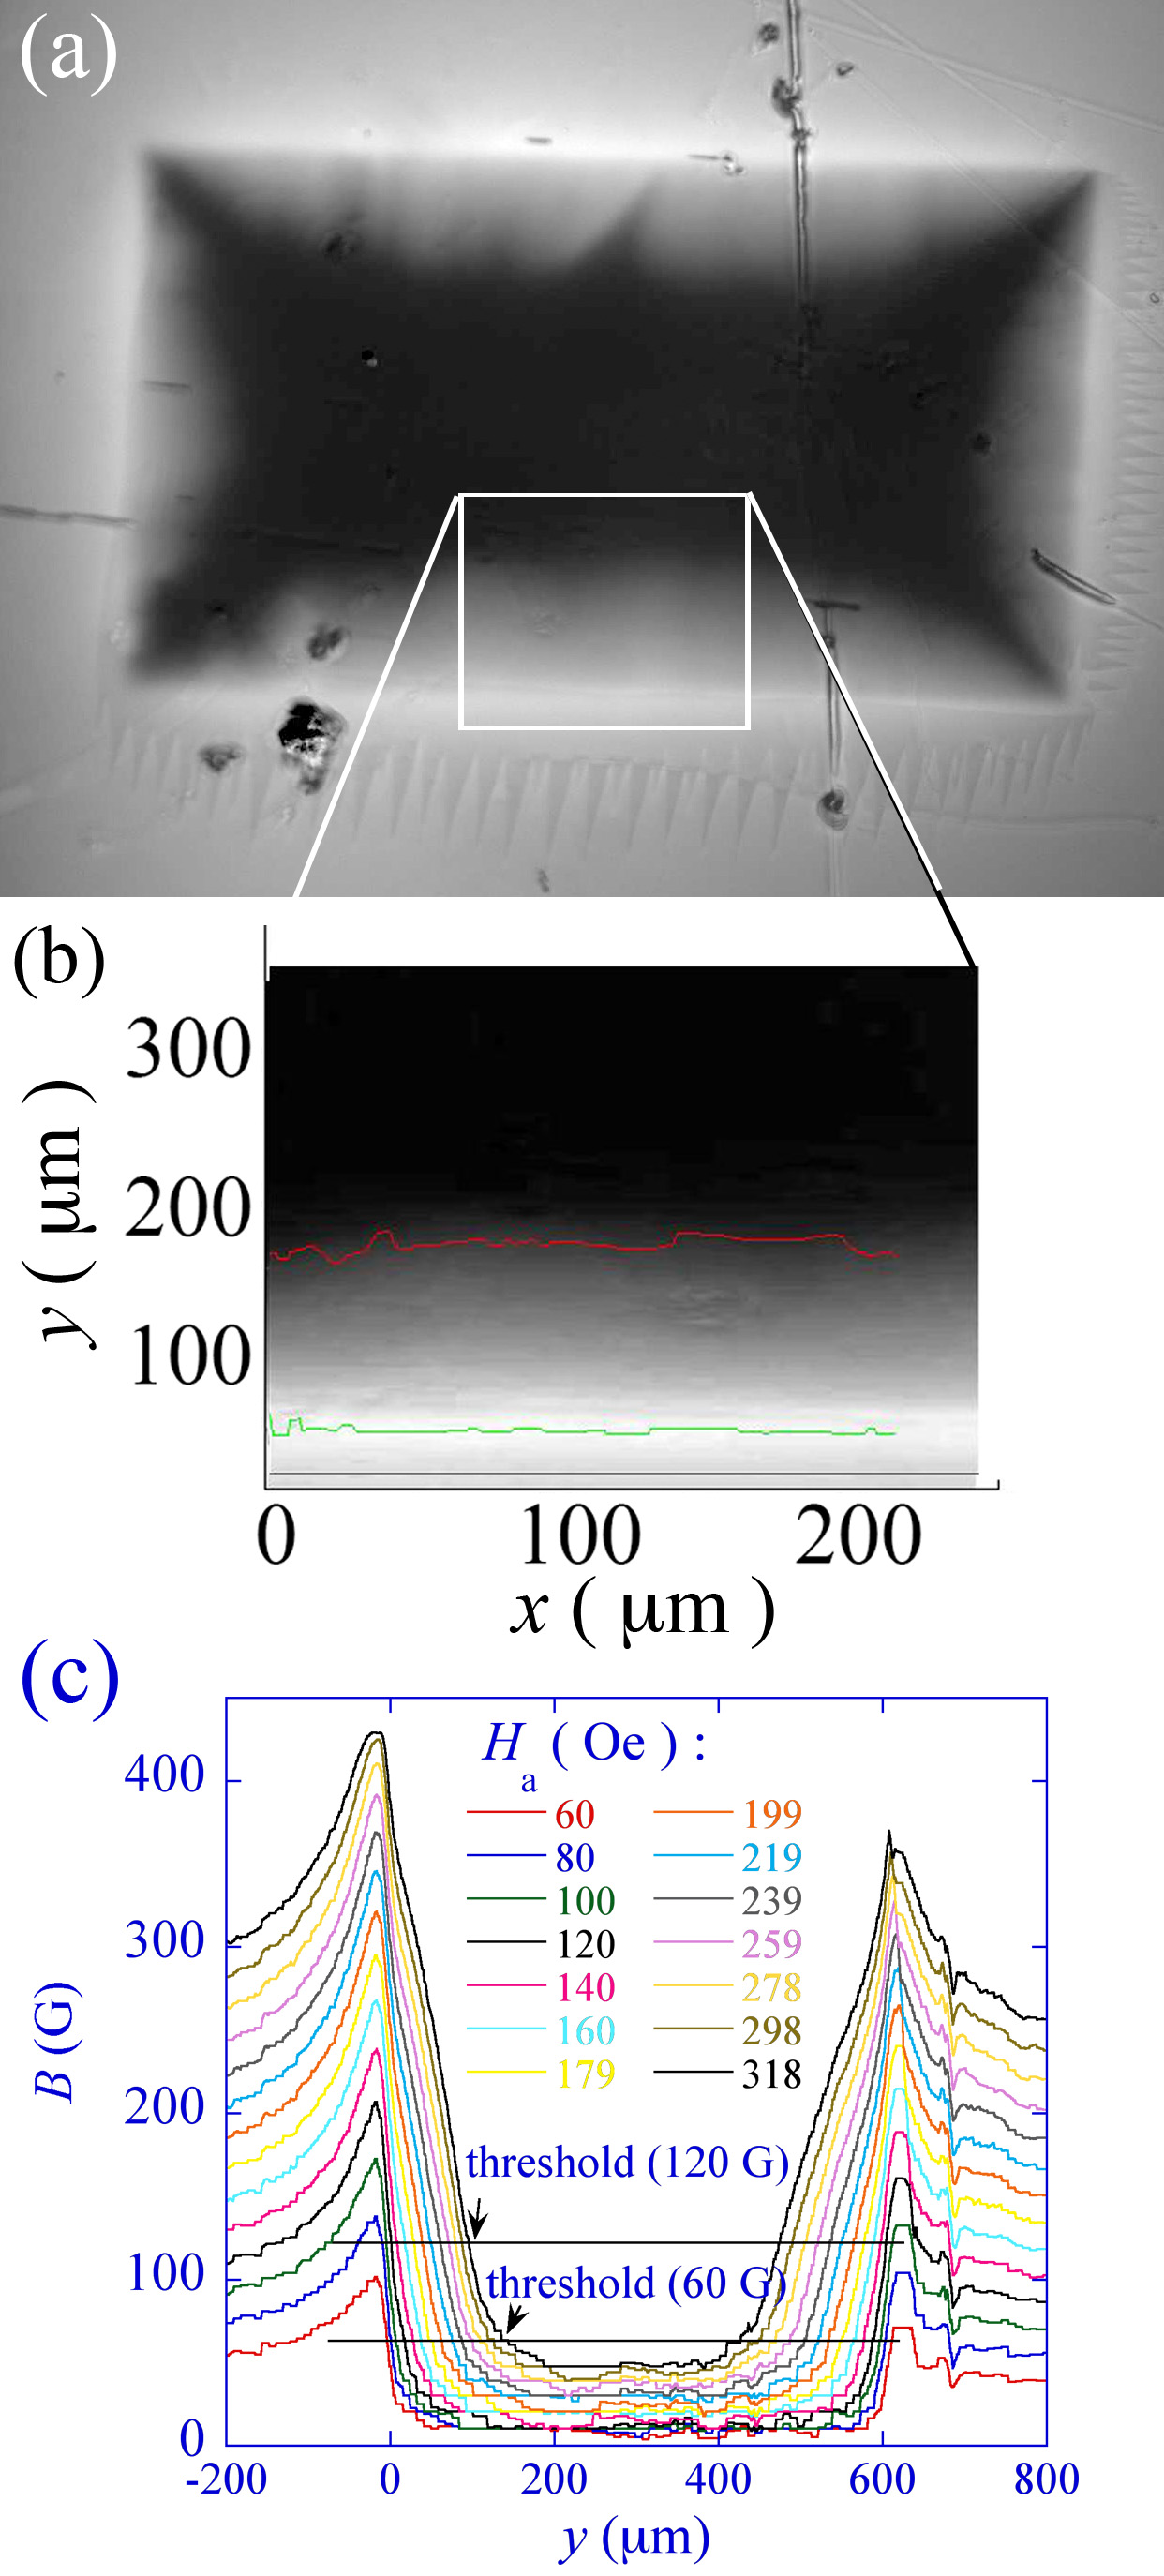
Fig. 2(a) shows the penetration of magnetic flux into Ba(Fe0.93Co0.07)2As2 sample 1, the rectangular outline of which is clearly seen. We shall be interested in the flux front within the sample, between peripheral bright regions of non-zero , and the dark central region of . This front corresponds to the interface between the mixed state, in which the superconductor is penetrated by vortex lines, and the Meissner phase of excluded magnetic flux. In order to avoid bias and distortions induced by the effect of the sample corners on the shape of the flux front, we have studied the penetration near the center of the sample edges only. At all measurement temperatures, the temperature stability was better than 10 mK; the external field was increased in 20 Oe steps in order to monitor the flux front progression.

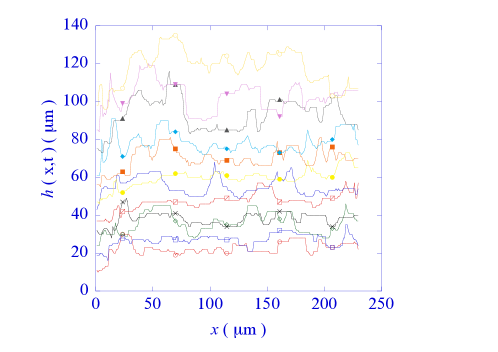
The MO images are converted to maps of the magnetic induction by calibrating the luminous intensity with respect to the applied field.Uehara2010 Next, the position of the flux front is determined from a given threshold level of the magnetic induction on the flux profiles. Using a non-zero threshold value avoids uncontrolled variations between experiments due to the specific luminosity and polarization conditions under which images are acquired. In all, 17 different threshold values between 40 and 200 G were used. The minimum threshold value that could be used for all applied field values was G. We define the height of the flux front as the distance between the position at which the magnetic induction is maximum at the sample boundary (), and the position of the intensity threshold, along a 1 pixel-wide strip perpendicular to the sample boundary. Such a definition eliminates the effect of possible shifts in the luminous intensity due to over-exposure of certain strips in the camera. An example of the progression of the flux front in sample # 1 determined by this method is shown in Fig. 3. In order to evaluate the correlation function (1), we subtract the mean position of the flux front , averaged over the 250 m–wide central section of the sample on which the analysis is performed.
In order to observe the flux front morphology on a finer scale, and, notably, to investigate the occurence of coalescing clusters, Bitter decorationfasano experiments were performed on the same samples after zero-field cooling to 4.2 K and the application of a field of 50 Oe. Typical results (on sample #1) are shown in Fig. 4. The image shows individual vortex lines as these enter the crystal from the lower edge. Note that the intervortex distance near the edge m. Similar images were obtained along all four sample edges.
III Analysis of the Flux Front
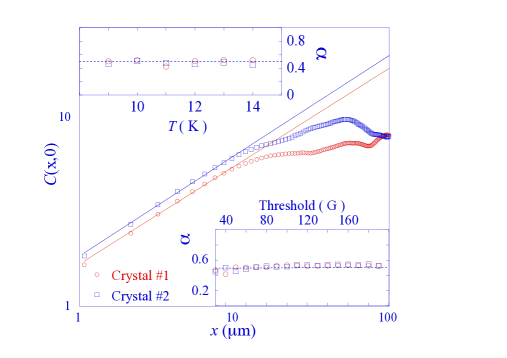
The main panel of Fig. 5 shows the spatial correlation function , describing the roughness of the flux front penetrating from the lower edge of sample # 1 at K. The value of determined from the logarithmic slope of versus is very close to the value derived in the KPZ model, .Barabasi95 In this respect, our data are similar to those of Ref. Surdeanu99, . The constant value of for m indicates that deformations of sections of the flux front separated by more than 10 m are independent. The value of is possibly related to the (similar) dimensions of independently penetrating vortex clusters, to be discussed below.
In order to ascertain the robustness of these results, we have checked for temperature and vortex density dependence. At sufficiently low flux densities the distance between vortex lines exceeds . Since increases with , the interaction between vortices also increases with within this -range (for a fixed vortex density). On the contrary, at higher vortex densities , and the repulsive interaction decreases with . Hence, vortex lines are not sensitive to the same length scales of disorder for different and , so that, for non-trivial correlations of the disorder, a continuous evolution of might be expected. However, the upper inset to Fig. 5 clearly shows that the roughness exponent does not depend on temperature.
Investigating the dependence of the roughness exponent on vortex density corresponds to probing its dependence on the threshold value. The constant as function of threshold, displayed in the lower inset to Fig. 5, is consistent with the lack of dependence on temperature, since both imply that the front roughness is insensitive to the strength of the vortex interaction. In other words, the scaling properties of the flux front will depend only on the kind of disorder and on the manner in which the front deformations are relaxed.
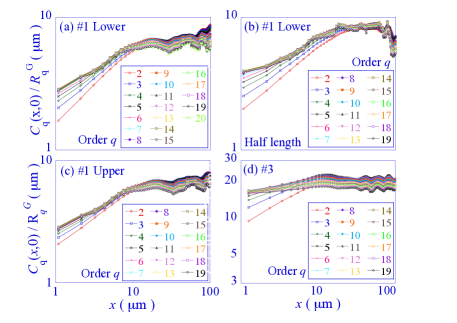
We now turn to the multiscaling analysis of the data. The methodSantucci2007 ; Blavatska2010 ; Guyonnet2012 relies on the computation of the higher-order two–point correlation function
| (5) |
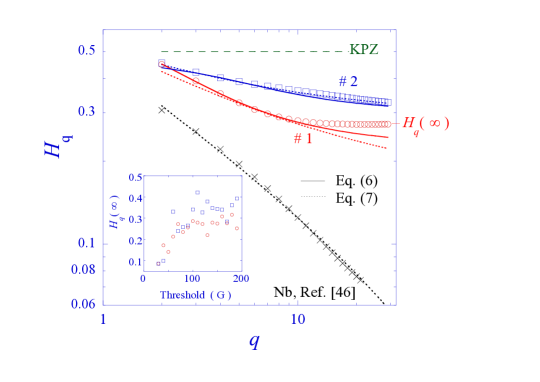
Following previous work,Barabasi91 should scale as , with the generalized Hurst exponent. A non-trivial -dependent scaling is the hallmark of a non-Gaussian probability density function (PDF) of the disorder, leading to a self-affine (but not self-similar) interface.Barabasi91 More generally, it may indicate multifractal behavior, i.e the geometry of the interface is not simply fractal but implies many different geometries of many different fractal dimensions.Duplantier99 On the contrary, a constant is representative of KPZ behavior and of an interface with a Gaussian PDF (see Ref. Barabasi92, and Fig. 7). Figure 6 shows the higher order two-point correlation functions evaluated on the flux fronts in sample # 1 and # 3, normalized by the factors ,Santucci2007 ; Guyonnet2012 with ranging from 2 to 20. Here, the correlation functions are those that would be obtained for an interface with a Gaussian PDF of the local displacements.Santucci2007 ; Guyonnet2012 We note that the same multiscaling is observed even when a subsection of the investigated front [Fig. 6(a) and (b)] or a different edge of the sample is considered, see Fig. 6(c). Figure 7 shows the behavior of the exponent as a function of for the magnetic flux fronts in our Ba(Fe0.93Co0.07)2As2 crystals. is observed to saturate to a sample–dependent value at large . From Figs. 6 and the exponent rendered in 7, it is clear that, for small , the scaling with length depends on the order in a non-trivial manner. The analysis of different sections of the same flux fronts yields an identical –dependence. The -evolution on the opposite side of the same sample, and for flux fronts in the other investigated samples is similar in character, but not identical.
The -dependence of the Hurst exponent describing the flux fronts in Ba(Fe0.93Co0.07)2As2 is remarkably well-rendered by the simple toy model used in Ref. Barabasi91, to prove the relevance of multi-scaling for the description of self-affine fractal interfaces,Barabasi91
| (6) |
Here and are the scaling parameters characterizing the self-affine interface structure parallel and perpendicular to the growth direction, such as these are used in Ref. Barabasi91, for the construction of a model interface. The experimental values, ( and for samples # 1 and # 2, respectively, clearly demonstrate the irrelevance of a Gaussian PDF for the transverse excursions of the flux front in Ba(Fe0.93Co0.07)2As2, which would yield a constant roughness exponent . A self-similar interface with Gaussian PDF can be generated in the toy modelBarabasi91 by using .
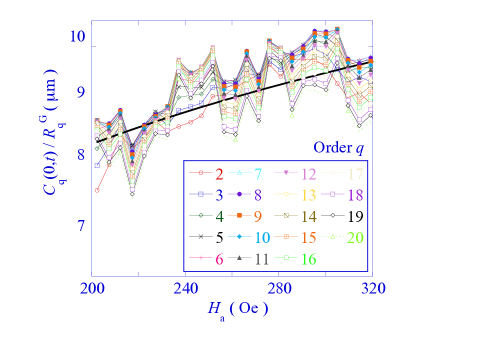
We have also evaluated multiscaling of growth of the flux front height. Figure 8 shows that the temporal correlation functions are parallel for all , and scale with the Gaussian factors ( is the rate at which is increased). The temporal correlation functions obey the same power-law behavior, . We consider this value to be in agreement with from KPZ theory. We thus find, surprisingly, that the evolution of the flux fronts in the Ba(Fe0.93Co0.07)2As2 samples corresponds to the diffusive growth of a multi-fractal structure.
IV Discussion
A number of propositions have been made to explain the origin of multifractality and multiscaling. A non-Gaussian, e.g. power–law, PDF underlying the disorder term was introduced for the description of percolative imbibition of paper by a fluid.Buldyrev92 The link between penetrating flux fronts and the porous medium equation for the imbibition by fluids was previously pointed out in Refs. Surdeanu99, and Gilchrist94, . However, the porous medium equation as such, as analyzed in Ref. Gilchrist94, , does not lead to (multi–) fractal behavior.
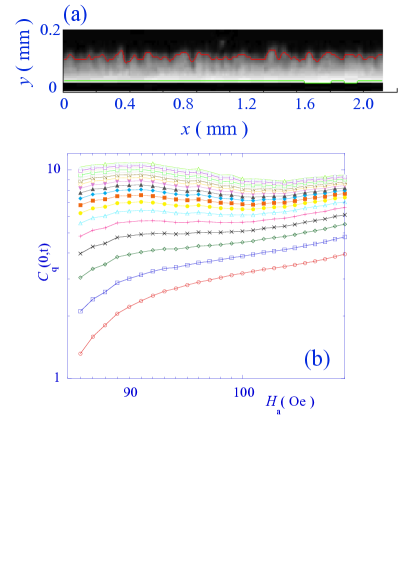
A second explanation for anomalous scaling in roughening processes is the occurrence of avalanches.Paczuski96 ; Bassler98 ; Bassler99 ; Aegerter2003 ; Aegerter2004 The numerical work of Bassler et al. showed the possible multi-fractal character of braided vortex trajectories resulting from avalanches in a strongly pinning superconductor.Bassler99 The effect of local temperature variations on the nucleation and propagation of dendritic vortex avalanches was investigated experimentally by Welling et al.,Welling2004i ; Welling2004ii who studied thin superconducting Nb films deposited on sapphire substrates of various orientations. The authorsWelling2004i ; Welling2004ii found that, in 500 nm-thick Nb deposited on A–plane sapphire, flux penetration at low temperature ( K) takes place via huge compact avalanches, while at K it is more regular, yielding continuous flux fronts. The latter bear a certain resemblance to those observed in the present work. Numerical work by Aranson et al.Aranson2005 suggests that avalanches in defect-free films occur at periodic locations, while avalanches in films with edge defects are initiated at these imperfections. With this in mind, it was suggestedAranson2005 that both avalanche–like and more regular flux penetration in Nb/A–plane sapphire is initiated by edge defects. In order to ascertain whether the roughened flux fronts in Ba(Fe0.93Co0.07)2 have a similar origin, we have analyzed the structure of the continuous flux fronts ( K) reported in movie 8 of Ref. Supplemental, , which shows flux penetration such as that reproduced in Fig. 9(a). To perform this analysis, we considered a threshold of 10 % of the applied field. The analysis of the correlation function (5) shows that the flux fronts in this Nb thin film show multi-scaling behavior (Nb data in Fig. 7). The Hurst exponent starts off with a lower value , and decreases as a near power–law to zero as increases. Contrary to our results on Ba(Fe0.93Co0.07)2As2, this curve is not satisfactorily described by Eq. (6). Moreover, the high-temperature flux penetration as shown in Ref. Welling2004ii, , Aranson2005, , and Supplemental, does obey multi-scaling during growth, see Fig. 9(b). An explanation for this is that even at temperatures higher than 6 K, the “regular” flux penetration in Nb thin films would be the result of the superposition of many avalanches. The observed -dependence would then be induced by the avalanche size distribution, which follows a power–law distribution in space and time.
Clearly, the roughening and growth of the flux front observed in Ba(Fe0.93Co0.07)2As2 crystals is dissimilar from the superposition of thermo-magnetic avalanche-like instabilities as observed in the case of Nb thin films. A more pertinent analogy may be that suggested by the analysis of roughened ferroelectric domain walls.Guyonnet2012 Ref. Guyonnet2012, reports on “mono-affine” scaling of the domain-walls, with a Gaussian PDF of its local transverse displacements, on small length scales, both in numerical simulations as in actual experiments on Pb(Zr0.2Ti0.8)O3. Such a mono-affine behavior corresponds to so-called “weak-collective pinning”, in which the domain walls are only pinned by the fluctuations in the pin density. Analysis on larger length scales showed “multi-affine scaling” described by a non-trivial hierarchy of higher-order scaling exponents. The crossover length scale in the studyGuyonnet2012 was given by that on which rare events in the form of strongly pinning defects, such as dislocations, occur. Translated to our experiments, this would correspond to the mono-affine (KPZ-like) growth of individual front sections emanating from specific sections of the boundary of the superconducting crystal, separated by sections from which flux penetration is less likely. Such edge inhomogeneity might then be interpreted in terms of the local variation of superconducting propertiesDemirdis2011 and / or geometrical irregularities at the sample edges. However, in our analysis multiscaling is found to be the same irrespective of considering the entire length of the flux front (see Fig. 2(b)) or a subsection thereof (see Fig. 6).
A third possibility is the growth and coalescence of front sections with different fractal geometry, arising from different disorder realizations in distinct parts of the Ba(Fe0.93Co0.07)2As2 crystals. Such heterogeneity may be expected, e.g., from the analysis of the highly disordered vortex ensembles observed using Bitter decoration.Demirdis2011 The interaction–energy distribution of these ensembles could be understood only if one admits the presence of substantial spatial heterogeneity of the superconducting parameters, on the scale of 10 – 100 nm. Front sections with different roughness characteristics would then show diffusive growth, according to the KPZ description, but form an anomalously roughened front upon coalescence. Coalescence was considered in the numerical study of linear polymers on percolation clusters by Blavatskaa and Janke.Blavatska2010 They proposed that multiscaling could arise from the merger of two fractal structures of different dimensions, keeping their underlying geometry in the process.Blavatska2010 Once a cluster is formed, its temporal roughening is characterized by a certain growth exponent; the cluster retains the same geometry and dimension during growth. This behavior could account for both the observed temporal monoscaling growth behavior and the multifractal roughening upon the collision of two roughened structures. Indeed, Fig. 4 shows evidence for percolative penetration of vortices at the very interface of the mixed state and the Meissner state in Ba(Fe0.93Co0.07)2As2. Vortex lines are seen to penetrate the sample in an irregular fashion, the flux front on the m–scale featuring peninsula–like protrusions separated by vortex–free areas. These features then coalesce to generate a continuous front.
A description of both the coarse-graining of the flux front as one goes from individual vortex-resolution (Fig. 4) to the magneto-optical images of Fig. 2, and the non-trivial -dependence of the coarse-grained flux–front is suggested by the results of Ref.Duplantier99, . The authorDuplantier99 considered percolative growth in two dimensions, both for random and self-avoiding walks. The –dependence of the exponent describing the metric of the harmonic measure of a two–dimensional near-critical percolation cluster is given by
| (7) |
with , , and [Eq. (5) of Ref. Duplantier99, ]. The harmonic measure of a percolation cluster is characterized by a lower dimension than the cluster itself, due to the inaccessibility of sites situated on deep “fjords” on the latter. Aggregation at certain sites on the percolation cluster would correspond to the growth of the flux front at specific locations due to the arrival of a vortex line. Eq. 7 very well describes the experimental –dependence of Fig. 7, including that for the flux front in Nb thin films, for very similar parameter values. This would imply that the flux-front in heterogeneous type-II superconductors can be described as the hull of a near-critical percolation network.
V Summary and Conclusions
We have measured and analyzed magnetic flux-penetration fronts in single crystals of the optimally–doped iron based superconductor Ba(Fe0.93Co0.07)2As2, over a wide range of temperatures. Analysis reveals multi-scaling of the higher–order two-point spatial correlation functions of the roughened flux front. This implies that the roughness of the front cannot be described by simple diffusive behavior, that is, by disorder with a Gaussian probability density function. By implication, the multi-scaling approach is a powerful tool to distinguish between the different properties at the origin of interface roughening. Scaling of the flux-front roughness does not depend on temperature or the induction threshold used to define the front position, nor on macroscopic defects that may exist in particular samples. In contrast, a regular KPZ-like growth of the flux-front is found, excluding avalanche–like behavior as being at the origin of the front roughening. We propose an interpretation of our results in terms of multi–fractal roughening due to the aggregation of vortex clusters with various fractal dimensions. Such clusters could in fact be identified using Bitter decoration, which reveals the structure of the flux front on the scale of individual vortex lines. Once the macro cluster is formed, the front develops in time (i.e. with increasing magnetic field) with a classical KPZ exponent. We tentatively decribe this unusual roughening by a theory for the harmonic measure of a two-dimensional percolation hull.Duplantier99 Our results underscore the analogy between percolation in porous media and vortex penetration in inhomogeneous superconductors.
Acknowledgements
This work was partially funded by the grant “MagCorPnic” of the Réseau Thématique de Recherche Avancée “Triangle de la Physique” du Plateau de Saclay, by the Agence Nationale de la Recherche grant "PNICTIDES", and by the support of the ECOS-Sud-MINCyT France-Argentina bilateral program, Grant No. A09E03. Work done in Bariloche was partially funded by PICT 2007-00890 and PICT 2008-294.
References
- (1) C.P. Bean, Phys. Rev. Lett. 8, 250 (1962).
- (2) E. Zeldov, J.R. Clem, M. McElfresh, and M. Darwin, Phys. Rev. B 49, 9802 (1994).
- (3) Ernst Helmut Brandt, Phys. Rev. B 54, 4246 (1996).
- (4) Ernst Helmut Brandt, Phys. Rev. B 58, 6506 (1998).
- (5) Ernst Helmut Brandt, Phys. Rev. B 58, 6523 (1998).
- (6) Grigorii P. Mikitik and Ernst Helmut Brandt, Phys. Rev. B 62, 6800 (2000).
- (7) Grigorii P. Mikitik and Ernst Helmut Brandt, Phys. Rev. B 62, 6812 (2000).
- (8) R. Surdeanu, R. J. Wijngaarden, E. Visser, J. M. Huijbregtse, J. H. Rector, B. Dam, and R. Griessen, Phys. Rev. Lett. 83, 2054 (1999).
- (9) R. Surdeanu, R. J. Wijngaarden, B. Dam, J. Rector, R. Griessen, C. Rossel, Z. F. Ren, and J. H. Wang, Phys. Rev. B 58, 12 467 (1998)
- (10) S. He, G. L. M. K. S. Kahanda, and P-Z. Wong, Phys. Rev. Lett. 69, 3731 (1992).
- (11) J. Maunuksela, M. Myllys, O.-P. Kähkönen, J. Timonen, N. Provatas, M. J. Alava, and T. Ala-Nissila, Phys. Rev. Lett. 79, 1515 (1997).
- (12) Romualdo Pastor-Satorras, Phys. Rev. E 56, 5284 (1997).
- (13) C. M. Aegerter, R. Günther, and R. J. Wijngaarden, Phys. Rev. E 67, 051306 (2003).
- (14) C. M. Aegerter, K. A. Lörincz , M. S. Welling, and R. J. Wijngaarden, Phys. Rev. Lett. 92, 058702 (2004) .
- (15) Kinga A. Lörincz, and Rinke J. Wijngaarden Phys. Rev. E 76, 040301(R) (2007).
- (16) D. V. Denisov, Y. Y. Villanueva, K. A. Lörincz, S. May, and R. J. Wijngaarden, Phys. Rev. E 85, 051309 (2012).
- (17) W. E. Hagston and H. Ketterl, Phys. Rev. E 59, 2699 (1999).
- (18) A.-L. Barabási and H. E. Stanley, in Fractal Concepts in Surface Growth (Cambridge University Press, Cambridge, U.K., 1995).
- (19) Mehran Kardar, Giorgio Parisi, and Yi-Cheng Zhang, Phys. Rev. Lett. 56, 889 (1986).
- (20) L.A. Nunes Amaral, Albert-László Barabási, and H. E. Stanley, Phys. Rev. Lett. 73, 62 (1994).
- (21) Luís A. Nunes Amaral, Albert-László Barabási, Hernán A. Makse, and H. Eugene Stanley, Phys. Rev. E 52, 4087 (1995).
- (22) Albert-László Barabási and Tamás Vicsek, Phys. Rev. A 44, 2730 (1991).
- (23) Albert-László Barabási, Roch Bourbonnais, Mogens Jensen, János Kertész, Tamás Vicsek, and Yi-Cheng Zhang, Phys. Rev. A 45, R6951 (1992).
- (24) Stéphane Santucci, Knut Jørgen Måløy, Arnaud Delaplace, Joachim Mathiesen, Alex Hansen, Jan Øistein Haavig Bakke, Jean Schmittbuhl, Loïc Vanel, and Purusattam Ray, Phys. Rev. E 75, 016104 (2007)
- (25) Hans-Karl Janssen, Olaf Stenull, Phys. Rev. E 75, 020801(R) (2007).
- (26) Viktoria Blavatska and Wolfhard Janke, Physics Procedia 3, Issue 3, 1431–1435 (2010).
- (27) Hans-Karl Janssen, Olaf Stenull, Phys. Rev. E 85, 011123 (2012).
- (28) Heiko Leschhorn and Lei-Han Tang, Phys. Rev. E 49, 1238 (1994).
- (29) Maya Paczuski, Sergei Maslov, and Per Bak, Phys. Rev. E 53, 414 (1996).
- (30) S.V. Buldyrev, A.-L. Barabási, F. Caserta, S. Havlin, H.E. Stanley, and T. Vicsek, Phys. Rev. A 45, R8313 (1992).
- (31) V.K. Vlasko-Vlasov, U. Welp, V. Metlushko, and G.W. Crabtree, Phys. Rev. B 69, 140504(R) (2004).
- (32) M.S. Welling, C.M. Aegerter, R.J. Westerwaal, S. Enache, R.J. Wijngaarden, Physica (Amsterdam) C 406, 100 (2004).
- (33) M.S. Welling, R.J. Westerwaal, W. Lohstroh, R.J.Wijngaarden, Physica (Amsterdam) C 411, 11 (2004).
- (34) Igor S. Aranson, A. Gurevich, Marco S. Welling, Rinke J. Wijngaarden, Vitalli K. Vlasko-Vlasov, Valerii M. Vinokur, Ulrich Welp, Phys. Rev. Lett. 94, 037002, (2005).
- (35) J. Guyonnet, E. Agoritsas, S. Bustingorry, T. Giamarchi, P. Paruch, Phys. Rev. Lett. 109, 147601 (2012).
- (36) S. Demirdiş, C. J. van der Beek, Y. Fasano, N. R. Cejas Bolecek, H. Pastoriza, D. Colson, and F. Rullier-Albenque, Phys. Rev. B 84, 094517 (2011).
- (37) F. Massee, Y. Huang, R. Huisman, S. de Jong, J. B. Goedkoop, and M. S. Golden, Phys. Rev. B 79, 220517 (2009).
- (38) F. Rullier-Albenque, D. Colson, A. Forget, and H. Alloul, Phys. Rev. Lett. 103, 057001 (2009).
- (39) L. A. Dorosinskĭi, M. V. Indenbom, V. I. Nikitenko, Yu.A. Ossip‘yan, A. A. Polyanskii, and V. K. Vlasko-Vlasov, Physica (Amsterdam ) C 203, 149 (1992).
- (40) M. Uehara, C. J. van der Beek, J. Gattacceca, V. A. Skidanov, and Y. Quesnel, Geochem. Geophys. Geosyst. 11, Q05Y09 (2010); doi:10.1029/2009GC002653.
- (41) Y. Fasano and M. Menghini, Supercond. Sci. Technol. 21 023001 (2008).
- (42) B. Duplantier, Phys. Rev. Lett. 82, 880 (1999).
- (43) J. Gilchrist and C.J. van der Beek, Physica (Amsterdam) C 231, 147 (1994).
- (44) Kevin E. Bassler and Maya Paczuski, Phys. Rev. Lett. 81, 3761 (1998).
- (45) Kevin E. Bassler, Maya Paczuski, and George F. Reiter, Phys. Rev. Lett. 83, 3956 (1999).
- (46) This material can be reached as EPAPS document No. E-PRLTAO-94-002506 via the EPAPS homepage (ftp://ftp.aip.org/epaps/phys rev lett/E-PRLTAO-94-002506/ )