Cherenkov and Jansky: Our Understanding of AGN at the Highest Energies
Abstract
Misaligned blazars have been the subject of some of the most successful radio and gamma-ray multiwavelength campaigns. These campaigns have included many of the major ground and space based gamma-ray telescopes and span decades of energy. Even though misaligned blazars account for only a small number of the total AGN detected at VHE, they provide a unique view on the AGN population. By viewing blazars at larger angles to our line of sight, they become a unique laboratory for the study of AGN jet substructure and the morphology of non-thermal emission processes. This contribution will discuss our understanding of three VHE misaligned blazars.
I Introduction
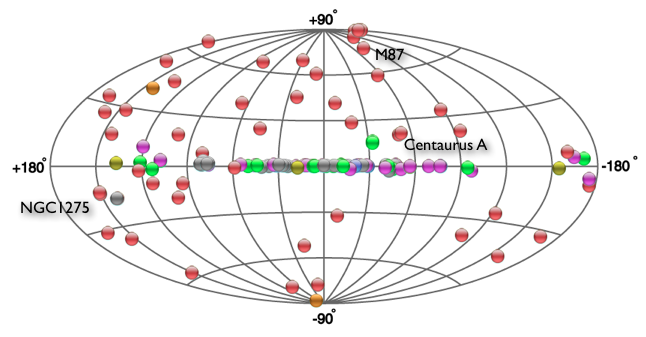
-ray astronomy has made major advances in the last decade. The construction and operation of the current generation of very high energy (VHE; E 100 GeV) instruments like VERITAS, HESS and MAGIC have resulted in the detection of more than 120 VHE sources (see Figure 1). The launch of the Fermi satellite (Atwood et al., 2009) has opened new windows on the high energy (HE; 100 MeV E 100 GeV) sky. Individually, these instruments have produced many good results, but the fact that they can perform multiwavelength studies increases their scientific output dramatically. It is important to remember that all of the work presented here is the result of collaborations between many excellent people, not only in VERITAS and Fermi but in MAGIC and HESS and many, many radio scientists.
The field of VHE astronomy is necessarily ground based (see Hiton and Hofmann (2009) for a review). You cannot get enough effective area at these energies with a space based instrument, while the ground based techniques result in an effective area the size of a football field for the current generation of telescopes. These large effective areas are possible due to the Cherenkov technique employed by the VHE community. There are three major arrays in use right now: VERITAS, HESS and MAGIC and the field continues to move forward, there are upgrades in progress (HESS2 (Moudden et al., 2011), VERITAS upgrade (Kieda et al., 2011)) and completed (MAGIC2 (Lombardi et al, 2011)). Also, a new generation of instruments is coming online in the next years (HAWC (González, 2011), CTA (CTA Consortium, 2011)).
There are over 120 VHE sources in the catalog (http://tevcat.uchicago.edu). The most populous class of objects (about 40) are blazars and a handful of these are misaligned blazars (see Figure 2). It is important to note that all of the misaligned blazars are also Fermi LAT sources, allowing a simultaneous measurement of the -ray SED. This is not the place for a review of AGN physics but the basic understanding is that these objects contain a central supermassive black hole surrounded by an accretion disk that powers a relativistic jet of photons and particles. The orientation of this jet towards the observer determines the source type: a jet pointed directly at the earth is seen as a BL Lac object or FSRQ while one that is misaligned is seen as some type of radio galaxy. There are many open questions that we are trying to answer by studying AGN at -ray wavelengths including: determining the emission mechanisms, understanding the accretion physics, and finding the emission location.
II Misaligned Blazars
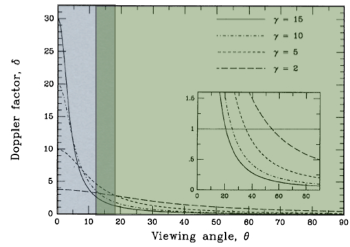
Only a handful of the detected VHE AGN are misaligned. The reason for this can be readily understood by looking at Figure 2. Blazar emission benefits from high Doppler and Lorentz factors which boost the flux and energy of the detected -rays and increases the detection probability. Jet emission is still possible at large viewing angles but the Doppler factor will be small and thus these types of objects are harder to detect at VHE. It is thought that the same emission mechanism that occurs in blazars is what is seen in these misaligned AGN and so the same types of models could be used to understand the observed SED (Urry and Padovani, 1995). Additionally, there is also the possibility to see lobe emission from regions outside of the core (as is seen in Centaurus A from the LAT (Abdo et al., 2010a)).
The complete study of misaligned AGN is only possible through multiwavelength studies. The main reason for this is that these sources emit photons throughout the electromagnetic spectrum and to accurately understand the emission mechanisms, you need measurements all the way from the radio to the -ray. A complication is that these sources are known to be highly variable and thus, you not only need multiwavelength studies, but simultaneous multiwavelength studies. These are difficult, but the payoff is great since we can learn about the AGN population as a whole by fitting these types of objects into a general AGN emission model. We learn new things about the diverse AGN class by observing AGN of different types.
II.1 NGC1275
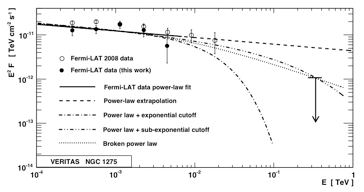
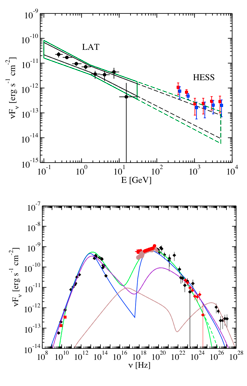
NGC 1275 is a radio galaxy at the core of the Perseus cluster. It was initially detected at GeV energies in three months of Fermi observations (Abdo et al., 2009). This indicated strong evidence for variability since it was detected by COS B (Strong et al., 1982) but not by EGRET. Observations with VERITAS did not yield a detection at VHE energies but the upper limit combined with the LAT measurements indicated that the full SED is not compatible with a single power law (Acciari et al. (2009), Figure 3).
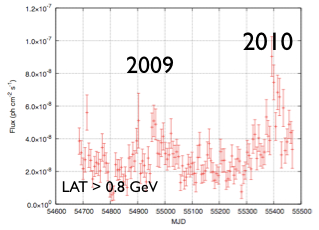
The VERITAS observations were prompted by flaring seen in 2009 (Figure 4) along with hardening in GeV (Acciari et al., 2009). There was another large flare seen in 2010 along with a VHE detection (60 - 400 GeV) by MAGIC also prompted by the detection of GeV flaring by the LAT (Donato et al., 2010). It is thought that these flares might correlate with flares in the radio and it will be important in the future to trigger TeV observations off of radio/GeV flares since no VHE emission has been seen during low states.
II.2 Centaurus A
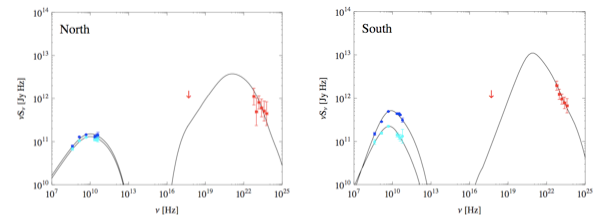
Centaurus A at a distance of 3.7 Mpc is the nearest radio galaxy and contains some impressive (10 degrees in extent) radio lobes. The LAT has detected emission from both the lobes and the core (Abdo et al., 2010b, a) which indicated that inverse Compton emission was the source of the MeV/GeV emission in the lobes (Figure 6). The basic understanding is that the -ray emission is scattered CMB and EBL photons and this determination allows the measurement of the lobe magnetic field ( 1 G, near equipartition). The dominant inverse Compton (determined from the ratio of the energy desity of the CMB and the lobe magnetic field: Ucmb/Ub 10) component indicates that the magnetic field is lower than that seen in other radio sources. Looking at the model in Figure 6 it is apparent that there should be detectable hard X-ray emission but no evidence of such has been found (Bechmann et al., 2011). Archival hard X-ray observations from SAS-3 (Marshall and Clark, 1981) are shown as upper limits in Figure 6.
In addition to modelling the emission mechanism of the -ray photons from the lobes of Cen A, the initial observations allowed the LAT team to probe the EBL since the inverse Compton/EBL interaction dominates above 1 GeV. Unfortunately, the statistics required to differentiate models is greater than that allowed by the inital 10 month data set (Abdo et al., 2010a). Deeper analysis using the full 3 year data set is underway.
One of the most exciting developments in VHE astrophysics over the last several years is the opening up of new populations with long-term observations and novel analysis techniques. Centaurus A is one of those sources. It was detected in a long (120 hour) observation by HESS (Aharonian et al., 2009). The interesting thing is that the VHE and HE spectra are barely consistent with each other (see Figure 5). The understanding of this issue is unknown at the moment but one thing to note is that if FR I’s are the parent population of blazars, than an SSC model should fit the SED but a simple SSC cannot explain the VHE emission (see Figure 5). If one allows for the optical and radio emission to come from a different component than the high energy emission, an SSC scenario can explain the X-ray to VHE emission (Lenain et al., 2008).
II.3 M87
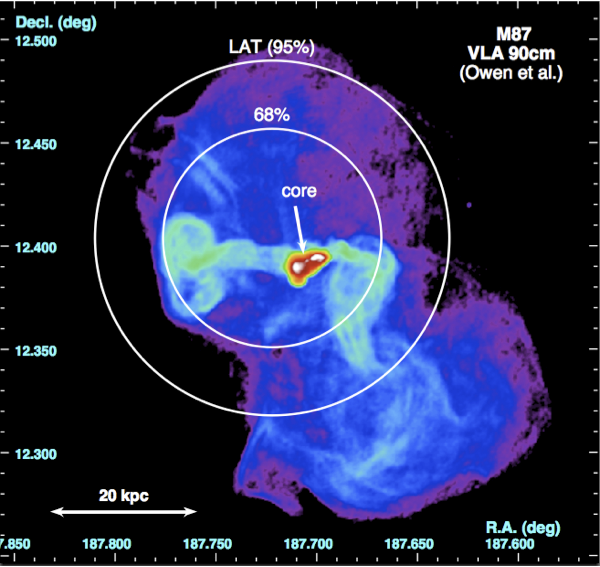
The view of M87 in the radio is impressive. At 90 cm, the jet outflows terminate in a halo roughly 80 kpc from the core. At the scale of a few kpc you can see several knots in X-rays, optical and radio wavelengths. M87 is the only non-blazar AGN detected by the previous generation of VHE instruments (a strong hint of emission at the 4 sigma level was seen by HEGRA (Aharonian et al., 2003)). Since it is close (16 Mpc ) you do not have to worry about EBL attenuation and you can resolve the impressive jet structure in the radio. The mass of the central black hole is assumed to be . Due to the PSF of VHE and HE instruments, the jet structure of M87 cannot be resolved at the highest energies (see Figure 7) but by leveraging multiwavelength observations, flares can be associated with specific knots and other emission regions. The LAT emission can be adequately modeled using a 1 zone SSC model assuming a moderate jet beaming of 2 - 4 (Abdo et al., 2009).
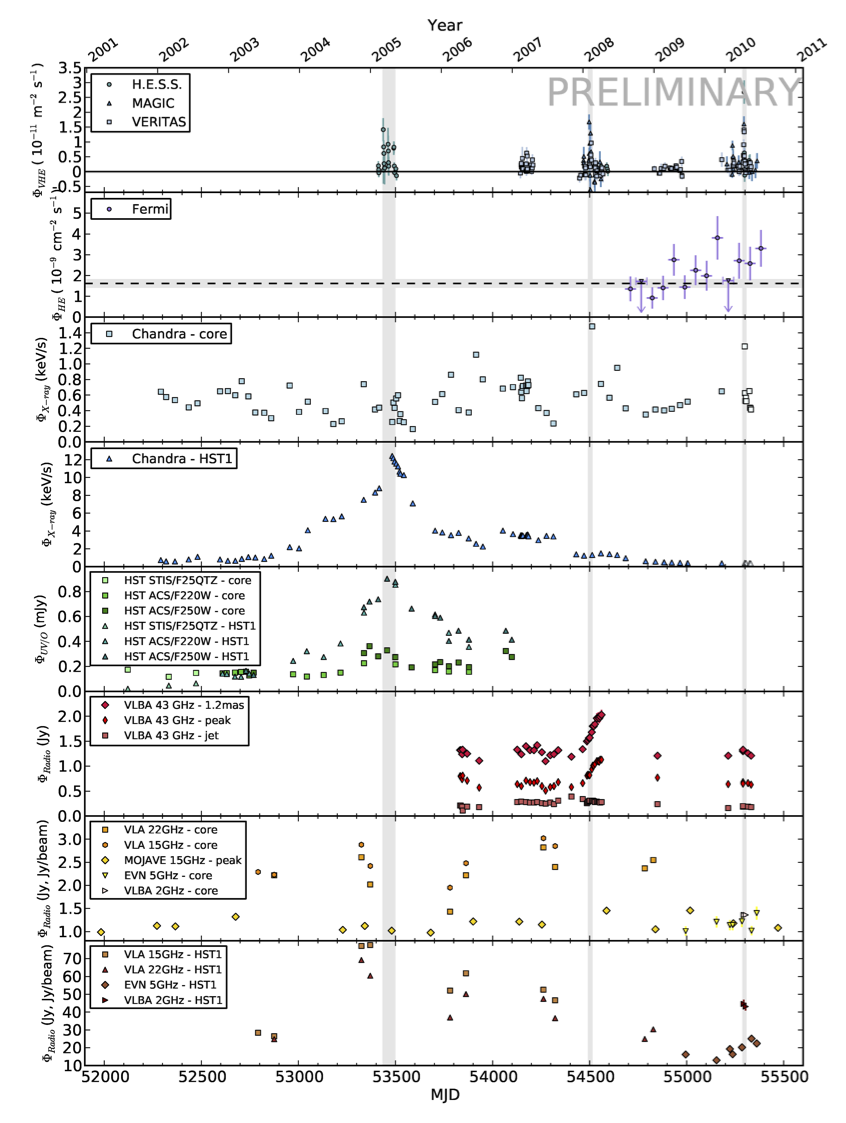
The history of determining the source of the VHE emission is muddled. Figure 8 shows the full 10 year lightcurve of M87 plotting joint observation campaigns (synchronized and ToO) of VERITAS, MAGIC, HESS, Fermi, Chandra, HST, VLA and VLBA (Abromowski et al., 2012). The coordination and effort needed to produce such a figure is impressive. The first flare at VHE (indicated by the first vertical grey line) was seen in 2005 and it coincided with flaring at other wavelengths in the knot HST-1, located more than 120 pc from the core. The conclusion of these observations was the VHE emission was most likely originating in that knot (Aharonian et al., 2006). It is important to note that when either the HST-1 knot or the core is X-ray bright, it contaminates the flux of the other feature.
In 2008 a large flare was seen by all three major VHE instruments (VERITAS, MAGIC and HESS) and a dedicated multiwavelength campaign was initiated (Figure 9). During this flare, the VHE emission rose to 10% of the Crab Nebula’s flux, the largest flux from this galaxy to date and emission was seen to rise in the X-ray and radio for the core. The conclusion of these observations was that the emission originated from the core region of M87 and not from any knots further down the jet (Acciari et al., 2009).
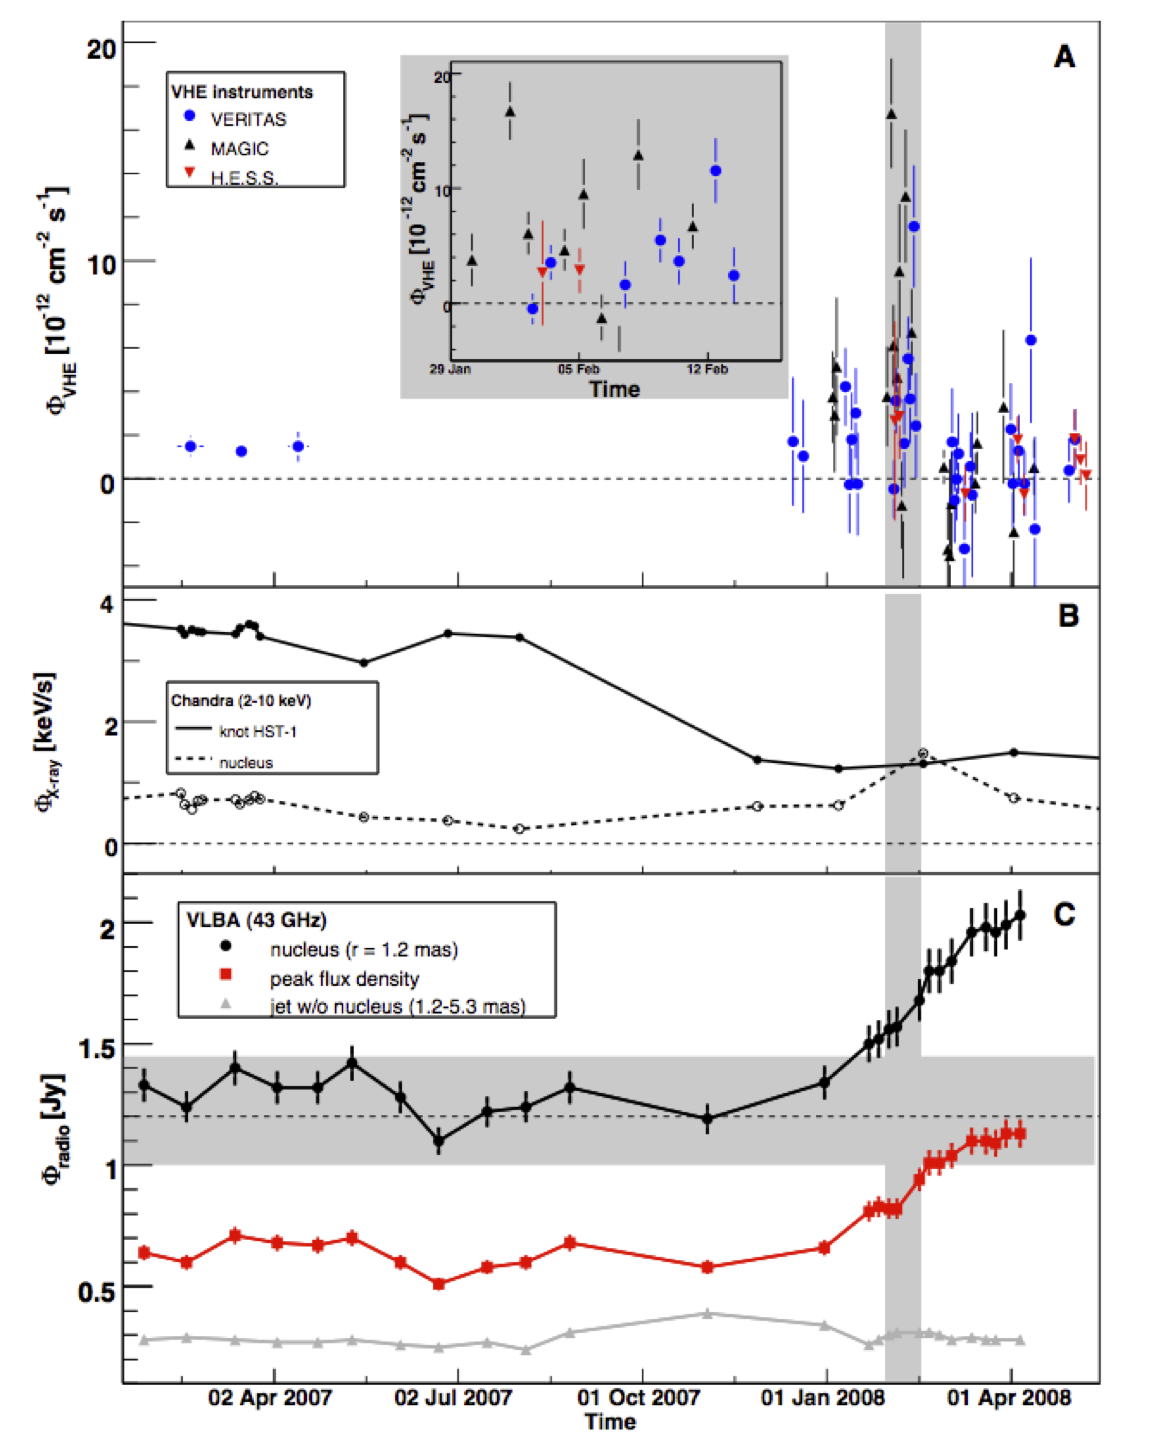
The story is further complicated by a large (20% Crab) flare seen by VERITAS in 2010 (Ong and Mariotti, 2010). This incident was also observed with the LAT, VLBA and Chandra. Even though the core is seen to be brightening in the X-ray, no increase in flux is seen in the GeV range and the radio does not exhibit the same behavior as in previous flares. However, the brightness of the flare in the VHE allows for detailed studies of the spectral state of M87 during the flaring period.
III Conclusions
It should be apparent that there is still a lot to learn before we can understand the VHE and HE emission from misaligned blazars (and by extension AGN in general). It should also be clear that the only reason we know as much as we do at this point is due to the amazing amount of effort put into multiwavelength studies. Without a full view of the SED, we could not adequately model these systems. Without a full view of the lightcurve we could not try and understand the location of the emission. It is vitally important to continue multiwavelength studies from the optical all the way to VHE.
Acknowledgements.
VERITAS is supported by grants from the U.S. Department of Energy Office of Science, the U.S. National Science Foundation and the Smithsonian Institution, by NSERC in Canada, by Science Foundation Ireland (SFI 10/RFP/AST2748) and by STFC in the U.K. We acknowledge the excellent work of the technical support staff at the Fred Lawrence Whipple Observatory and at the collaborating institutions in the construction and operation of the instrument. The Fermi LAT Collaboration acknowledges support from a number of agencies and institutes for both development and the operation of the LAT as well as scientific data analysis. These include NASA and DOE in the United States, CEA/Irfu and IN2P3/CNRS in France, ASI and INFN in Italy, MEXT, KEK, and JAXA in Japan, and the K. A. Wallenberg Foundation, the Swedish Research Council and the National Space Board in Sweden. Additional support from INAF in Italy and CNES in France for science analysis during the operations phase is also gratefully acknowledged.References
- Atwood et al. (2009) W. B. Atwood, et al. ApJ, 697:1071, 2009.
- Hiton and Hofmann (2009) J. Hinton and W. Hofmann. ARA&A, 47:523, 2009.
- Moudden et al. (2011) Y. Moudden, et al. IEEE Transactions on Nuclear Science, 58:1685, 2011.
- Kieda et al. (2011) D. B. Kieda and The VERITAS Collaboration. eprint arXiv:1110.4360, 2011.
- Lombardi et al (2011) S. Lombardi, et al. eprint arXiv:1109.6195, 2011.
- González (2011) M. M. González. XIII Latin American Regional IAU Meeting (Eds. W. J. Henney & S. Torres-Peimbert) Revista Mexicana de Astronomía y Astrofísica (Serie de Conferencias), 40:141, 2011.
- CTA Consortium (2011) CTA Consortium. Exp. Astron., 32:193, 2011.
- Urry and Padovani (1995) C. M. Urry and P. Padovani. PASP, 107:803, 1995.
- Abdo et al. (2010a) A. A. Abdo, et al. Science, 328:725, 2010.
- Acciari et al. (2009) V. A. Acciari, et al. ApJ, 706:L275, 2009.
- Brown and Adams (2011) A. M. Brown and J. Adams. MNRAS, 413:2785, 2011.
- Abdo et al. (2009) A. A. Abdo, et al. ApJ, 699:31, 2009.
- Strong et al. (1982) Strong, A. W., et al. A&A, 115:404, 1982.
- Abdo et al. (2010b) A. A. Abdo, et al. ApJ, 719:1433, 2010.
- Donato et al. (2010) D. Donato, D. Wood, and C. C. Cheung. The Astronomer’s Telegram, 2737, 2010.
- Bechmann et al. (2011) V. Beckmann, et al. A&A, 531:A70, 2011.
- Marshall and Clark (1981) F. J. Marshall and G. W. Clark. ApJ, 245:840, 1981.
- Aharonian et al. (2009) F. A. Aharonian, et al. ApJ, 695:L40, 2009.
- Lenain et al. (2008) J. P. Lenain, et al. A&A, 478:111, 2008.
- Abdo et al. (2009) A. A. Abdo, et al. ApJ, 707:55, 2009.
- Aharonian et al. (2003) F. Aharonian, et al. A&A, 403:L1, 2003.
- Abromowski et al. (2012) A. Abramowski, et al. ApJ, 746,151, 2012.
- Aharonian et al. (2006) F. Aharonian, et al. Science, 314:1424, 2006.
- Acciari et al. (2009) V. A. Acciari, et al. Science, 325:444, 2009.
- Ong and Mariotti (2010) R. A. Ong and M. Mariotti. The Astronomer’s Telegram, 2542, 2010.