Dynamics inside the radio and X-ray cluster cavities of Cygnus A and similar FRII sources
Abstract
We describe approximate axisymmetric computations of the dynamical evolution of material inside radio lobes and X-ray cluster gas cavities in Fanaroff-Riley II sources such as Cygnus A. All energy is delivered by a jet to the lobe/cavity via a moving hotspot where jet energy dissipates in a reverse shock. Our calculations describe the evolution of hot plasma, cosmic rays (CRs) and toroidal magnetic fields flowing from the hotspot into the cavity. Many observed features are explained. Gas, CRs and field flow back along the cavity surface in a “boundary backflow” consistent with detailed FRII observations. Computed ages of backflowing CRs are consistent with observed radio-synchrotron age variations only if shear instabilities in the boundary backflow are damped and we assume this is done with viscosity of unknown origin. A faint thermal jet along the symmetry axis may be responsible for redirecting the Cygnus A non-thermal jet. Magnetic fields estimated from synchrotron self-Compton (SSC) X-radiation observed near the hotspot evolve into radio lobe fields. Computed profiles of radio synchrotron lobe emission perpendicular to the jet are dramatically limb-brightened in excellent agreement with FRII observations although computed lobe fields exceed those observed. Strong winds flowing from hotspots naturally create kpc-sized spatial offsets between hotspot inverse Compton (IC-CMB) X-ray emission and radio synchrotron emission that peaks 1-2 kpc ahead where the field increases due to wind compression. In our computed version of Cygnus A, nonthermal X-ray emission increases from the hotspot (some IC-CMB, mostly SSC) toward the offset radio synchrotron peak (mostly SSC).
Subject headings:
hydrodynamics, galaxies: cooling flows, galaxies: clusters1. Introduction
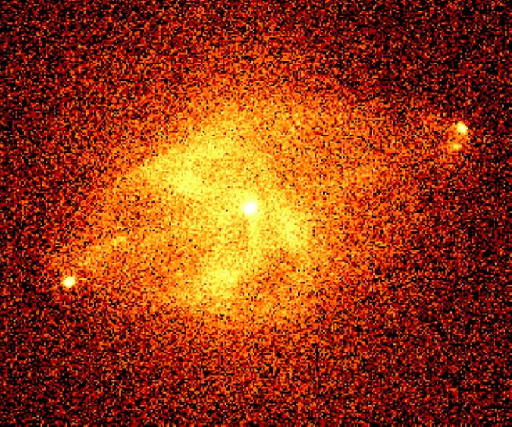
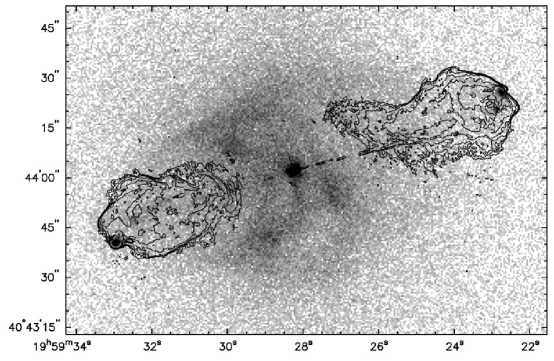
Iconic radio and X-ray images of Cygnus A (Figure 1) attest to the colossal energy attributed to cluster-centered massive black holes. Apparently in response to mass accretion, the massive black hole in Cygnus A ejects opposing non-thermal jets that form radio lobes and X-ray cavities. The jets in Cygnus A penetrate out through the cluster gas, driving strong bow-shocks that enclose the jet and its cavity like a cocoon. Since the velocity of the jet greatly exceeds that of the expanding shock, a second more powerful (reverse) shock must appear near the apexes of the cocoon where the energy of the jet is delivered to kpc-sized post-shock hotspots. The velocity of the hotspot is relatively modest, similar to that of the bow shock, but gas and relativistic particles flow through the hotspot with much higher velocities. Matter flowing from the high pressure hotspots inflates the entire radio lobe, displacing the cluster gas as it forms an X-ray cavity. Most, or perhaps all, of the contents of the radio lobes – relativistic particles, magnetic field and plasma – originated in the bright hotspots. As hotspots move out into the cluster gas, the energetic CRs produced there flow back (in a “backflow”) toward the cluster center.
Images as in Figure 1 have inspired many theoretical studies of FRII jets and their cocoons (e.g. Blandford & Rees 1974; Scheuer 1974; Kaiser & Alexander 1997; Clarke, Harris, & Carilli 1997; Carvalho & O’Dea 2002; Carvalho et al. 2005; Krause, 2005; Saxton et al. 2002; O’Neill & Jones 2010; Huarte-Espinosa, Krause, & Alexander 2011). Here we describe approximate calculations emphasizing the dynamical evolution of material inside the radio lobes.
The approximate evolution and current morphology of Cygnus A can be produced by cosmic rays flowing away from the hotspot as it moves out into the cluster gas (Mathews & Guo 2010, hereafter MG10). The powerful jet compresses the hotspot in the reverse shock at its inner surface, but most of the energy inside hotspots is contained in cosmic rays transported from the jet and/or accelerated in the strong reverse shock. Jet transport of CRs may be more likely since normal diffusive shock acceleration is suppressed by the magnetic field orientation perpendicular to the jet (Sironi & Spitkovsky 2009) as observed by Carilli et al. (1999). In the discussion below, as in MG10, we regard the hotspot as the primary energy source in the cocoon. With this assumption we avoid direct computation of the jet itself which occupies a very small volume (Fig. 1) and which is much more difficult to observe and interpret than the bright hotspots, visible in both radio and X-rays (Fig. 1). Multiple pairs of discrete hotspots (as in Figure 1) are common in FRII sources (Black et al. 1992; Hardcastle, Croston, & Kraft 2007), indicating that the direction of opposing jets changes rather abruptly from time to time. These changes can create a new hotspot before the previously activated hotspot has decayed and are sufficiently abrupt not to produce visible cometary smears where moving jets impact on the relatively denser outer wall of the radio cavity.
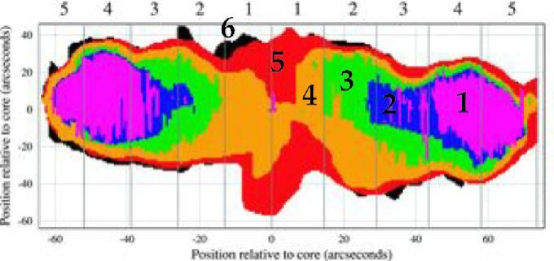
Here we describe calculations similar to those in MG10 but with an emphasis on the detailed flow of post-hotspot gas and cosmic rays inside the radio cavity. In particular, we address two of the difficulties encountered in the MG10 computations: (1) large scale irregularities in the radio lobe boundaries (Figs. 3, 9 & 11 in MG10) that have no observed counterparts and (2) chaotic, high velocity plasma flows inside the radio lobes that are inconsistent with the regular, radially ordered age-related variation of synchrotron spectra observed in Cygnus A (Fig. 1) and in FRII sources in general (Alexander & Leahy, 1987). The orderly variation of observed radio spectra along the radio lobes reveals an evolutionary aging as cosmic ray (CR) electrons lose energy by synchrotron emission. Associated with this is a well-ordered internal flow pattern. Evidently CRs and the magnetic field necessary for synchrotron emission both advect along with low density gas as it backflows from the hotspot toward the cluster center. As a result, the oldest CR electrons are found closer to the center of Cygnus A, furthest from their hotspot origin. The monotonic radial variation of synchrotron ages (e.g. Alexander & Leahy 1987; Machalski et al. 2007) in FRII sources indicates that their advection must be spatially smooth, uninterrupted by turbulence or large scale non-laminar flows inside the radio cavity.
Clearly, the vortical irregularities in the lobe boundary and the chaotic flows inside the radio lobe that appear in previous FRII computations must not occur. The surface vortices appear to be non-linear Kelvin-Helmholtz (KH) instabilities driven by shear between rapidly backflowing post-hotspot material and adjacent gas on both sides. KH irregularities also drive vortical and other large scale flows deep inside the radio cavities that spatially mix synchrotron emitting CR electrons of all ages, upsetting the highly stratified age variation observed. Disordered internal lobe velocities computed by MG10 are sufficiently large, km s-1, to distort the fragile arrangement of radio-synchrotron ages created during the Cygnus A lifetime, about yrs. In MG10 we recognized that some damping mechanism must be invoked to reduce or remove these shear-generated disturbances. Our impression is that similar unobserved internal lobe velocities are common in all previous computational studies of FRII evolution.
KH instabilities can be stabilized by strong magnetic fields along the lobe or by viscous damping. In view of the dynamical weakness of observed magnetic fields in Cygnus A, we explore here the possibility that the apparent absence of KH vortical activity is due to viscosity. We do not claim to understand the physical nature of viscosity in a collisionless relativistic fluid mixed with very low density plasma and weak fields. However, a similar viscous damping has a remarkably beneficial effect in removing unobserved surface irregularities in the gamma ray image of the Fermi bubbles in the Milky Way (Guo & Mathews 2012; Guo et al. 2012). Viscosity in hot cluster gas has also been considered by Reynolds et al. (2005), Roediger & Bruggen (2008) and Jones (2008).
Our objective is to explore dynamical and physical features in Cygnus A created by hot gas, CRs, and magnetic fields using 2D axisymmetric computations and a variety of additional simplifying assumptions. While we adopt many parameters consistent with observations of Cygnus A and its surrounding cluster gas, we do not adjust parameters to achieve the best possible match to Cygnus A observations – our results are intended to apply to FRII sources in general. We adopt a distance to Cygnus A of Mpc so that 1 corresponds to 1 kpc.
2. Computational Procedure
As discussed in MG10, we consider the self-consistent dynamics of a two-component fluid: relativistic cosmic rays (CRs) and hot gas. The pressures of these two fluids are related to the energy densities by and respectively where and . CR pressure gradients communicate momentum to the gas by means of small magnetic fields frozen into the gas, assuming that Alfvén speeds are generally small compared to typical gas velocities. The magnetic energy density inferred from radio and X-ray observations of the Cygnus A radio lobes is smaller than by factors of 10-600 (Hardcastle & Croston 2010; Yaji et al. 2010). Observed fields in the radio lobe are G (Yaji et al. 2010). Even the much larger magnetic fields observed in Cygnus A hotspots, G, indicate that is several times smaller than (Stawarz et al. 2007). Consequently, for the approximate computations discussed here we ignore the Lorentz force on the gas and regard the magnetic field as passively moving with the hot gas velocity.
The equations we consider are:
| (1) |
| (2) |
| (3) |
| (4) |
| (5) |
Equation (4) for the integrated CR energy density does not include CR diffusion nor do we include loss terms due to synchrotron or inverse Compton emission, assuming that the radiating CRs are a small fraction of the total CR energy density. Because of their negligible rest mass, a mass conservation equation for the relativistic CR particles is unnecessary. The viscous stress tensor appearing in both the momentum and internal energy equations is proportional to the (assumed spatially uniform) viscosity and these terms are provided in cylindrical coordinates in the Appendix. We assume a classical form for the viscous terms, but, as discussed below, it must be emphasized that we do not understand the physical nature of (turbulent or particle) transport processes in relativistic, weakly magnetic plasmas (Schekochihin et al. 2010). Radiative cooling of the thermal gas is not included because of the short age of the Cygnus A event, assumed to be 10 Myrs.
Our 2D Eulerian code employs advection procedures similar to those described by Stone & Norman (1992) for the ZEUS code, but with CR and other features added to study FRII sources. This code has been used extensively for other similar problems and correctly duplicates many relevant calculations such as for example the CR-gas shock structure of Jones & Kang (1990). We adopt a modest grid resolution with 150 uniform zones kpc out to 75 kpc, which completely encloses the 60 kpc size of the Cygnus A cocoon, and 50 additional geometrically increasing zones in both directions extending out to about 1 Mpc into the surrounding cluster gas. Our kpc grid resolution is comparable with the observational resolution of Chandra in X-rays and the VLA in radio.
Cygnus A is centered in a large galaxy cluster containing a hot gas atmosphere that has been observed in X-rays with temperature keV at 32 kpc (Smith et al. 2002; Wilson et al. 2006). As explained in MG10, to extend these observations of the Cygnus A cluster to larger cluster scales, we use gas density and temperature profiles of the similar cluster Abell 478 (virial mass and NFW concentration ) from Vikhlinin et al. (2006) and renormalize them to agree with the Smith-Wilson observations near the cluster center. The stellar and massive central black hole in M87 have been used to represent the central galaxy in Cygnus A (see MG10 for further details).
As discussed above and in MG10, our computation begins with the moving hotspot, not the jet. All CRs and magnetic flux that enters the radio lobe originates in the hotspot. The hotspot is an energy source in two respects, as a region where gas and CRs are compressed by the jet in the reverse shock and as the post-shock region where the jet energy is largely isotropized.
The kpc-sized hotspot observed in Cygnus A is approximated with a cylindrical region of radius 1 kpc and height 0.5 kpc (two computational zones) elongated in the transverse -direction as observed at radio frequencies (Carilli et al. 1999). The velocity of the hotspot can be estimated from the age and dimensions of Cygnus A. The age yrs is determined from the synchrotron lifetimes of radiating CR electrons (Machalski et al. 2007). The (projected) distance of the hotspot from the center of its host galaxy is 60 kpc. Assuming uniform motion, the hotspot velocity is km s-1, disregarding a small projection correction onto the plane of the sky. The acceleration and compression of gas in the hotspot by the reverse shock occurs in the -direction along the jet axis. The location of the hotspot at any time determines the two hotspot zones that receive an acceleration,
| (6) |
where is the area of the two hotspot zones and . During each time step the hotspot velocity at time is
| (7) |
and is chosen so that the gas velocity in the hotspot slowly approaches over many time steps.
A second, much more important hotspot energy source is the CRs introduced or created by the jet in the reverse shock at the inner boundary of the hotspot. In MG10 we found that an average CR hotspot power of erg s-1 is sufficient to inflate the radio cavity in Cygnus A to approximately its currently observed volume . In our computation here the hotspot volume remains constant as it moves through a uniform grid. If is also assumed to be constant, the source term in the CR energy density equation is
| (8) |
The addition of CRs to the hotspot contributes a total energy ergs that is at least 50 times greater than the work done in accelerating the hotspot material to .
As indicated with in equation (1) above, we also inject a small mass of non-relativistic gas into the hotspot at a rate 1 yr-1, that is assumed to arrive with the jet. This is only about 6 percent of the total rate, yr-1, that gas flows into the X-ray cavity in our Cygnus A flow calculations (MG10). Hotspot gas serves to transport the frozen-in magnetic field from the hotspot to the radio lobe. The thermal energy density of gas inside the hotspot is several hundred times smaller than that of the CRs, .
In Model 1 of MG10 we also described an evolution of the Cygnus A cavity-cocoon with constant , , and . However, we repeat this calculation again here with a slightly different hotspot boundary condition in which cosmic rays are not allowed to flow directly from the hotspot upstream across the reverse shock inside the incoming (but not actually computed) jet. This new boundary condition only applies to the inner boundary of the two hotspot zones and serves to focus the kinetic outflow from the hotspot in the forward (jet) direction and perpendicular to the jet axis. CR acceleration by diffusion across the reverse shock is sharply reduced by the perpendicular alignment of the magnetic field () (Sironi & Spitkovsky 2009) which is consistent with field orientations in Cygnus A observed by Carilli et al. (1999).
3. Non-viscous Computation
In our first calculation we describe the computed appearance of Cygnus A after evolving for yrs without viscosity (). The bow shock in the cluster gas, the radio cavity and its contents are all completely described by the initial cluster atmosphere and sources in the hotspot, moving out at constant velocity km s-1. After each computational time step the CR energy density in the hotspot is increased according to:
assuming constant . The hotspot (-direction) grid index is determined by the instantaneous position of the hotspot and the -direction grid index includes both hotspot zones.
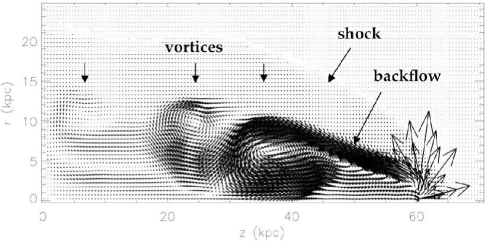
Figure 2 (top) shows the density variation in this Cygnus A calculation at time 10 Myr. The dark, low-density central cavity is surrounded by a denser layer of shocked cluster gas, and a bow-cocoon shock separates this region from undisturbed cluster gas beyond.
Superimposed on the X-ray cavity are white contours showing the computed distribution of CR energy density . The CR pressure and are nearly constant inside the cavity, reflecting the much larger pressure scale height there. The concentration of white contours near the cavity boundary indicates that , and therefore the radio lobe emission, is sharply defined as in the observed image (Fig. 1 center). The concentration of and radio emission near the hotspot (at kpc) is also evident. Since CRs are not allowed to cross the inner boundary of the hotspot zones, this appears as a small, sharp vertical transition in Figure 2 (top). Also of interest is the thin, low-density (dark) sheath of thermal cavity gas surrounding the outermost contours of . This narrow “thermal sheath” may originate in cluster gas just beyond the hotspot (Section 4.2), but higher-resolution computations would be useful to verify the origin of this feature which contains most of the thermal gas mass inside the cavity.
However, the outer boundary of the radio emitting region shown with white contours in Figure 2 (top) has large folds associated with vortical flows inside the radio cavity. Evidently these are produced by the Kelvin-Helmholtz (KH) instability expected in the rapidly shearing backflow. Such KH features, also appearing in the flows computed in MG10, have not been observed in radio frequency images.
Figure 2 (center) shows a a superposition of gas velocity flow vectors for this solution. The largest flow speed, , which occurs just as hot gas and CRs emerge from the hotspot, is mildly relativistic , but decreases rapidly in neighboring grid zones. As a result of the boundary condition on the two hotspot zones that forbids gas from moving upstream into the oncoming jet, CRs and gas exit from all other directions. Shortly thereafter, the hotspot outflow is redirected back along the surface of the radio cavity. Unlike many, possibly all, previous FRII calculations, our backflow lies just along the radio lobe boundary, subsequently referred to as the “boundary backflow”. However, three large vortices at , 24 and 36 kpc visible in Figure 2 (center) – presumably due to KH instabilities – cause CRs of different ages to mix together. This CR mixing upsets the smooth variation of synchrotron ages apparent in FRII observations (Fig. 1 bottom). This is another major drawback of this flow evolution.
Figure 2 (bottom) shows contours of the time in Myrs since the local gas and CRs left the hotspot. To evaluate this time, we use a new variable formed by the product of the gas density and time in Myrs, . At each time step in the calculation the gas density in the hotspot and the current time are used to define which then advects away from the hotspot just like the gas density,
| (9) |
At any point in the subsequent flow inside the cavity the time at which the local gas exited the hotspot can be found by division, . We use this time to determine the local radio synchrotron age Myr. The contours in Figure 2 (bottom) describe the locus of the mean emission-weighted age (in Myrs) of CR electrons at each position in the radio lobe,
where is an approximate surrogate for the synchrotron emissivity and the evolution of the magnetic field is discussed in Section 4.1 below.
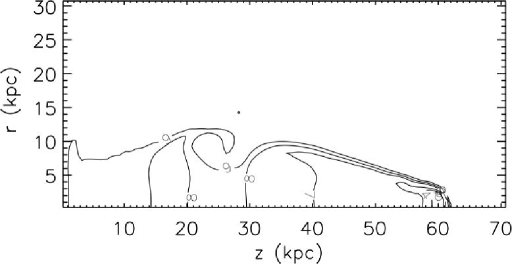
In Figure 2 (bottom) it is seen that vortical KH and other dynamical activity inside the radio cavity has mixed in a way that is inconsistent with the characteristic distribution of radio synchrotron ages in FRII sources which varies smoothly and monotonically across the radio lobes as in Figure 1 (bottom). The computed apparent age distribution in Figure 2 (bottom) is a mess. The vortical flow inside the lobe has distorted the contours of 9 Myr old CRs and sundered the 8 Myr old CRs into two separate regions – we are unaware of any FRII observation that shows such strong and prominent CR age oscillations along the radio lobe.
Figure 3 shows profiles perpendicular to the jet direction (-axis) of the flow velocities and the time when local gas and CRs left the hotspot. While the negative boundary flow at kpc (closest to the hotspot) has a well-defined time, profiles further back along the radio lobe become strange: at kpc the flow at kpc is strongly positive, and at kpc the backflow near the boundary has reversed, becoming positive due to a local vortex. This again is evidence of the failure of this flow to conform to the observed distribution of radio synchrotron ages.
As a result of KH instabilities in the evolution computed in Figures 2 and 3, this model fails to match the Cygnus A observations in two important ways: (1) the outer radio lobe contours are irregular due to vortical folding and (2) the CR age distribution is rather drastically upset and rearranged. The chaotic radio cavity flow in Figure 3 apparently also occurs in many other FRII computations such as the recent 3D models of Hodges-Kluck & Reynolds (2011) and Huarte-Espinosa, Krause & Alexander (2011). Neither the cavity kinematics nor the distribution of radio ages of synchrotron electrons are discussed in detail by these authors, but their images of highly irregular FRII cavity boundaries and internal structures necessarily require disordered and disruptive velocity fields inside the cavities. By comparison, the radio images of FRII sources are much smoother and regular (e.g. Kharb et al. 2008). Nevertheless, the width of the observed Cygnus A radio lobe in Figure 1 (bottom) does not vary in a perfectly monotonic fashion along the lobe. But these variations in the Cygnus A lobe width are not accompanied by strong vortical mixing of CR electron ages. A locally smaller lobe width could arise for example from a past asymmetric hotspot excursion or a decrease in hotspot CR production during a time in the past. In any case the model we compute in Figures 2 and 3, and those of other authors, are unsatisfactory. We conclude that KH instabilities must be damped.
3.1. Stabilizing KH: magnetic field or viscosity?
The two most plausible ways to remove the KH instability in the radio cavity are magnetic tension or viscous damping. Magnetic KH stabilization is possible if the field has significant non-toroidal components and if the relative backflow velocity along the bubble surface is less than the root mean squared average of the Alfvén speeds on both sides of an interface (Chandrasekhar 1961). This second condition cannot be satisfied with the magnetic fields observed and our computed density. Consider for example the flow near the cavity boundary in the previous solution. At kpc the lobe boundary backflow velocity decreases from a maximum of km s-1 at kpc to km s-1 at . Across this same region the gas density increases from to cm-3 and the Alfvén speed decreases from km s-1 to km s-1, when evaluated with the maximum observed lobe field G (Yaji et al. 2010) and our computed gas density. Since , the observed field is too small to stabilize the computed boundary backflow. An enormous lobe field, G, comparable with that observed in the hotspot, would be required to stabilize the KH instability at this . (Such a large field would nearly be in equipartition with our computed CR energy density inside the radio lobe.) At and 35 kpc the computed boundary backflow velocities km s-1 are still larger than the Alfvén speeds km s-1 computed with G, as before, G lobe fields would be required for stabilization.
In addition, magnetic stabilization would require (non-toroidal) fields along the lobe boundary roughly in the -direction. Such large fields would almost certainly have to be inside the cavity since fields observed in cluster gas tens of kpc from the center are typically very much smaller, only a few G (e.g. Feretti et al. 2009; Bonafede et al. 2010). Dursi & Pfrommer (2008) and Pfrommer & Dursi (2010) describe the concentration of tangential fields due to “draping” of field lines around the upwind-facing surface of a moving object. However, strong field draping does not occur along the backflowing boundary of the Cygnus A radio lobe since this is a contact discontinuity between two fluids, the cavity and shocked cluster gas, that are moving at the same velocity perpendicular to the interface.
If the gas density inside the radio cavity was about 25-100 times lower than we calculate, this could increase the Alfvén speed to be comparable with the backflow velocity. The low gas density, cm-3, that fills most of the boundary backflow in the non-viscous flow arises from the small mass source, yr-1, we introduce into the hotspot. More detailed future calculations will be necessary to determine if extremely low cavity plasma densities can increase the Alfvén velocity sufficiently for magnetic KH stabilization.
Alternatively, perhaps the magnetic field in the radio cavity, G, has been underestimated because non-thermal emission originates in the boundary backflow of volume , not throughout the cavity volume as commonly assumed (Yaji et al. 2010). According to Yaji et al. about half of the nonthermal X-ray emission comes from inverse Compton (IC) upscattered CMB photons and half from synchrotron self-Compton (SSC).
Assuming for simplicity monoenergetic representative CR electrons, the power emitted from a single CR electron with mean energy is
| (10) |
where , is a constant and is the energy density of the relevant field of diffuse photons with space density . The total radio synchrotron luminosity from volume is
| (11) |
where ,
and
| (12) |
is the number density of CR electrons with radio emitting energy . The IC X-ray luminosity produced by interactions with CMB microwave photons and CR electrons of energy is
| (13) |
This last equation indicates that the magnetic field found from X-ray IC observations
is independent of the volume. For SSC X-rays the photon energy density is where is the appropriate mean dimension across along which photons are upscattered. The SSC luminosity is
| (14) |
This last equation indicates that the field determined from X-ray SSC emission varies as where is the mean distance characterizing the SSC emitting volume. If Yaji et al. had considered SSC emission from the smaller boundary flow volume, would be reduced by less than a factor of about two. Evidently, the increase in the estimated by using rather than does not provide sufficient magnetic tension to stabilize KH instabilities in the computed backflow. Apart from CR energy dependent factors, the non-thermal luminosities have the following dependencies:
| (15) |
where and is the energy density of synchrotron radiation.
Aside from these concerns, an additional preference for damping KH instabilities with viscosity rather than magnetic fields is motivated by our successful application of viscous damping to the Fermi bubbles in the Milky Way (Guo et al. 2012), where the magnetic fields that could provide similar KH damping seem prohibitively large.
Nevertheless, magnetic fields are directly observed in FRII sources, while there is less compelling observational evidence for viscosity, although it has been invoked to explain the smooth boundaries of X-ray cavities in cluster gas (Reynolds et al. 2005). The classical kinematic particle viscosity is where is the mean random velocity of protons of mass with mean free path . The non-magnetic (Spitzer) plasma viscosity is gm cm-1 s-1, but the corresponding mean free path kpc is largely irrelevant in a magnetized plasma because particle excursions are constrained by the much smaller Larmor gyroradius, cm for a thermal proton. The viscosity that we require to transport momentum in the boundary backflow may therefore result from localized turbulent activity rather than particle trajectories. But turbulence must not mix CR electrons of different ages on large scales – this may be a difficult constraint to satisfy. We also recognize that shear viscosity in the radio lobes may be incompatible with our assumption of purely toroidal fields aligned perpendicular to the shear gradient. However, we note that there is evidence in the Virgo cluster that energetic particles can diffuse across the observed field direction, as required to produce the bright rims on large cluster gas radio lobes (Mathews & Guo 2011). Cross-field diffusion and momentum transport may be possible due to small-scale field irregularities and MHD turbulence that are difficult to observe. In any case, for the exploratory calculations here we invoke viscosity to stabilize the KH instability. Observations require that the KH kinematic features in Figure 2 must be removed and it may not matter whether this is accomplished with magnetic fields or viscosity.
4. Viscous Computation
We now repeat the previous computation but include a non-zero shear viscosity. For simplicity the solution we describe has a uniform viscosity gm cm-1 s-1 throughout the computational grid. This value is sufficiently small not to have any appreciable effect on the flow outside the radio cavity where shear velocities are much smaller. We also considered a somewhat larger value, gm cm-1 s-1, but found that the boundary backflow was broader than observations allow, as discussed below.
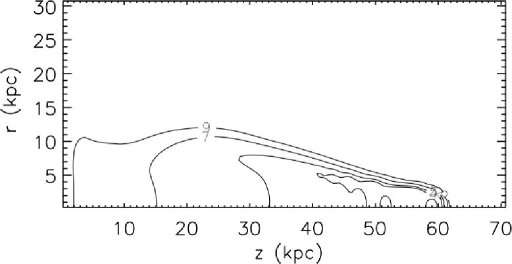
The density variation of this flow, illustrated in Figure 4 (top), shows that the KH features in Figure 2 are largely absent. Only one rather weak vortical KH feature appears in Figure 4 within about 5 kpc from the center, but the CR energy density contours are now very regular throughout the cavity interior. The central panel shows that the boundary backflow now flows smoothly without interruption nearly to the plane. The much slower gas flow in the central region of the cavity is in the opposite sense, along the direction of the original jet.
The bottom panel of Figure 4 shows contours of the local mean line of sight CR ages at 9, 7, 5 and 4 Myrs since leaving the hotspot. Unlike the non-viscous flow in Figure 2 (bottom), the CR ages are now distributed monotonically along the radio cavity just as observed in Figure 1 (bottom). Also in general more youthful CRs are found further back along the radio cavity than in the non-viscous solution. Furthermore, the apparent CR age distribution in Figure 4 (bottom) often increases along perpendicular directions away from the jet, as clearly seen in Figure 1 (bottom). The maximum velocity in the cavity, , appears in the computational zone just adjacent to the hotspot but declines very rapidly to beyond about 2 kpc from the hotspot.
Figure 5 shows more quantitatively the correspondence of transverse profiles of the velocities () and hotspot exit times at four distances along the cavity: , 45, 35, and 25 kpc. By comparison with Figure 3 it is seen that the boundary backflow velocities decrease somewhat faster when viscosity is included. More importantly, no KH vortices interfere with the boundary backflow or the monotonic spatial variation of CR ages. Viscous momentum diffusion also causes the width of the boundary backflow to increase downstream from the hotspot. Even at kpc the boundary backflow still has a large negative velocity, km s-1, extending over kpc.
4.1. Magnetic Field Evolution
Detailed radio polarization observations of Cygnus A (Carilli et al. 1999) indicate that the prevailing sense of magnetic field orientation in the Cygnus A hotspots is parallel to the shock plane. This is consistent with a large toroidal field component but does not exclude hotspot fields with radial -components (). Nevertheless, for simplicity in this exploratory calculation we assume that the field is purely toroidal (). Both equations (5) for the passive frozen-in field evolution are satisfied in the toroidal case by solving
| (16) |
since toroidal fields are inherently divergence-free. At each time step the toroidal magnetic field in the hotspot is reset to and the continuous wind outflow from the hotspot transports the field throughout the radio cavity, preserving its toroidal morphology. All magnetic fields in the radio lobe are assumed to originate in the hotspot. However, in the Cygnus A radio lobe downstream from the bright hotspots the field orientation indicated by radio polarization observations is poloidal, often parallel to the lobe boundary (Perley & Carilli 1996), so some original poloidal field component must also be present in the hotspot 222 Even if the hotspot magnetic field were exactly toroidal relative to the jet direction, the instantaneous jet and hotspot positions are not symmetric with the radio lobe symmetry axis (Fig. 1 center), so production of poloidal fields is unavoidable. . A poloidal field component in the hotspot would be amplified by transverse shear in the boundary backflow.
For our limited purposes in this paper an idealized purely toroidal field serves as a convenient approximate tracer of field evolution as the field advects downstream back into the cavity. Strong compression by the jet-hotspot shock would realign a random magnetic field until only field components parallel to the shock plane survive (Laing 1980). The fractional radio polarization observed by Carilli et al. (1999) in the bright central cores of the Cygnus A hotspots is %, indicating that the field alignment, although high, is not that of a purely toroidal field in which the degree of polarization would peak at % near the hotspot center. The field in the hotspot is likely to be a compressed version of the field arriving in the jet perhaps with additional non-linear amplification driven by post-shock instabilities and magnetic turbulence. In addition, it is unclear how much of the total hotspot emission and apparent field orientation comes from small 10pc-sized hotspot inhomogeneities visible with VLBI observations (Tingay et al. 2008).
The toroidal field assumption allows us for the first time to relate the field strength observed in the Cygnus A hotspots, G (Stawarz et al. 2007) with much smaller fields observed in the radio lobes, G (Yaji et al. 2010). A comparison of Figures 3 and 5 illustrates how well viscous damping organizes the CR flow inside the radio cavity. While the lobe field is reduced by adiabatic spatial expansion into the large cavity volume, the lobe field is amplified by compressive deceleration along the boundary backflow (see below). This latter point makes it difficult to reconcile the observed hotspot and lobe field strengths. For example, assuming a hotspot field of G, the computed fields at time 10 Myrs in the non-viscous boundary backflow in the range kpc would have maximum values G, more than 20 times the observed values. These fields have maximum energy densities erg cm-3 that exceed the CR energy density in the lobe erg cm-3. Such large super-equipartition fields, which would rapidly evolve toward a force-free morphology, are most unlikely.
The relatively small volume-averaged radio cavity field, G, is found by interpreting the X-ray emission from the (outer half of the) lobes as a combination of IC-CMB and SSC in approximately equal proportions (Yaji et al. 2010). This is a more straightforward field estimate than that in the hotspot where post-shock conditions are uncertain and nonlinear inhomogeneities within hotspots are often observed (e.g. Carilli et al. 1999; Tingay et al. 2008; Wright & Birkinshaw 2004; Hardcastle, Croston & Kraft 2007; Perlman et al. 2010; Erlund et al. 2010; Orienti et al. 2011). The synchrotron emission in the hotspots may be concentrated in small inhomogeneous regions of high field energy and/or high CR electron density, that skew the estimated mean hotspot field to higher values. Moreover, Weibel-type instabilities or other non-linear post-shock transient fields (e.g. Tatischeff 2008) may generate strong localized post-shock fields that later decay. Consequently, for the purposes of our approximate field calculation we adopt a smaller hotspot field G, chosen to avoid in the radio lobes. The passively advecting post-hotspot field we compute with equation (16) can be linearly rescaled to any other suitable hotspot field that is consistent with our neglect of the Lorentz force.
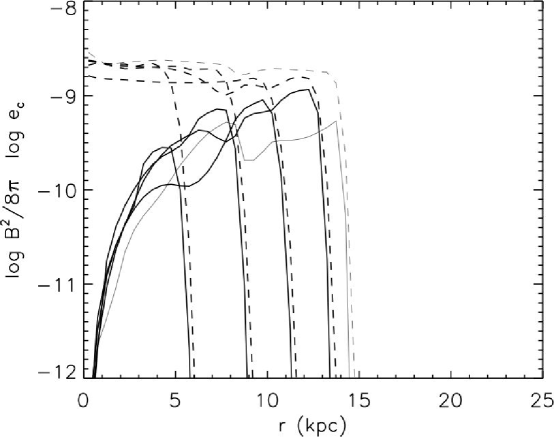
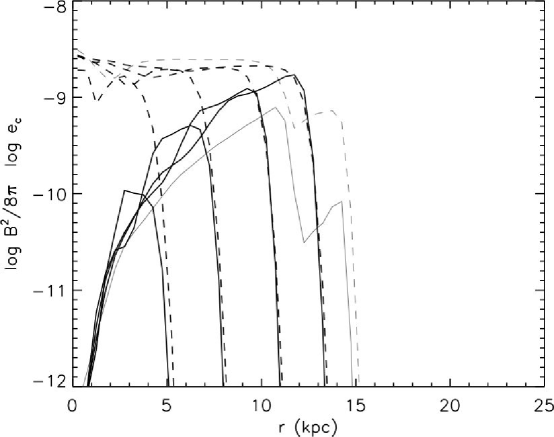
Figure 6 shows a superposition of transverse profiles of the CR energy density and the toroidal magnetic field energy density at , 45, 35, 25 (heavy lines) and 5 kpc (thin lines). The upper and lower panels show results without and with viscosity respectively. The CR energy density is approximately uniform throughout the lobe as expected. However, the magnetic field energy density is seen to peak strongly near the outer edge of the boundary backflow. In the viscous solution the maximum field strength at , 45, 35 and 25 is , 110, 160, and 210G respectively. At kpc and Lorentz forces would become important if our adopted hotspot field normalization (G) were correct.
A more serious concern with Figure 6 is that even our adopted hotspot field G, which we have lowered in an ad hoc manner, results in radio lobe fields that are too large for the expected synchrotron lifetimes. If the mean field in the outer part of the radio lobes ( kpc) is G ( erg s-1), the corresponding synchrotron lifetime, yrs, for radiation at 5 GHz is only yrs. By contrast, electrons emitting at this same frequency in the G radio lobe magnetic field measured by Yaji et al. (2010) have a more reasonable lifetime, yrs. Overall, with a hotspot field G the computed lobe field is about 20 times larger than observed.
Many possible explanations for the discrepancy between the hotspot and lobe fields can be imagined: (i) difficulty in estimating the mean hotspot field due to inhomogeneities and local field gradients, (ii) the field estimate of Yaji et al. can be increased if the effective volume that radiates SSC X-rays was overestimated, (iii) poloidal field components in the hotspot may produce smaller fields in the lobe backflow. However, if the hotspot field was random, the toroidal hotspot component would be reduced from our value by only and would evolve independently of the poloidal field components, resembling Figure 6, (iv) if viscous turbulence is the agency that stabilizes KH instabilities, the orientation of the magnetic field inside the lobes would be more random, possibly resulting in field loss by reconnection, (v) perhaps CR electrons are accelerated by turbulence in the lobe environment so their synchrotron lifetime can be less than the flow time from the hotspot, (vi) the hotspot field may increase with time, etc. In any case, the substantive conclusions we discuss below are unaffected by the precise magnitude of the radio lobe field, assuming Lorentz terms can be ignored.
Of particular interest in Figure 6 is the general increase in magnetic energy density with increasing distance from the hotspot due to compression in the decelerating boundary backflow seen in Figure 5 – the field follows the gas flow, not its density. According to equation (16), as an initially uniform backflow () in the -direction decelerates (), the field grows exponentially , assuming that the hotspot field is roughly constant with time. Such spatial field variations have not been considered in estimates of mean fields in FRII sources, although gradients in might be detectable by comparing radio synchrotron and X-ray (IC-CMB and/or SSC) emission from different parts of the radio lobe. If the field increases along the boundary backflow as we propose, this would also influence estimates of the radio-synchrotron age as a function of distance from the hotspot. Finally, in Figure 6 the field is seen to essentially disappear near the jet axis. The similarity of the two panels in Figure 6 indicates that viscosity has little to do with the post-hotspot evolution of the field.
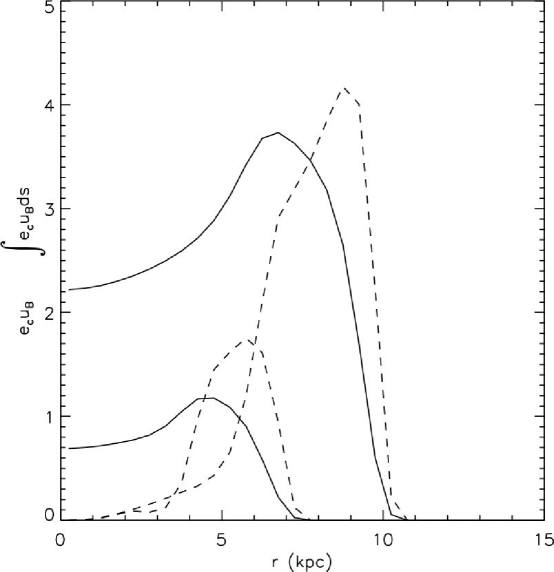
Aside from difficulties normalizing the magnetic field in the lobe with that in the hotspot, the field variations in the lobe we compute have a morphology entirely consistent with radio observations of Cygnus A and other similar FRII sources. Following equation (12), we expect the radio lobe synchrotron emissivity to vary as the product of CR and magnetic energy densities, . Likewise, the radio surface brightness distribution in the lobe is proportional to the integral of the emissivity over the line of sight, . In Figure 7 (top) we plot surface brightness (solid lines) and corresponding emissivity profiles (dashed lines) transverse to the jet direction at two distances and 45 kpc. Although the surface brightness is fairly uniform with , it is seen that the emissivity is strongly peaked toward the boundary backflow and is not uniform throughout the radio lobe as commonly assumed. This limb-brightened emission pattern closely matches observations of Cygnus A shown at the bottom of Figure 7 (Carvalho et al. 2005) and many other FRII sources (Daly et al. 2010), clearly indicating that many FRII lobes are radio-hollow. This is an excellent overall confirmation of the boundary backflow we calculate for Cygnus A. [A similar emitting boundary backflow can explain the nearly uniform gamma ray surface brightness across the Fermi bubbles in the Milky Way (Guo et al. 2012) as observed by Su, Slatyer, & Finkbeiner (2010).]
Regarding the discrepancy between field strengths computed in the Cygnus A hotspots and lobes, suppose shear in and near the backflow is sufficient to amplify non-toroidal fields to be in equipartition with the CR energy density, G or larger. This could be a problem with the lower panel in Figure 7 since the Lorentz force of poloidal fields comparable to would further broaden the width of the computed backflow, conflicting with the backflow widths observed by Carvalho et al. (2005) in addition to the small lobe fields estimated by Yaji et al. (2010).
4.2. Radio–X-ray Offset in Hotspot
High resolution VLA and Chandra observations of FRII hotspots indicate that radio hotspots are often offset several kpc further along the jet direction from the X-ray hotspots (Hardcastle, Croston & Kraft 2007; Kataoka et al. 2008; Perlman et al. 2010; Erlund et al. 2007, 2010). Similar radio-X-ray offsets have been observed in knots (internal shocks) in radio jets as in Cen A (Hardcastle et al. 2003) and elsewhere.
But radio-X-ray offsets are not observed in the four hotspots in Cygnus A (Wilson et al. 2000). Although the currently observed jet has moved away, no longer impacting any of the hotspots (Fig. 1 center) – it must be recognized that an abruptly redirected jet leaves behind a jet fragment that continues to impact the old hotspot. Hotspots without jet excitation should decay rapidly in a sound-crossing time, only yrs. Multiple hotspots in FRII sources are common, suggesting that the jet direction changes abruptly through small angles. Apparently the jet direction in FRII sources does not move slowly, as expected for example by black hole precession, since multiple hotspots are often widely separated and each hotspot is highly concentrated, lacking comet-like extensions. Evidently, the re-directed, spotless current jet (Fig. 1 center) has not yet reached dense cluster gas at the inner boundary of the radio cavity.
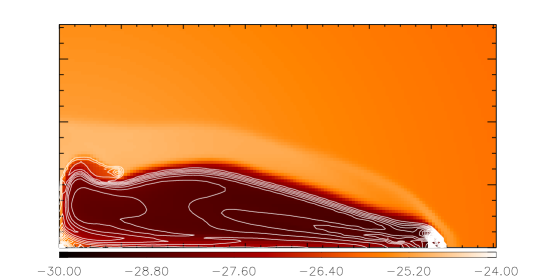
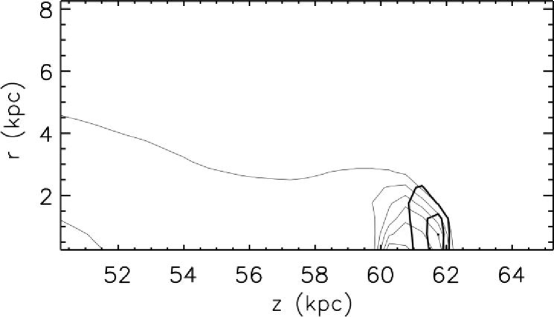
However, the moving hotspots in our computed FRII flows are by design continuously activated by the (virtual) jet and they are capable of producing radio-X-ray offsets. To illustrate this, in Figure 8 we show the projected appearance of the hotspot region at time 10 Myrs approximately as it would currently appear at X-ray IC-CMB and radio frequencies. Figure 9 shows the variation of flow parameters along the jet direction in the hotspot region. From equations 10-15 and Figure 9 the X-ray IC-CMB emissivity () is expected to peak at the hotspot with the local energy density of CR electrons . The light line contours in Figure 8 show the CR energy density integrated along the line of sight, . These contours, peaking at the hotspot position ( kpc), characterize the surface brightness distribution of IC X-ray emission from upscattered CMB photons inside the hotspot wind. The radio synchrotron surface brightness is represented with a similar integral over our surrogate for the synchrotron emissivity, , shown in Figure 8 with heavy line contours peaking in an arc-shaped region ahead of the hotspot at kpc. If the Cygnus A hotspots were currently activated by a jet, our computed flow would predict a 1-1.5 kpc offset of radio from X-ray IC-CMB emission.
The emissivity of X-ray SSC radiation depends on the energy density of synchrotron radiation which is non-local and should be calculated with an integration over the entire radio-emitting region. In view of its more complex non-local nature, we do not plot the SSC X-ray surface brightness in Figure 8. However, guided by the approximate relations 10-15 and Figure 9, SSC X-ray emission may not peak at the hotspot ( kpc) like IC-CMB, but much closer to the radio-synchrotron arc ( kpc). The energy density in synchrotron radiation on kpc scales inside a volume centered at the arc-emitting region in the hotspot wind is erg cm-3 where erg s-1, Mpc and Jy Hz (Stawarz et al. 2007). If most of the radio synchrotron emission comes from the arc offset region, the radius of the arc emission is about a third of the hotspot-arc offset distance. If so, the synchrotron energy density at the hotspot should be lower, .
To produce X-ray photons of energy keV from IC-CMB upscattered CMB photons of typical energy erg, we require CR electrons with energy . Likewise, photons of frequency GHz near the radio peak in Cygnus A (Figs. 5 and 6 of Stawarz et al. 2007) require CR electrons of energy to upscatter to 1 keV. From equations 13 and 14 the ratio of SSC and IC-CMB X-ray emission from the arc region is
where is found from the CR electron energy distribution (Fig. 8 of Stawarz et al 2007). The ratio of IC-CBM X-ray emission from the hotspot region to IC-CMB from the arc is
where we consider the same volume in both regions and assume . The ratio of SSC X-ray emssion between the hotspot and arc is roughly
X-ray emission from SSC is expected to appear throughout the hotspot-arc region while IC-CMB is more concentrated in the hotspot, so we expect the total nonthermal X-ray emission to incerase somewhat toward the radio arc,
These approximate considerations suggest that the most intense nonthermal X-ray emission is SSC near the radio-synchrotron arc, about 10 times brighter than IC-CMB X-rays from the hotspot. This may explain why radio-X-ray offsets in Cygnus A are small or difficult to observe. Other FRII sources with more pronounced radio-X-ray offsets may require . Furthermore, the G magnetic field, estimated for Cygnus A by Stawarz et al. (2007) from a one-zone radio and X-ray SSC emission model, probably refers to the enhanced field in the offset region as we have assumed. In our calculation the field we impose in hotspot grid zones is about half that in the arc region, but this field reduction of provides only a partial explanation of the hotspot-lobe field disparity in our dynamical model.
The physical origin of the offset lies in the powerful outflowing wind from the hotspot which is the source of both CR and magnetic energy for the entire radio cavity. X-ray IC-CMB emission is expected to peak in the hotspot where and Compton scattering are greatest at any time. The CR energy density inside the computed hotspot, erg cm-3, is required to inflate the Cygnus A cavity volume during the 10 Myr age of the FRII event. This hotspot CR energy density is about ten times larger than the total CR electron energy density required by Stawarz et al. (2007) to explain non-thermal hotspot emission; this argues against electron pair dominance and implies an additional component of relativistic protons. The CR energy density in our computed hotspot is also about ten times larger than the average value of in the radio lobe, consistent with a hotspot wind. The magnetic field introduced inside the high pressure hotspot is immediately advected away in the hotspot wind in every direction except upstream into the oncoming jet. As the wind from the hotspot flows in the forward (jet) direction, it soon encounters much denser cluster gas behind the bowshock, The magnetic field advected away from the hotspot in the forward flowing wind accumulates and increases in strength as the wind decelerates toward the dense gas ahead, creating in projection an arc-shaped radio hotspot offset ahead of the X-ray hotspot as seen in Figure 8.
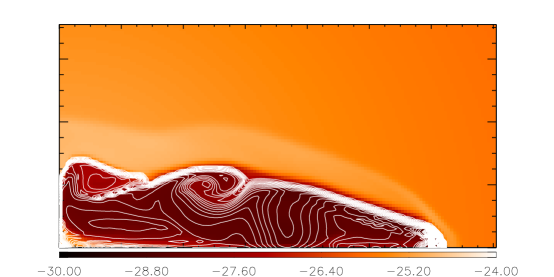
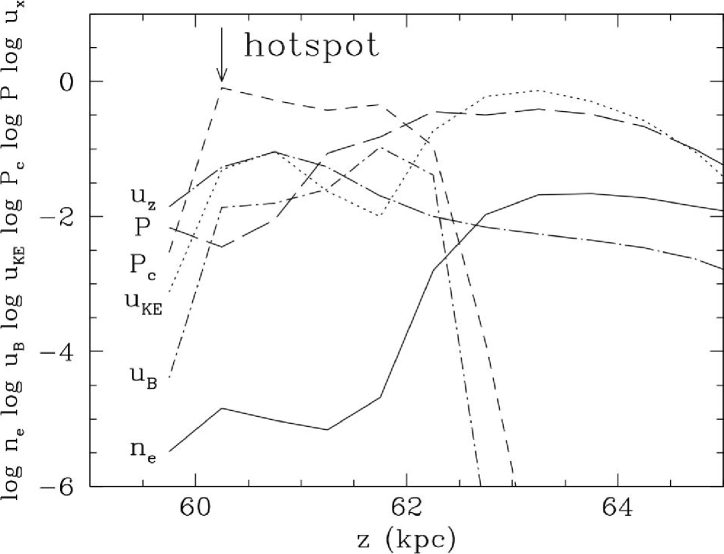
Close-up details of the structure of the hotspot region along the -axis are shown in low spatial resolution in Figure 9. The arrow designates the instantaneous hotspot location kpc at time Myr. The hotspot wind extends in the jet direction to kpc. The pressure in the wind is dominated by CRs, , and decreases away from the hotspot. The wind is subsonic since its kinetic energy density is much less than that of the CRs, . The magnetic field introduced into the hotspot G is immediately advected away in the wind. The field strength in the wind has a small energy density, , but increases significantly above due to deceleration in the forward directed wind, i.e. . At kpc the CR pressure in the wind is balanced by the gas pressure in the shocked cluster gas ahead so the total pressure varies smoothly across the wind-cluster gas interface . Figure 9 shows that the gas velocity and density are also continuous at kpc with no local change in slope, indicating that this interface, close to the region of maximum magnetic energy density in the radio peak, behaves as a contact discontinuity.
Although our calculation is time-dependent, one expects that the narrow region between the reverse shock in the hotspot and the bowshock ahead does not evolve rapidly and is approximately in steady state. Adopting a simple one-dimensional steady state approximation for this intershock flow along the jet axis, we expect that the location of the reverse shock in the hotspot can be dictated by the location of the bowshock provided the Mach number relative to the contact discontinuity velocity
| (17) |
is everywhere less than unity, where
| (18) |
is the local sound speed. A detailed analysis of our computed flow verifies that along the jet axis () throughout the intershock flow. The hotspot wind is also subsonic, which may set an interesting lower bound on the density of hot gas it contains. Although it is gratifying that the position of the reverse shock and therefore the hotspot can be governed by subsonic communication with gas behind the bow shock ahead, in our simple computation the velocity and location of the hotspot are prescribed in advance. In a detailed, more realistic FRII computation that includes a self-consistent calculation of the jet, the reverse shock and hotspot location – and the radio-X-ray offset – would be automatically regulated by the intershock flow. Deeper X-ray observations of subsonic hotspot winds may serve to reveal the physical constituents of the hotspot and the jet from which it was created: density of non-relativistic gas, density of CR electrons or electron pairs, magnetic energy, etc.
Offsets of radio emission from X-ray bright hotspots have been observed in a number of FRII sources by Hardcastle, Croston & Kraft (2007). For example the VLA 8.3 GHz image of the brightest western hotspot in 3C 227 is offset about 1.3 kpc further along the jet direction beyond the Chandra X-ray hotspot. Both hotspots are elongated in directions perpendicular to the jet with diameters of kpc and kpc respectively for X-ray and radio spots. As we show in Figure 8, the computed radio hotspot emission extends transversely right along the outermost arc-shaped tip of the cavity radio source.
Also encouraging are recent multifrequency observations of the incredibly powerful FRII hotspot in 4C74.26 (Erlund et al. 2007; 2010) having a radio–X-ray hotspot structure that supports our rudimentary offset image in Figure 8. The X-ray luminous 4C74.26 hotspot is preceded by an arc of radio emission that is offset by 19 kpc (!) in projection. The large offset distance is due in part to the low ambient cluster gas density since the 4C74.26 hotspot is about kpc from the cluster center. The hotspot in 4C74.26 is only detected in X-rays while the forward-displaced arc is seen at radio, IR, optical and X-ray wavelengths. Since no radio emission is observed at the X-ray hotspot, Erlund et al. (2010) propose that the X-ray emission from the 4C74.26 hotspot is synchrotron in origin, probably due to a very energetic CR electron spectrum. Normally, we expect synchrotron emission to be concentrated in the decelerating arc ahead of the hotspot as in Figure 8, but in 4C74.26 the synchrotron lifetime of X-ray emitting electrons with frequency Hz is very short, yrs. This lifetime is very much less than the flow time from the hotspot to the radio arc in Figure 9, yrs. For any reasonable hotspot field X-ray emitting synchrotron electrons are necessarily confined near their origin in the hotspot core. X-rays from the leading arc-hotspot are CMB photons IC-upscattered by radio synchrotron electrons there. In spite of these radiative differences, the hotspot morphology observed by Erlund et al. closely resembles the offset morphology we illustrate in Figure 8. However, we interpret the arc-shaped radio hotspot as a result of an intensified field caused by deceleration of a subsonic hotspot wind, not necessarily an additional (third) shock as proposed by Erlund et al. (2010).
4.3. Thermal X-ray Jet-Filament and Sheath
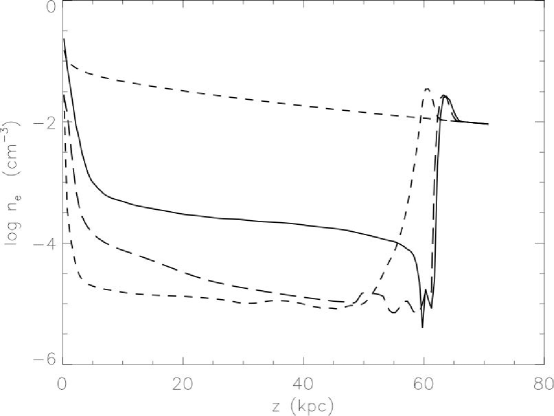
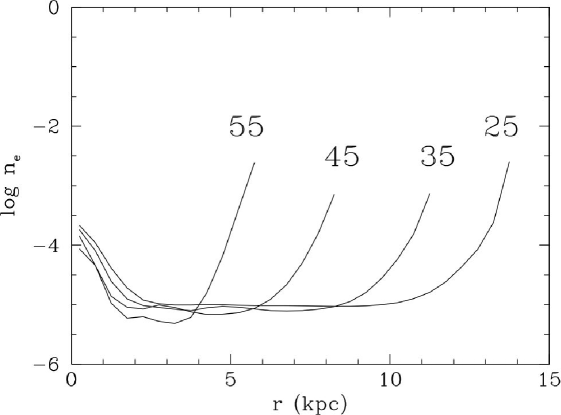
The solid line profile in Figure 10 (top) shows a narrow thermal gas density concentration along the jet axis. A smaller density is seen at kpc, but at kpc the gas density in the radio cavity is about three percent of that in the original cluster atmosphere (upper dashed line). Density profiles transverse to the jet direction are shown in Figure 10 (bottom) with central peaks due to the radial filament.
A similar faint radial X-ray feature is also observed in Cygnus A just along the symmetry axis (Figure 1 top). An X-ray spectrum of the brighter eastern half of this X-ray filament by Steenbrugge, Blundell & Duffy (2008) is found to have a non-thermal spectrum with photon spectral index of 1.7, possibly with a small additional thermal contribution. On the basis of this observation, which includes all X-ray emission from the cavity and cluster along the line of sight, these authors conclude that this diffuse X-ray filament is the non-thermal relic of a previous jet. However, they did not compare the emission from the filament with its immediate cavity environment which, according to Yaji et al. (2010), is filled with SSC and IC-CMB X-radiation with a nearly identical spectral index 1.7. Yaji et al. explicitly exclude the X-ray filament and hotspots from their spectral analysis. Consequently, the interpretation of this faint linear X-ray feature as a dying jet is less compelling because it is immersed in non-thermal emission having a similar X-ray spectrum. Moreover, there is no comparable X-ray emission from the current, more youthful western radio jet visible in Figure 1.
We propose instead that this X-ray filament is a mid-cavity upflow of thermal gas similar to those computed in other X-ray cavities (e.g. Mathews & Brighenti 2008). An outward stream of (low-entropy, relatively high-metallicity) thermal gas from the cluster core is a natural reaction to a transient symmetric cavitation in cluster gas333 Radial post-cavity gas flows along the symmetry axis are analogous to the well-known reaction when a drop of water falls onto a perfectly quiescent water surface. The impacted surface is briefly made concave due to the momentum delivered by the falling drop, causing a splash. But immediately afterwards, water below the concave surface flows toward the symmetry axis as gravitational forces act to reestablish the original flat surface. But as this flow converges at the center of the depression, a small unidirectional jet of water squirts up far above the original water surface. The same effect occurs underneath a young approximately axisymmetric cluster cavity in which cluster gas flows down just outside the cavity walls, converges beneath the cavity and, without shocking, shoots radially up through the bubble, forming a supersonic thermal jet. The kinetic energy of the upflowing thermal jet comes from returning the potential energy it acquired during cavity formation. Post-cavity thermal jets or upflows are often referred to as gas that is “lifted” or “dragged” out by the cavity, but it is a natural gasdynamical response to the cavitation. Like its water analog, the thermal filament will eventually fall back to the cluster core on a dynamical time scale. Gas further along the jet begins its fall back at progressively later times. . After a dynamical time, a few yrs, this filament will fall back to the cluster center with a turnaround point that moves upward along the filament (Mathews & Brighenti 2008).
Adopting this interpretation, the existence of this linear thermal filament indicates that the mean direction of the Cygnus A jet has remained approximately constant during the last 10 Myrs. While multiple hotspots represent recent changes in the jet direction, the time-averaged jet direction has not deviated much from the thermal X-ray jet-filament direction during the age of Cygnus A. Indeed, small asymmetries in the relatively dense thermal jet as it falls back near the cluster center may provide an easy explanation for the occasional redirection and misalignment of the Cygnus A jet. Both thermal and non-thermal jets share the same initial direction. If the inertia of the non-thermal jet is small, as is likely, it could be easily deflected by thermal gas in the cluster core. But the sustained linear alignment of the thermal jet over time indicates that the basic structure of Cygnus A is axisymmetric. The gas density and (as yet undetected) thermal X-ray emission along the Cygnus A filament depends on the uncertain gas density profile near the center of the cluster gas prior to the FRII energy release. The density structure of the X-ray thermal filament shown in Figure 10, based on our assumed initial cluster gas profile, is only representative.
The transverse cavity density profiles (Fig. 10 bottom) extend only to the cavity boundary defined by a gas density that is one third of the original cluster gas density at that radius. Most of the mass inside the cavity is concentrated in the “thermal sheath” near its boundary. The origin of this sheath must be confirmed with calculations at higher resolution.
5. More Observational Verification Needed
Our objective in this computation of radio lobe dynamics in Cygnus A and other similar FRII sources is to describe key morphological and kinematic components observed inside the lobes. Consequently, we require a computational resolution comparable with those of current radio and X-ray observations. Our computational accuracy is limited by several simplifying assumptions: (1) Our gasdynamics is non-relativistic. Occasional, spatially limited appearances of near relativistic velocities with are tolerated since the leading order special relativistic corrections to the hydrodynamic equations are of order (van Odyck 2004). (2) As discussed in MG10, we assume for gas that is initially non-relativistic. However, some gas inside the radio lobes rises to temperatures K for which , introducing errors of %. (3) Guided by observations of the Cygnus A hotspots and lobes, we assume that the magnetic field evolves passively with the gas flow and does not influence the overall lobe dynamics. Furthermore, we assume a simple toroidal magnetic field consistent with the radio polarization observed in the Cygnus A hotspots but not with that in the radio lobes.
However, it is unclear if 20-25% errors due to these computational approximations can be tested with current radio and X-ray observations. Cygnus A has received about 200ks of Chandra observations. Continued analysis of these observations, or still deeper observations, may help resolve the following questions of interest.
(1) Can the spatial and spectral variations of non-thermal (IC and SSC) X-ray emission be extracted from the thermal X-ray component in the radio lobe? Is it possible to produce cylindrically deconvolved transverse profiles of thermal and non-thermal X-ray emissivities in Cygnus A or elsewhere? Is the non-thermal X-ray emissivity limb-brightened as expected? How do the X-ray spectrum and surface brightness – and the corresponding cylindrically deconvolved emissivity – change across the sharply defined radio lobe boundary? Does the X-ray spectrum vary along the boundary backflow? Is the X-ray cavity slightly wider than the radio lobe due to the hot “thermal sheath” seen in Figures 2 and 4? In MG10 we found deep, easily observable X-ray cavities in Cygnus A when viewed only in thermal emission, but cavities are less apparent in the X-ray image in Figure 1. Is the cavity by chance filled in with non-thermal X-ray emission?
(2) Is X-ray emission from the radial filament along the symmetry axis thermal? Can its density be determined? Does this filament consist of cooler, relatively low entropy, metal rich gas as expected? What is the nature of non-axisymmetric thermal X-ray emission within about 30 kpc from the center (Fig 1 top)?
(3) What is the deconvolved (locally) axisymmetric variation of thermal and non-thermal X-ray emissivity within a few kpc of the Cygnus A (or other) hotspots? Can spatial variations in the hotspot wind be determined from radio or X-ray observations? Hotspot winds and the decay time of inactive hotspots may inform about the gas. field and CRs they contain.
(4) Velocity shear in the boundary backflow is expected to amplify poloidal magnetic fields and deceleration is expected to amplify the toroidal component. Can radio and X-ray IC and SSC observations verify that the magnetic field increases along (or across) the boundary backflow?
(5) At 5GHz near the peak radio intensity in Cygnus A, the VLA FWHM is nearly 1 kpc at Cygnus A (Wright & Birkinshaw 2004), comparable to the expected hotspot offset. Further radio observations of the hotspots with the new JVLA at 6-15 GHz with HPBW = 0.33-0.13 kpc may detect a radio offset. A detailed analysis of the Cygnus A X-ray hotspot may detect spatial and spectral differences between X-ray IC-CMB and SSC emission.
Finally, as pioneered by Carvalho et al. (2005) and Daly et al. (2010), whenever possible future radio and X-ray observations of bright axisymmetric FRII sources should be cylindrically deconvolved to determine emissivity profiles transverse to the lobe symmetry axis in physical units.
6. Summary and Discussion
We describe the axisymmetric gas and CR dynamical evolution of FRII radio sources similar to Cygnus A originating from a continuously active hotspot moving into an undisturbed cluster gas environment. The hotspot, regarded as the region where jet energy is isotropized, moves with constant velocity km s-1 where kpc is the currently observed distance of the Cygnus A hotspots from the galaxy core and Myr is the age of Cygnus A based on radio synchrotron aging observations. Most of the power erg s-1 delivered by the hotspot to the expanding radio cavity and the surrounding cocoon shock is contained in cosmic rays (CRs) emerging behind the powerful reverse shock at the inner boundary of the hotspot where the jet impacts. We assume that the contents of the evolving hotspot are continuously renewed to resemble those currently observed in Cygnus A: CR energy, a passive toroidal magnetic field and a small mass of hot gas.
Computations of FRII flows including only gas pressure gradients and gravity match several, but not all important attributes of observed FRIIs. The cavity volume and cocoon shock are similar to those observed in Cygnus A at time 10 Myrs (MG10). Gas and CRs flow rapidly from the hotspot source, but are forbidden to flow upstream directly into the oncoming jet. This boundary condition helps re-direct CRs and gas in the hotspot outflow back along the boundary of the radio cavity, forming a boundary backflow. To determine the CR age in the radio cavity, we compute the product of the instantaneous gas density and time in the hotspot, , and follow its subsequent flow inside the radio lobe. In straightforward FRII computations with gas pressure gradients and gravity, Kelvin-Helmholtz (KH) shear instabilities scramble CR ages in the interior of the radio cavity and wrinkle the cavity boundary, neither of which are observed.
Therefore it is necessary to seek solutions in which the KH features are damped, either by magnetic fields or viscosity. Magnetic KH damping might be possible if the thermal gas density in the radio cavities is much lower than we expect. But we explore here the possibility that undesired KH features are damped by viscous forces. Viscous and diffusive transport properties in a weakly magnetic radio cavity containing gas and relativistic CRs are poorly understood, particularly since the mean free path for Coulomb scattering is vastly larger than the Larmor radius. The viscosity we invoke may be turbulent in origin. Regardless of how the KH instability is damped, the boundary backflow is expected to shear and decelerate. Along the boundary backflow poloidal fields will be amplified by shear and toroidal fields by compression.
The flow inside the radio cavity becomes ordered in a remarkable way when the KH instability is damped with a small uniform viscosity. As in our non-viscous computations, the radio synchrotron emission is confined in a boundary backflow. But damping the KH instability allows CR ages to remain spatially ordered long after they leave the hotspot and surface KH features largely disappear. Viscosity provides the same excellent improvement for FRII sources as it does for the Fermi bubbles in the Milky Way (Guo & Mathews 2012; Guo et al. 2012). With viscosity included the CR boundary backflow persists throughout the length of the cavity as commonly observed for FRII sources (e.g. Alexander & Leahy 1987). The radio synchrotron emissivity is very strongly limb-brightened at the radio lobe boundary, similar to recent detailed radio observations of Cygnus A and other FRII sources (Carvalho et al. 2005; Daly et al. 2010).
We also explore the evolution of passive toroidal magnetic fields consistent with radio polarization morphology observed in the Cygnus A hotspots. CRs and magnetic field flow out from the hotspot, filling the cavity. Our calculation may be the first to establish an approximate relationship between the magnitude of the hotspot field and the field observed in the much larger radio cavity. While the field orientation in the Cygnus A hotspot is mostly toroidal, radio polarization observations reveal non-toroidal field components downstream inside the radio cavity. An idealized perfectly toroidal field expelled from an ideally axisymmetric hotspot remains toroidal after flowing into the radio lobe. Toroidal fields cannot suppress KH instabilities, do not experience laminar shear amplification, and may weaken or suppress viscous momentum diffusion in the -direction across the boundary backflow. The toroidal field we consider intensifies by compression along the decelerating backflow. If the hotspot contains additional poloidal field components, they would be shear-amplified in the radio cavity backflow, but the overall amplification may not be as large as that of the purely toroidal fields we consider. Radio lobe fields may also be isotropized by the turbulent viscosity we require to smooth the lobe kinematics. Nevertheless, we find that a purely toroidal hotspot field of G, as suggested by the SSC models of Stawarz et al. (2007), remains much too large (even exceeding ) after evolving into the decelerating radio lobe region. We speculate that the field in the hotspot may have been overestimated due to nearby downstream regions with larger fields or to inhomogeneities inside the complex post-shock hotspot interior, but it is unclear if these alone can fully explain the hotspot-lobe field discrepancy.
CRs and hot gas flowing in the hotspot wind push aside nearby gas in the radio lobe. In particular, as the CR-dominated hotspot wind decelerates toward the dense wall of shocked cluster gas directly ahead of the hotspot, the magnetic field in the wind is amplified. This has the effect of enhancing the radio synchrotron emission from this region, producing a small arc-like radio-bright region offset 1-2 kpc ahead of the hotspot. The radio surface brightness in this arc exceeds that from the hotspot. Nonthermal IC-CMB X-ray emission probably peaks near the hotspot shock, while SSC X-ray emission peaks closer to the offset radio synchrotron peak, reducing the overall radio-X-ray offset.
While the position and velocity of the hotspot are fully prescribed in our calculation, we expect that the reverse shock in an unconstrained hotspot is naturally located by subsonic hydrodynamic communication with gas behind the bow shock. High resolution computations will be required to accurately determine the detailed structure of this complex hotspot region. The properties of the hotspot wind required to match the hotspot offset morphology may constrain the particle and field contents of both the hotspot and jet.
Our computation also reproduces the faint, presumably thermal X-ray radial filament visible in X-ray images of Cygnus A. This narrow filament is an expected gasdynamical reaction to the formation of an axisymmetric low density cavity in the cluster gas.
Our computations are approximate in several ways:
We do not treat with precision the spatially limited appearance of mildly relativistic velocities nor the transition of thermal cluster gas to mildly relativistic temperatures.
We overlook a possible inconsistency inside the radio cavity in which viscous momentum transport occurs perpendicular to our assumed toroidal magnetic field passively evolving from the hotspot. However, radio polarization in the Cygnus A cavity indicates that the radio lobe field is not purely toroidal.
7. Conclusions
Our gas dynamical calculation is successful in matching many detailed observations of Cygnus A and other FRII sources:
We describe a “boundary backflow” from which most of the strongly limb-brightened radio synchrotron emission occurs in agreement with FRII observations.
The trend in ages of radio synchrotron electrons along and transverse to the boundary backflow are monotonically organized, resembling observations.
To achieve this smooth variation of apparent synchrotron ages and smooth radio lobe boundaries, it is necessary to damp Kelvin-Helmholtz shear instabilities. This can be done with a small viscosity of uncertain origin, which we propose here, or possibly with magnetic tension provided the plasma density inside the radio lobe is considerably smaller than expected.
Our approximate calculation of toroidal magnetic fields passively evolving from the hotspot into the radio lobe allows us to relate the observed field strength in these two regions. If radio cavity fields evolve from toroidal fields estimated in the Cygnus A hotspots, the fields in the radio-emitting backflow are about 10-20 times larger than those observed, G. The origin of this disparity is unclear. Perhaps the field in the physically complex hotspots is lower than expected. The CR energy density inside our computed hotspot, required to inflate the Cygnus A cavity, is about ten times larger than the total CR electron energy density previously estimated, suggesting an additional hotspot component of non-radiating particles.
Low surface brightness X-ray emission in Cygnus A along the symmetry axis of each radio lobe can be understood as a jet or filament of thermal gas flowing from the cluster core, an expected hydrodynamic feature that accompanies all rapidly formed axisymmetric cavities in cluster gas. We speculate that small asymmetries in the relatively dense innermost part of this thermal jet, perhaps as it falls back, are responsible for sudden changes in the direction of the non-thermal jet in Cygnus A, particularly since the non-thermal jet is likely to have a rather small inertia.
When viewed in projection, our computed FRII flows predict two spatially distinct regions of enhanced non-thermal emission associated with the hotspot and its wind. Enhanced CRs directly behind the hotspot shock cause this region to emit nonthermal IC-CMB X-rays. Radio synchrotron emission is strongest in a second, more extended arc-shaped region 1-2 kpc ahead in the decelerating hotspot wind where the magnetic field is increased by compression. Nonthermal SSC X-ray emission, expected to be somewhat more luminous than IC-CMB X-ray emission, peaks in the hotspot wind near the radio synchrotron offset. Nonthermal X-ray emission is expected throughout the hotspot-arc region.
A narrow layer of very hot gas appears to backflow along the cavity wall just outside the radio cavity, causing the X-ray cavity to appear slightly larger than the radio lobe. This “thermal sheath”, marginally resolved in our calculation, may contain most of the thermal gas inside the X-ray cavity.
8. Acknowledgments
We have benefited significantly from helpful advice suggested by the referee. Studies of feedback gasdynamics in hot intracluster gas at UC Santa Cruz are supported by NSF and NASA grants for which we are very grateful.
APPENDIX
Viscous Terms
In cylindrical coordinates the and components of are
and
respectively where the viscosity is regarded as constant. The viscous term in the internal energy equation is
References
- (1)
- (2) Alexander, P., Leahy, J. P., 1987, MNRAS, 225, 1
- (3)
- (4) Black, A. R. S., Baum, S. A., Leahy, J. P., Perley, R. A., Riley, J. M., Scheuer, P. A. G., 1992, MNRAS, 256, 186
- (5)
- (6) Blandford, R. D., Rees, M. J., 1974, MNRAS, 169, 395
- (7)
- (8) Bonafede, A.; Feretti, L.; Murgia, M.; Govoni, F.; Giovannini, G.; Dallacasa, D.; Dolag, K.; Taylor, G. B., 2010, A&A, 513, 30
- (9)
- (10) Carilli, C. L., Kurk, J. D., van der Werf, Paul P., Perley, R. A., Miley, G. K., 1999, AJ, 118, 2581
- (11)
- (12) Carvalho, Joel C., Daly, Ruth A., Mory, Matthew P., O’Dea, Christopher P., 2005, ApJ, 620. 126
- (13)
- (14) Carvalho, J. C., O’Dea, C. P., 2002, ApJS, 141, 371
- (15)
- (16) Chandrasekhar, S. 1961, Hydrodynamic and hydromagnetic stability, (Cambridge U. Press: Cambridge), 481
- (17)
- (18) Clarke, D. A., Harris, D. E., Carilli, C. L.. 1997, MNRAS, 284, 981
- (19)
- (20) Daly, R. A., Kharb, P., O’Dea, C. P., Baum, S. A., Mory, M. P., McKane, J., Altenderfer, C., Beury, M., 2010, ApJS, 187, 1
- (21)
- (22) Dursi, L. J., & Pfrommer, C., 2008, ApJ, 677, 993
- (23)
- (24) Erlund, M. C., Fabian, A. C., Blundell, K. M., Crawford, C. S., Hirst, P., 2010, MNRAS, 404, 629
- (25)
- (26) Erlund M. C., Fabian A. C., Blundell K. M., Moss C., Ballantyne D. R., 2007, MNRAS, 379, 498
- (27)
- (28) Feretti, L., Bonafede, A., Giovannini, G., Govoni, F., Murgia, M., 2009, (arXiv0910.1519)
- (29)
- (30) Guo, F., Mathews, W. G., 2012, ApJ (submitted) (arXiv1103.0055)
- (31)
- (32) Guo, F., Mathews, W, G., Dobler, G., Oh, S. P., 2012, ApJ, (submitted) (arXiv1110.0834)
- (33)
- (34) Hardcastle, M. J., Croston, J. H., 2010, MNRAS, 404, 2018
- (35)
- (36) Hardcastle, M. J., Croston, J. H., Kraft, R. P., 2007, ApJ, 669, 893
- (37)
- (38) Hardcastle, M. J., Worrall, D. M., Kraft, R. P., Forman, W. R., Jones, C., Murray, S. S., 2003, ApJ, 593, 169
- (39)
- (40) Hodges-Kluck, E. J., Reynolds, C. S., 2011, ApJ 733, 58
- (41)
- (42) Huarte-Espinosa, M., Krause, M., Alexander, P., 2011, MNRAS, 418, 162
- (43)
- (44) Jones, T. W., 2008, Extragalactic Jets, ASP Conf. Series, vol 386, (eds Travis A. Rector and David S. De Young), 398
- (45)
- (46) Jones, T. W., Kang, H. 1990, ApJ, 363, 499
- (47)
- (48) Kaiser, C. R., Alexander, P., 1997, MNRAS, 286, 215
- (49)
- (50) Kataoka, J. et al. 2008, ApJ, 685, 839
- (51)
- (52) Kharb, P., O’Dea, C. P., Baum, S. A., Daly, R. A., Mory, M. P., Donahue, M., Guerra, E. J., 2008, ApJS 174, 74
- (53)
- (54) Krause, M., 2005, A&A, 431, 45
- (55)
- (56) Laing, R. A. 1980, MNRAS, 193, 439
- (57)
- (58) Machalski, J., Chyzy, K. T., Stawarz, L., Koziel, D., 2007, 462, 43
- (59)
- (60) Mathews, W. G., Guo, F., 2011, ApJ, 736, 6
- (61)
- (62) Mathews, W. G., Brighenti, F., 2008, ApJ, 676, 880
- (63)
- (64) Mathews, W. G., Guo, Fulai, 2010, ApJ, 725, 1440
- (65)
- (66) O’Neill, S. M., Jones, T. W., 2010, ApJ, 710, 180
- (67)
- (68) Orienti, M., Venturi, T., Dallacasa, D., D’Ammando, F., Giroletti, M., Giovannini, G., Vercellone, S., Tavani, M., 2011, MNRAS, 417, 359
- (69)
- (70) Perley, R. A. & Carilli, C. L., 1996, in “Cygnus A – Study of a Radio Galaxy”, Proceedings of the Greenbank Workshop, held in Greenbank, West Virginia, 1-4 May, 1995. Edited by C.L. Carilli and D.E. Harris. ISBN 0521553431, Cambridge University Press, 1996., p.168
- (71)
- (72) Perlman, E. S., et al. 2010, ApJ, 708, 171
- (73)
- (74) Pfrommer, C. & Dursi, L. J., 2010, NatPh, 6, 520
- (75)
- (76) Reynolds, C. S., McKernan, B., Fabian, A. C., Stone, J. M., Vernaleo, J. C., 2005, MNRAS, 357, 242
- (77)
- (78) Roediger, E., Bruggen, M., 2008, MNRAS 388, L89
- (79)
- (80) Saxton, C. J.; Sutherland, R. S.; Bicknell, G. V.; Blanchet, G. F.; Wagner, S. J., 2002, A&A, 393, 765
- (81)
- (82) Schekochihin, A. A., Cowley, S. C., Rincon, F., Rosin, M. S., 2010, MNRAS, 405, 291
- (83)
- (84) Scheuer, P. A. G. 1974, MNRAS, 166, 513
- (85)
- (86) Sironi, L. & Spitkovsky, A. 2009, ApJ, 98, 1523
- (87)
- (88) Smith, D. A., Wilson, A. S., Arnaud, K. A., Terashima, Y., Young, A. J., 2002, ApJ, 565, 195
- (89)
- (90) Stawarz, L., Cheung, C. C., Harris, D. E., Ostrowski, M., 2007, ApJ, 662, 213
- (91)
- (92) Steenbrugge, K. C., Blundell, K. M., Duffy, P. 2008, MNRAS, 368, 1465
- (93)
- (94) Steenbrugge, Katrien C., Heywood, Ian, Blundell, Katherine M., 2010, MNRAS, 401, 67
- (95)
- (96) Stone, J. M, Norman, M. L., 1992, ApJS, 80, 753
- (97)
- (98) Su, M., Slatyer, T., Finkbeiner, D., 2010, ApJ, 724, 1044
- (99)
- (100) Tatisheff, V. 2008, in Proceedings of the conference “Supernovae: lights in the darkness”, Oct. 3-5, 2007, Mao, Menorca, Spain, PoS, (Trieste:SISSA) (arxiv:0804.1004)
- (101)
- (102) Tingay, S. J., Lenc, E., Brunetti, G., Bondi, M. 2008, ApJ, 136, 2473
- (103)
- (104) van Odyck, D. E. A., 2004, Int. J. Numer. Meth. Fluids 44, 861
- (105)
- (106) Vikhlinin, A.; Kravtsov, A.; Forman, W.; Jones, C.; Markevitch, M.; Murray, S. S.; Van Speybroeck, L., 2006, ApJ, 640, 691
- (107)
- (108) Wilson, A. S., Smith, D. A., Young, A. J., 2006, ApJ, 644, L9
- (109)
- (110) Wilson, A. S.; Young, A. J.; Shopbell, P. L., 2000, ApJ, 544, 27
- (111)
- (112) Wright, M. C. H. & Birkinshaw, M. 2004, ApJ, 614, 115
- (113)
- (114) Yaji, Y., Tashiro, M. S., Isobe, N., Kino, M., Asada, K., Nagai, H., Koyama, S., Kusunose, M., 2010, ApJ, 714, 37
- (115)