Percolation General studies of phase transitions Statistical mechanics of model systems Complex systems
Restricted Exclusion Processes without Particle Conservation Flows to Directed Percolation
Abstract
Absorbing phase transition in restricted exclusion processes are characterized by simple integer exponents. We show that this critical behaviour flows to the directed percolation (DP) universality class when particle conservation is broken suitably. The same transition, when studied using the average density as the controlling parameter, yields critical exponents quite different from DP; we argue that these exponents are actually related to DP by a scaling factor These conclusions also apply to conserved lattice gas in one dimension.
pacs:
64.60.ahpacs:
64.60.-ipacs:
64.60.Depacs:
89.75.-kDirected percolation(DP)[1] is the most dominant universality class of absorbing phase transition (APT). The famous ‘DP conjecture’ [2] claims that that any APT with a fluctuating scalar order parameter should generically belong to DP class. Several models systems, like reaction diffusion processes[3], depinning transitions[4], damage spreading[5], synchronization transition[6], sand-pile models[7] and certain probabilistic cellular automata[8] are known to undergo APT belonging to this universality class. Recently the DP critical behaviour has been verified experimentally in context of liquid crystals[9].
Surprisingly, in spite of its robustness directed percolation does not have an exact solution, even in -dimension, although the critical exponents are calculated to high accuracy[10]. Only a few models of APT are solved exactly; examples include compact directed percolation (CDP)[11], branching-annihilating random walk (BARW)[12], conserved lattice gas (CLG) model in one dimension [13] and restricted asymmetric simple exclusion process (RASEP)[14]. The non-DP behaviours in CDP and BARW owe to the special symmetries of the order parameter, namely particle-hole symmetry and parity respectively. The scalar order parameters of CLG and RASEP do not have any special symmetry but it is coupled to an additional conserved field present in the system. Conventionally, presence of this additional field is blamed for these models to be in a non-DP class. This reasoning is consistent with the non-DP behaviour observed in fixed energy sand pile models[15] and a conjecture by Rossi et. al. [16] that critical behaviour of any APT in presence of a conserved field should differ from DP.
However, more recent investigations reveal [17] that the actual critical behaviour of one dimensional fixed energy sand-pile models belong to DP. The apparent non-DP behaviour was only a transient phenomenon; coupling of the order parameter to the additional conserved height field does not necessarily induce a new critical behaviour. APTs in energy exchange models[18] too show DP behaviour even though the total energy of the system is conserved. In view of these examples it is not convincing to accept ‘conservation’ as the cause of an absorbing transition not being in DP, unless one explicitly shows that the specific model flows to DP if the existing conservation is broken.
In this article we study the restricted asymmetric simple exclusion process (RASEP) as an example of a simple and exactly solvable non-DP critical behaviour in presence of a conserved density field. The dynamics of RASEP is extended to incorporate deposition and evaporation of particles in the bulk so that the conservation of density is violated; the system now undergoes an APT at a critical deposition rate . The resulting critical behaviour is found to be in the DP universality class. However, the critical exponents turn out to be much different from DP when the average density is treated as the control parameter, like the conserved RASEP. We show that these exponents are actually related to DP by a scaling factor as the singular behaviour of at the critical point is also characterized by DP exponents.
1 Model
The restricted asymmetric exclusion process is defined on a one dimensional periodic lattice labeled by sites The sites are either vacant or occupied by at most one particle; corresponding site variables are A particle from a randomly chosen site hops forward to its neighbouring vacant site only when it is preceded by at least particles. Thus, the model with a specific evolves according to the corresponding particle conserving dynamics,
| (1) | |||||
| (2) | |||||
| (3) |
Any configuration which does not have more than consecutive particles anywhere in the system is an absorbing configuration. If the system reaches such a configuration it gets stuck there forever. All the other configurations, which have at least one block of more than consecutive particles, are active. Since all the configurations with particle density are active, the APT is expected to occur at some lower density. It has been shown analytically [14] that the system undergoes an APT at exactly with critical exponents
| (4) |
Moreover, numerical simulations have suggested [19] that , and .
To claim that the conserved density is the sole cause of the non-DP behaviour of RASEP (Eq. (4)) we intend to break the conservation of density and investigate whether this truly drives the transition to the DP fixed point. However, any arbitrary dynamics that deposits (evaporates) particle at (from) a vacant (occupied) site may altogether wipe out the possibility of a phase transition of the system. For example, the simplest way one can break the density conservation is by augmenting the dynamics with
This bulk dynamics fixes the average density of the system However, there are no absorbing configurations left anymore as the dynamics allows any arbitrary configuration to become active eventually . Thus, the system is active for any and does not show any transition. To preserve the APT, the non-conserving dynamics must be designed suitably, so that the absorbing states are still present in the phase space. One possible way to ensure this is to device a dynamics which does not affect the existing absorbing configurations. In other words, one ought to deposit or evaporate particles only on active configurations - all the configurations which were absorbing in the conserved model would then still be absorbing in the non-conserved version.
A possible non-conserving local dynamics for RASEP, which fulfills this condition for any is
| (5) |
where fixes the density by controlling both the deposition and evaporation of particles. Clearly, large would correspond to high density. This dynamics, when added to the conserving evolution rule (3), allows addition or removal of a particle in the neighbourhood of an active site only. Absorbing configurations, which do not have or more consecutive particles, are not affected by the non-conserving dynamics (5).
Although the number of particles in the system fluctuates, the average density is a non-decreasing function of the deposition rate For small values of , the system is likely to get arrested in some absorbing configuration with number of particles . Again, for , the density fluctuates about a large average value (note that ) and the system remains active. Thus, we expect a transition from the active phase to the absorbing state when is decreased below a critical value such that
Let us discuss the case in details. This exercise can be repeated straightforwardly for any The complete dynamics for RASEP with is
| (6) | |||||
| (7) |
Any configuration devoid of is absorbing. In other words all the configurations which have two or more consecutive s are active. Thus,
| (8) |
plays the role of order parameter. In the following we use Monte-Carlo simulations to study the critical behaviour of this APT.
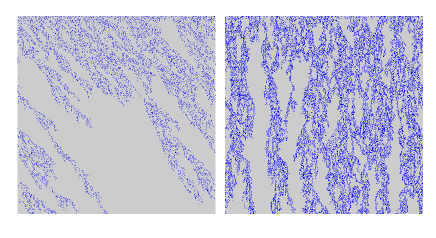
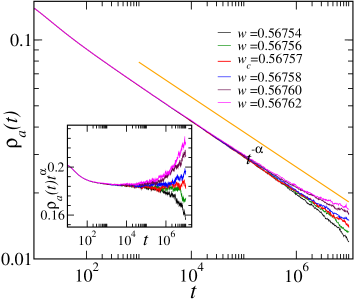
Critical point and decay exponent : Starting from a homogeneously active configuration, the activity at the critical point The propagation of activity is shown in the left panel of Fig. 1. In the active phase , the activity eventually saturates to some finite value and in the absorbing phase vanishes in the long time limit. One can then estimate the critical point and the exponent by plotting versus for different values of and looking for a power law decay. These estimates can be verified by plotting against for different values of the curve which remains horizontal in the long time limit corresponds to the critical point This procedure, illustrated in Fig. 2, leads to the estimates
The decay exponent is in very good agreement with the corresponding DP value (see Table 1). The density at the critical point is
which is slightly lower than the critical density for conserved RASEP (i.e. when dynamics (7) is absent). The detailed variation of with will be discussed later in this article.
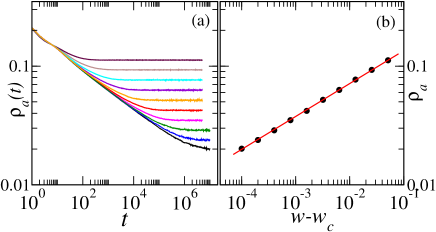
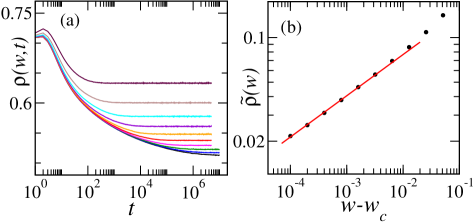
The order parameter exponent : In the super critical regime the activity saturates to some finite value This saturation value shows a power law behaviour near the critical point,
| (9) |
where is the order parameter exponent. Figure 3(a) shows plot of versus for various values of in the active phase. Corresponding saturation values are plotted against in Fig. 3(b). The slope of the resulting straight line gives an estimate
consistent with
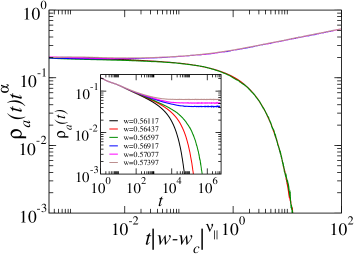
Off-critical simulations and : For , the activity obeys a scaling form
| (10) |
where is the characteristic time scale of the system. Near the critical point, both in the active () and absorbing () phase this scale is expected to diverge as
| (11) |
The exponent can, thus, be estimated by plotting versus for different values of and searching for a data collapse. This is shown in Fig. 4; the upper and lower branches correspond to and respectively. This gives us an estimate
which is also in good agreement with the corresponding DP value
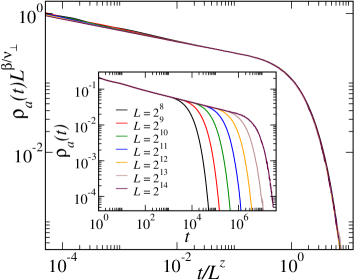
Finite size scaling : For a finite sized system the decay of activity at the critical point is expected to follow a scaling form
| (12) |
where is the dynamic exponent. Thus, at the critical point the plots of against for different values of are expected to collapse onto a single function. The best data collapse, as shown in Fig. 5, is obtained by using
The inset there shows the unscaled data for -. Both these estimates are consistent with the DP exponents. It should be noted that this value of is strikingly different from that of the ordinary conserved RASEP, where was known exactly[14].
The estimated exponents of non-conserved RASEP are summarized in Table 1 along with the corresponding exponents of DP for comparison. All the exponents are in excellent agreement with those of DP, indicating that RASEP indeed flows to the DP universality class when the density conservation is broken.
In ordinary RASEP, particle density was varied to observe an absorbing transition at It is therefore quite appropriate to ask whether the average density , which now depends on , can also be treated as control parameter in the non-conserved version. To answer this question, let us first look at the behaviour of near the critical point.
2 The density
The average particle density is a well defined function of the deposition rate in the supercritical phase Near the critical point, however, like all other observables the density is expected to have a non-analytic form,
| (13) |
where is the value to which the density saturates at the critical point and the exponent is related to the critical exponents, possibly in a non-trivial way.
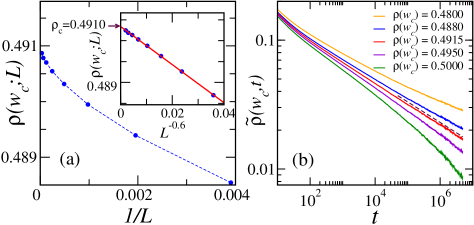
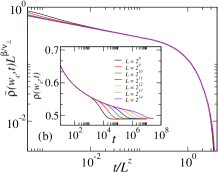
To estimate we need to determine accurately. This can be done by extrapolating the saturation value of density for a finite system of size to the thermodynamic limit. As illustrated in Fig. 6, approaches a finite value in this limit Since is not linear in it is useful to plot against with a suitable exponent that gives a straight line. The inset of Fig. 6(b) shows that does this job; a linear fit now gives an estimate .
A more accurate estimate of can be obtained from the decay of Since, the characteristic timescale diverges at the critical point, in the long time limit we expect the reduced density to decay algebraically
Then can be determined by plotting versus in double logarithmic scale and adjusting the value of in a way that the resulting curve is a straight line. This is shown in Fig. 6(a), and we have an estimate and We proceed further with this estimate of
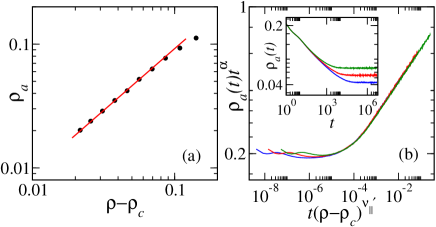
Determination of the exponent is described in Fig. 7, where saturation of for different values of is shown in the left panel. Corresponding obtained from this graph is plotted against in logarithmic scale in Fig. 7(b). The slope of this line over the first two decades corresponds to
Surprisingly, the exponents and , within the error bars, are identical to the DP exponents and respectively. This leads us to surmise that also undergoes an absorbing phase transition at with a decay exponent and order parameter exponent We investigate the other critical exponents to confirm that this transition, where the reduced density is the order parameter, also shows DP behavior.
First, the off critical scaling. In the inset of Fig. 8(a) we have plotted versus for different values of Unlike regime where the saturation density varies with in the sub-critical phase ensuring that the order parameter vanishes in this phase. The main figure Fig. 8(a) shows the plot of versus for different values of , which could be collapsed using
This value of , again, is compatible with DP.
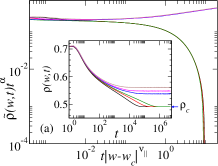
At the critical point, versus plot (see Fig 8(b)) for different values of collapse following a scaling form similar to Eq. (12) for
All these exponents are listed in Table 1. The fact that these exponents are consistent with those of as well as DP, leads us to conclude that in absence of particle conservation the reduced density can be regarded as an alternative order parameter.
3 Density as a control parameter
To have a direct correspondence with the APT in conserved RASEP, where density was tuned, we study the transition of the non-conserved model considering the average density as the tuning parameter. Evidently, the critical point translates to in the density axis. In the following we argue that the critical exponents of this versus transition are different from DP, but they can be expressed in terms of DP exponents in a trivial way.
Along the density axis, the distance from the critical point is since we have Therefore, critical exponents corresponding to those observables which vary algebraically with near the critical point (e.g. , and ) are now rescaled by a factor
| (14) |
Obviously, the decay exponent and the dynamic exponent do not change.
The rescaling of exponents Eq. (14) can be confirmed by re-plotting the data of Fig. 3(b) and Fig. 4 using instead of which is shown in Fig. 9. The left panel of the figure shows as a function of resulting in the order parameter exponent Data collapse according to scaling form Eq. (10) is shown in the right panel for the supercritical regime with an unusually large Note that in this scenario, sub-critical branch does not exist as the density does not vary for
It is worth mentioning that although the critical exponents of this transition, when viewed by tuning are widely different from those of DP, the basic underlying critical behaviour is DP. It is only a coincidence that, like the conserved RASEP the order parameter here varies linearly with near the critical point.
4 Restricted Symmetric Exclusion Process
Restricted Symmetric Exclusion Process (RSEP) is a variation of RASEP where a particle is allowed to move in forward (backward) direction when it is preceded (followed) by at least particles. In particular, the dynamics for which is identical to that of -dimensional conserved lattice gas (CLG), is
| (15) |
It was shown [14, 13] that this system also undergoes an APT with integer exponents (4) and belongs to the same universality class as RASEP. This non-DP behaviour seen in one dimensional CLG is very different from other related models with an additional conserved field, namely conserved threshold transfer process (CTTP) and conserved Manna model though all three models in two and higher dimensions show identical critical behaviour. In 1D, where CLG is exactly solvable, CTTP and Manna model shows a nontrivial absorbing phase transition belonging to DP. It is natural to ask, what makes CLG different from others ?
One possible cause, like in RASEP, is the presence of the conserved density field. To confirm this we add particle deposition and evaporation
| (16) |
to the dynamics (15) of CLG. Clearly, this dynamics preserves the absorbing configurations of the system, assuring that there is still an absorbing state transition. Detailed analysis of the model reveals that the transition occurring at is identical to the that observed in RASEP with except that the activity now propagates symmetrically in space, looking like a familiar DP cluster (see Fig. 1). The critical exponents characterizing this transition also belong to the DP class; we skip the details of this study here.
| APT | |||||
|---|---|---|---|---|---|
| DP [1] | 0.1594 | 0.2764 | 1.733 | 1.5802 | 0.2520 |
| vs. | 0.15984(7) | 0.278(1) | 1.74(1) | 1.58(1) | 0.254(4) |
| vs. | 0.1596(1) | 0.278(3) | 1.73(1) | 1.58(1) | 0.256(4) |
| vs. | - | 1 | 6.269 | - | - |
5 Summary
Restricted exclusion processes are known to undergo absorbing phase transitions characterized by integer exponents even though the order parameter is a fluctuating scalar with no special symmetry except the presence of the additional conserved density field. This could have been blamed for the non-DP behaviour but for the examples of Manna model, CTTP etc. which show DP behaviour even in presence of a conserved field. In this work we show that when density conservation is violated, by allowing deposition and evaporation of particles, the system shows an APT at a finite deposition rate . The resulting critical behaviour becomes DP, confirming that the conservation of density was indeed responsible for the non-DP behaviour in RASEP.
The density is non-analytic at the critical point and we find that also undergoes a transition at with critical exponents identical (within error limits) to those of DP.
The original transition in conserved RASEP was observed by tuning density. In the non-conserved version, the activity also show a transition w.r.t. at with exponents much different from DP. We argue that they are in fact scaled by a factor
The one dimensional CLG, which is the symmetric version of a special case of RASEP, also flows to DP when density conservation is broken. In a recent work, Fiore et. al. [20] have claimed that a modified CLG, which includes next nearest neighbour interaction and simultaneous jump of two consecutive particles in opposite direction but does not violate particle conservation, shows non-trivial critical behaviour. It still remains to see whether it is possible to modify the dynamics of RASEP in a different way, keeping density conservation, to obtain the DP critical behaviour.
References
- [1] M. Henkel, H. Hinrichsen, and S. Lübeck, Non-Equilibrium phase transitions, vol. 1, Springer, Berlin, 2008; H. Hinrichsen, Adv. Phys.49, 815 (2000).
- [2] H. K. Janssen, Z. Phys. B 42, 151 (1981); P. Grassberger, Z. Phys. B 47, 365 (1982).
- [3] J. Marro and R. Dickman, Nonequilibrium Phase transition in lattice models, Cambridge University Press, Cambridge, 1999.
- [4] F. D. A. A. Reis, Braz. J. Phys. 33, 501 (2003).
- [5] P. Grassberger, J. Stat. Phys. 79, 13 (1995).
- [6] M. A. Münoz and R. Pastor-Satorras, Phys. Rev. Lett. 90, 204101 (2003).
- [7] P. K. Mohanty and D. Dhar, Phys. Rev. Lett. 89, 104303 (2002).
- [8] G. Ódor and A. Szolnoki, Phys. Rev. E 53, 2231 (1996).
- [9] K. A. Takeuchi, M. Kuroda, H. Chaté, and M. Sano, Phys. Rev. E 80, 051116 (2009).
- [10] I. Jensen, J. Phys. A 32, 5233 (1999).
- [11] J. W. Essam, J. Phys. A 22, 4927 (1989).
- [12] H. Takayasu and A. Yu. Tretyakov, Phys. Rev. Lett., 68, 3060 (1992); I. Jensen, J. Phys. A 26, 3921 (1993).
- [13] M. J. de Oliveira, Phys. Rev. E 71, 016112 (2005); E. F. da Silva, and M. J. de Oliveira, Jnl. Phys. A : Math. Theor. 41, 385004 (2008).
- [14] U. Basu and P. K. Mohanty, Phys. Rev. E 79, 041143 (2009).
- [15] M. A. Münoz, R. Dickman, A. Vespignani and S. Zapperi, Phys. Rev. E 59, 6175(1999); R. Dickman, M. A. Münoz, A. Vespignani and S. Zaperi, Brazilian Jnl. Phys. 30, 27 (2000).
- [16] M. Rossi, R. Pastor-Satorras, and A. Vespignani, Phys. Rev. Lett.85, 1803 (2000).
- [17] M. Basu, U. Basu, S. Bondyopadhyay, P. K. Mohanty, and H. Hinrichsen, Phys. Rev. Lett. (2012).
- [18] U. Basu, M. Basu, and P. K. Mohanty, submitted to Phys. Rev. E.
- [19] S-G. Lee and S. B. Lee, Phys. Rev. E 77, 021113 (2008).
- [20] C. E. Fiore and M. J. Oliveira, Braz. J. Phys. 36, 218 (2006).