SHARP - I. A high-resolution multi-band view of the infra-red Einstein ring of JVAS B1938+666
Abstract
We present new mass models for the gravitational lens system B1938+666, using multi-wavelength data acquired from Keck adaptive optics (AO) and Hubble Space Telescope (HST) observations. These models are the first results from the Strong-lensing at High Angular Resolution Program (SHARP), a project designed to study known quadruple-image and Einstein ring lenses using high-resolution imaging, in order to probe their mass distributions in unprecedented detail. Here, we specifically highlight differences between AO- and HST-derived lens models, finding that – at least when the lens and source galaxies are both bright and red, and the system has a high degree of circular symmetry – AO-derived models place significantly tighter constraints on model parameters. Using this improved precision, we infer important physical properties about the B1938+666 system, including the mass density slope of the lensing galaxy (), the projected dark matter mass fraction within the Einstein radius (), and the total magnification factor of the source galaxy (). Additionally, we measure an upper-limit constraint on luminous substructure (), based on the non-detection of bright satellite galaxies in all data sets. Finally, we utilize the improved image resolution of the AO data to reveal the presence of faint arcs outside of the primary Einstein ring. The positions and orientations of these arcs raise the intriguing possibility that B1938+666 has a second source galaxy, located at a more distant redshift. However, future work is needed to verify this hypothesis.
keywords:
galaxies: individual (JVAS B1938+666) — gravitational lensing: strong1 Introduction
An understanding of the nature and distribution of matter on small ( 1 Mpc) scales is essential to modern astrophysics. Measuring the shapes of galaxy mass profiles reveals the presence of dark matter (e.g., Rubin, Peterson, & Ford, 1980; van Albada & Sancisi, 1986; de Blok & McGaugh, 1997; Bosma, 1999; Gavazzi et al., 2007; Conroy et al., 2007; Dutton et al., 2011; Ruff et al., 2011; Suyu et al., 2012) and its interactions with baryonic matter (e.g., Blumenthal et al., 1986; Gnedin et al., 2004; Auger et al., 2010; Schulz, Mandelbaum, & Padmanabhan, 2010). Separating total mass into luminous and dark components can constrain cosmological parameters (e.g. the baryon fraction ) and place estimates on the efficiency of star-formation in galaxies (e.g., Fukugita, Hogan, & Peebles, 1998; Heymans et al., 2006; Napolitano, Romanowsky, & Tortora, 2010; Lagattuta et al., 2010). Observing changes in any of these quantities over cosmological time is a key component in studying galaxy evolution (e.g., Mandelbaum et al., 2006; Behroozi, Conroy, & Wechsler, 2010; Lagattuta et al., 2010).
While there are many techniques capable of measuring mass on small scales, gravitational lensing stands out as an especially powerful choice. Unlike other methods, lensing directly measures a total (baryonic + dark matter) mass without requiring this mass to be luminous or in any specific dynamical state. Furthermore, a lensing analysis is not limited to the local Universe, but rather can be applied to systems located over a wide range of cosmological distances. Strong gravitational lensing, in particular, can provide a wealth of information about the nature of galaxies (e.g., Kochanek 2006 and references therein). With typical image separations of 1 arcsec, galaxy-scale strong lenses produce mass estimates close to the centre of galaxies, giving information about both the baryon-dominated luminous core and the inner regions of the dark matter halo. This relatively small angular size (corresponding to physical scales of 5-10 kpc at typical lensing-galaxy redshifts) decreases the probability of foreground interlopers contaminating the line of sight – a problem that can bias mass estimates obtained from group and cluster-scale strong lenses, and can strongly dilute the signal measured from weak lensing – suggesting that the observed lensing signal will be dominated by the mass of the lensing galaxy.
In this paper, we investigate the galaxy-scale gravitational lens B1938+666. First discovered as part of the Jodrell Bank–Very Large Array Astrometric Survey (JVAS; Patnaik et al. 1992; Browne et al. 1998; Wilkinson et al. 1998), initial radio observations of B1938+666 showed a quadruply-imaged background source, configured into a partial Einstein ring, along with a second, doubly-imaged component (Patnaik et al., 1992; King et al., 1997). Follow-up imaging in the near-infrared (NIR) and optical uncovered a bright red object that was thought to be the galaxy lensing the radio emission (Rhoads, Malhotra & Kundic, 1996). This emission was later shown by NIR Hubble Space Telescope (HST) imaging to be composed of the light from both the lensing galaxy and a complete Einstein ring of the background source galaxy (King et al., 1998). Tonry & Kochanek (2000) measured a redshift of 0.881 for the lensing galaxy from optical spectroscopy, while Riechers (2011) determined a redshift of 2.059 for the source from CO observations.
As B1938+666 has an Einstein ring, its lensing mass model can be determined to high precision. Kochanek, Keeton & McLeod (2001) showed that, when compared with two-image quasar or arc lens systems, constraints from an Einstein ring can be used to break degeneracies between the monopole moment of the gravitational potential and higher order terms. Removing these degeneracies allows for a more robust measurement of the slope of the lensing galaxy’s mass profile and, when combined with time delay information, can provide an unambiguous measurement of the Hubble constant (e.g. Suyu et al. 2010). At the same time, with so many constraints placed on the model, Einstein ring lenses are sensitive to perturbations from the smooth gravitational potential of the lens galaxy (Koopmans, 2005; Vegetti & Koopmans, 2009a). Satellite galaxies and dark matter sub-haloes that orbit the main lensing galaxy can give rise to these perturbations, and while these objects are often too faint to be directly observed, gravitational lensing can be used to detect them indirectly through their mass signatures. In this way, careful scrutiny of Einstein ring lenses (or those with extended gravitational arcs) provides one of the best opportunities to reveal the presence of, and constrain the properties of, extragalactic substructure (More et al., 2009; Vegetti, Czoske, & Koopmans, 2010; Vegetti et al., 2010, 2012; Suyu & Halkola, 2010). This would serve as a direct test of the CDM numerical simulations that predict this substructure (e.g., Diemand et al., 2008; Springel et al., 2008), and would thus advance our understanding into the nature of galaxy formation and evolution.
For the reasons described above, we choose to study B1938+666 using high-resolution, NIR adaptive optics (AO) as part of the Strong lensing at High Angular Resolution Program (SHARP). This new project aims to obtain high resolution images of lens systems to study the mass distributions of lensing galaxies between 0.3 1 to an unprecedented detail with state-of-the-art imaging and lens modelling techniques. In this first paper, we focus on a comparison between imaging data taken with space- and ground-based observatories, in particular, we determine the relative benefits for lens modelling. We also present a new smooth mass model for our test system B1938+666 that is used to determine the properties of the lens galaxy and give a robust estimate of the magnification of the NIR component of the background galaxy.
This paper is organized as follows. In Section 2, we describe the wider goals of the SHARP survey since this is the first paper in the series. In Section 3, we briefly describe the new and archival multi-wavelength imaging data for B1938+666, new IR spectroscopy of the lensed source and the techniques used to reduce them. In Section 4, we present the results of lens modelling. We discuss our results in Section 5. Finally, we summarize and conclude in Section 6. Measurements describing the relative fraction of substructure within the B1938+666 lensing galaxy are presented in a companion paper (Vegetti et al., 2012).
Throughout this paper, we assume a cosmological model of km s-1 Mpc-1, , and . All magnitudes presented in this work are AB magnitudes.
2 SHARP Rationale
The image separations seen in galaxy-scale lenses are typically on the order of an arcsecond. Thus, observing these systems with high angular resolution instruments can provide unambiguous estimates of individual image positions and magnitudes, information that is critical when measuring mass distributions with gravitational lensing. Furthermore, any improvements in angular resolution compared to traditional ground-based imaging will provide enhanced detectability of faint objects with small angular extent, and improved sensitivity to small-scale perturbations of the surface brightness of lensed extended emission. At optical and NIR wavelengths, there are currently two techniques for obtaining the necessary data: space-based imaging with HST and ground-based AO imaging. The SHARP survey utilizes both approaches in order to build up a statistically significant sample of lens systems for which deep high-resolution imaging has been obtained.
A particular focus of the SHARP survey is to detect and measure the mass of substructures associated with the lensing galaxies, without regard to whether the substructures are luminous or dark. Numerical simulations of galaxy formation predict a large amount of substructure for a galaxy-mass halo, with a mass fraction of 5–10 per cent of the total halo mass contained in substructures with masses between 4 10 and 4 10 (Diemand et al., 2008; Springel et al., 2008). Furthermore, the simulations converge on a substructure mass function of , where 1.9 0.1 (e.g., Diemand, Kuhlen, & Madau, 2007). Vegetti & Koopmans (2009b) have shown that a Bayesian analysis of a sample of lenses that have been surveyed for substructure down to some mass threshold can provide meaningful constraints on and the slope of the mass function, . Given a sample of 30 lens systems, a mass detection threshold of 3 10 or better, and a reasonable prior on , good constraints on are obtained. Note that even the non-detection of substructure down to the mass limit provides useful information for constraining and , especially as the mass detection limit becomes smaller.
We are therefore pursuing two complementary methods for detecting substructure in lens systems, both of which utilize deep, high-resolution imaging. The first is to detect luminous satellites directly, thus fixing the location of the substructure. The substructure can therefore be included in the mass model of the lens and its mass can be determined (e.g., More et al., 2009). This method is most effective for lens systems with either four lensed images or extended lensed emission. The other approach is to detect substructures through their gravitational effects on extended lensed emission (e.g., Vegetti et al., 2010). Thus, the SHARP sample consists of lens systems with quadruply imaged quasar lenses and lenses with partial or complete Einstein rings. Results on two four-image lenses have been reported by McKean et al. (2007) and Lagattuta, Auger & Fassnacht (2010). Here we report the results for B1938+666, which has an almost complete Einstein ring. A detailed description of the SHARP sample will be presented by Fassnacht et al. (in preparation).
3 Observations and Data Reduction
3.1 Adaptive optics imaging
We observed the B1938+666 system on UT 2010 June 29 and 30 with the NIRC2 camera on the Keck-II telescope, using the Laser Guide Star (LGS) AO system. We used the narrow camera, with a field-of-view of 10 arcsec 10 arcsec, and a pixel scale of 0.01 arcsec. The tip-tilt correction was obtained through simultaneous observation of a magnitude R = 15 star at a distance of 18 arcsec from the lens. We observed the system using both the H and K′ filters. Details of the observations are given in Table 1.
| Date | Telescope | Instrument | Filter | (s) |
|---|---|---|---|---|
| 1997 Aug 13 | HST | NICMOS/NIC1 | F160W | 10800 |
| 1999 Apr 24 | HST | WFPC2 | F555W | 2800 |
| 1999 Apr 24 | HST | WFPC2 | F814W | 3000 |
| 2010 Jun 29 | Keck II | NIRC2 LGSAO | K′ | 14760 |
| 2010 Jun 30 | Keck II | NIRC2 LGSAO | H | 6600 |
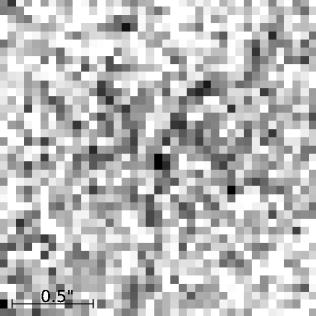
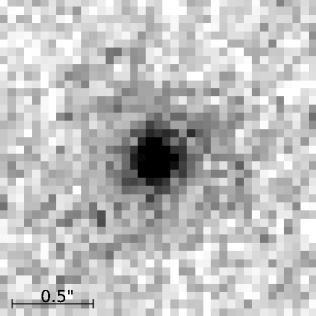
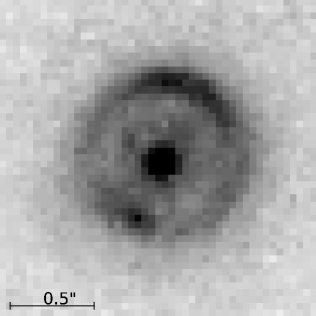
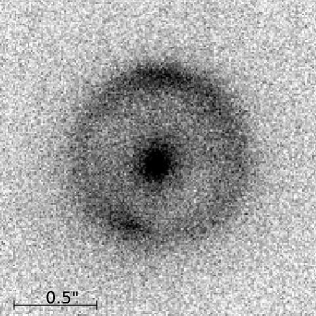
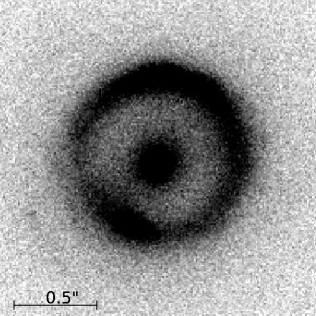
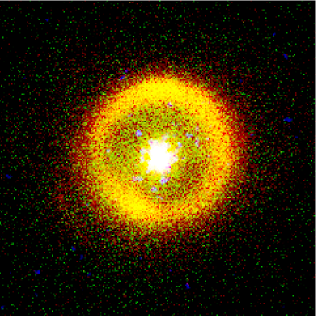
The data were reduced following the method presented in Auger et al. (2011). The final reduced images from the AO observations are shown in the lower row of Fig. 1. The images have three distinct features: a bright, compact lensing galaxy in the centre of the image, a high signal-to-noise ratio (SNR) Einstein ring, and a set of faint arc structures outside of the ring on the east side. Since we did not observe any photometric standards during the data acquisition, we calibrate our photometry by scaling the observed flux to match with previously reported data. The total (lens + ring) H-band flux is matched to the NICMOS data presented by King et al. (1998) (F160W 19.4 0.3), while the K′-band data are matched to the NIRC value reported by Rhoads, Malhotra & Kundic (1996) (K 19.0 0.1).
3.2 Archival Hubble Space Telescope imaging
The B1938+666 system has previously been observed with the HST, at NIR (GO 7255; PI Jackson) and optical (GO 7495; PI Falco) wavelengths. The optical data were obtained as part of the CfA-Arizona Space Telescope Lens Survey (CASTLES) program111http://www.cfa.harvard.edu/castles/. These observations are also summarized in Table 1. The HST data were obtained from the archive and reduced using the routines described in Auger et al. (2009). The final images are presented in the upper row of Fig. 1 and, in the case of the NIR imaging, show the same structure that was observed in the Keck AO data. In the F555W and F814W bands, the Einstein ring was not detected.
3.3 Near infrared spectroscopy
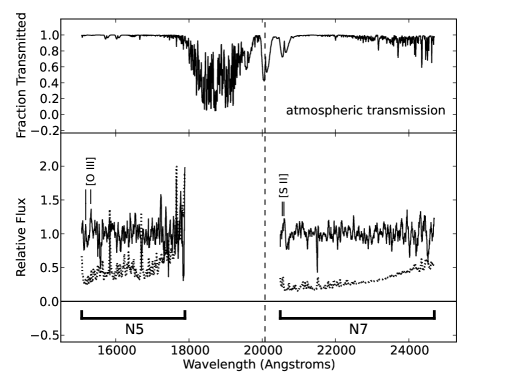
The B1938+666 system was observed with the near-infrared echelle spectrograph (NIRSPEC; McLean et al. 1998) on the Keck-II telescope on the night of UT 2006 August 14. The observing conditions were marginal; scattered clouds throughout the night significantly altered the sky transparency, which led to poor data quality. The spectra were obtained through the NIRSPEC-5 (roughly H-band) and NIRSPEC-7 (roughly K-band) filters. Four exposures were taken in each band, with each exposure consisting of three co-adds of 300 s. Due to the poor observing conditions, only two of the NIRSPEC-5 exposures were usable. All four NIRSPEC-7 exposures were used. The spectra were reduced with a Python-based pipeline, which consists of steps to subtract the sky emission, reject cosmic rays, rectify the two-dimensional spectra, wavelength calibrate, and extract the object spectra. The final spectra have pixel scales and spectral resolutions of 3.56 Å pix-1 and 1600 in NIRSPEC-5 and 4.08 Å pix-1 and 1400 in NIRSPEC-7.
The source redshift was unknown at the time of the observations, and both the H and H lines fall outside the wavelength range covered by the spectra. However, given the source redshift of 2.059 (Riechers, 2011), the [O iii] 4960, 5007 emission features should fall in the NIRSPEC-5 spectrum and the [S ii] 6716, 6731 features should fall in the NIRSPEC-7 spectrum. The spectra are shown in Fig. 2. They have been normalized and then smoothed by a 9-pixel moving average, with each point being inverse-variance weighted. Even with the smoothing, no clear features are seen in the spectrum. However, the expected locations of the [O iii] and [S ii] emission lines (marked in Fig. 2) do correspond to weak peaks in the spectrum. Thus, although we would not have been able to unambiguously measure the source redshift with the NIRSPEC spectra, we can say that our data are consistent with the redshift measured by Riechers (2011).
4 The lens model
Strong gravitational lenses with extended-source structures are frequently modelled by first determining and subtracting the surface brightness distribution of the foreground galaxy (e.g., Bolton et al., 2006), although in cases where the background object is very bright this can lead to an over-subtraction, where parts of the strongly lensed features are fitted and removed along with the foreground galaxy light (e.g. Auger et al., 2011). At NIR wavelengths, the (lensed) B1938+666 source galaxy is roughly equal in brightness to the foreground (lensing) galaxy, so the system presents a similar modelling challenge. Therefore, we first fit a simply parametrized lens model to the data in order to quantify and remove the foreground galaxy light. We then fit a more detailed lens model to the residual data, in order to precisely infer the properties of the mass distribution.
4.1 Surface brightness modelling
Modelling the surface brightness distribution for this system requires that we also determine an approximate model for the lensing mass distribution, in order to disentangle the foreground lens and background source light. To do this, we take an approach similar to Auger et al. (2011) and employ an elliptical power law mass model (e.g. Barkana, 1998) to describe the mass distribution, while including an external shear contribution. The foreground and background galaxy surface brightness distributions are modelled with (possibly multiple) Sérsic (1963) profiles. The models are fitted to the data using an adaptive simulated annealing scheme, and each potential model includes either a single surface brightness component for both the lens and source galaxies, a single surface brightness component for one galaxy and two components for the other, or two surface brightness components for each galaxy.
The foreground galaxy is well-modelled with a single Sérsic component, while the background source modelling strongly favours two components. Although we find that there is significant covariance between the structural properties (i.e., the Sérsic indices, effective radii, and total magnitudes) of the foreground and background components when fitting to the AO images, the central surface brightness distributions are robustly segregated. For example, the total magnitude of the foreground galaxy can change by 0.5 magnitudes if one or two components are used for the background source, but the flux within the Einstein radius – the radius of the ring produced when a part of the lensed object sits directly behind the lensing galaxy – only varies by about 10 per cent (0.1 magnitudes); the covariance between the total galaxy properties is likely due to inadequate knowledge of the AO PSF. We therefore restrict our discussion of the surface brightness properties to the inferred luminosity within the Einstein radius and the position of the source relative to the lens. The aperture magnitudes within the Einstein radius are 21.0 0.15 and 20.6 0.10 in the H- and K′-bands, respectively. Note that with lensing we measure the total mass properties within the Einstein radius and we are therefore able to draw robust conclusions about the relationship between mass and light in the centre of the lensing galaxy, which we discuss in Section 5.2.
4.2 Mass Modelling
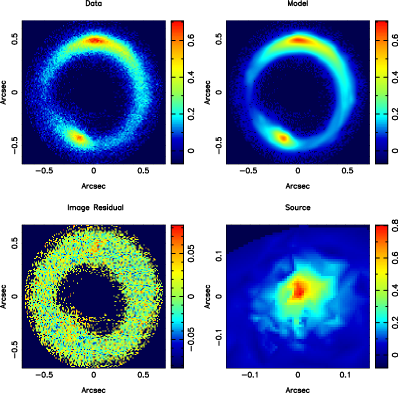
We model the Keck AO H- and K′-band data sets along with the HST NICMOS F160W-band data set using the adaptive and grid-based Bayesian technique of Vegetti & Koopmans (2009a). An extensive description of the modelling procedure in the context of Bayesian evidence optimization is provided there. In short, we model the system by assuming an elliptical power-law mass distribution [] for the lens galaxy, which we use to reconstruct the surface brightness of the source galaxy (after first subtracting off the lens galaxy light profile; see Section 4.1) on a two-dimensional grid. This grid is adaptive in magnification and built by casting pixels from the image plane back to the unlensed source plane. Due to the high resolution of the AO data, we only cast one point out of each six-by-six pixel sub-grid back to the source plane, whereas for the lower resolution HST data, we use a smaller three-by-three pixel sub-grid. Note that the full pixel grid is used when the reconstructed source surface brightness is cast forward to the image plane and the residuals are calculated.
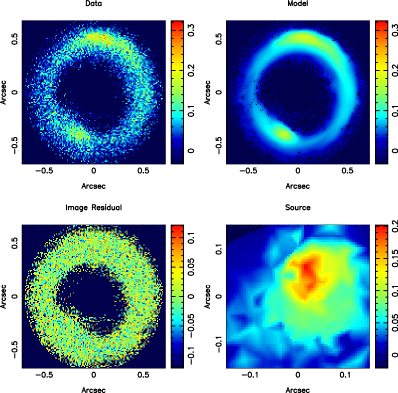
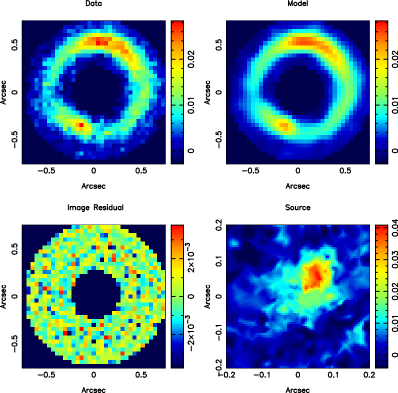
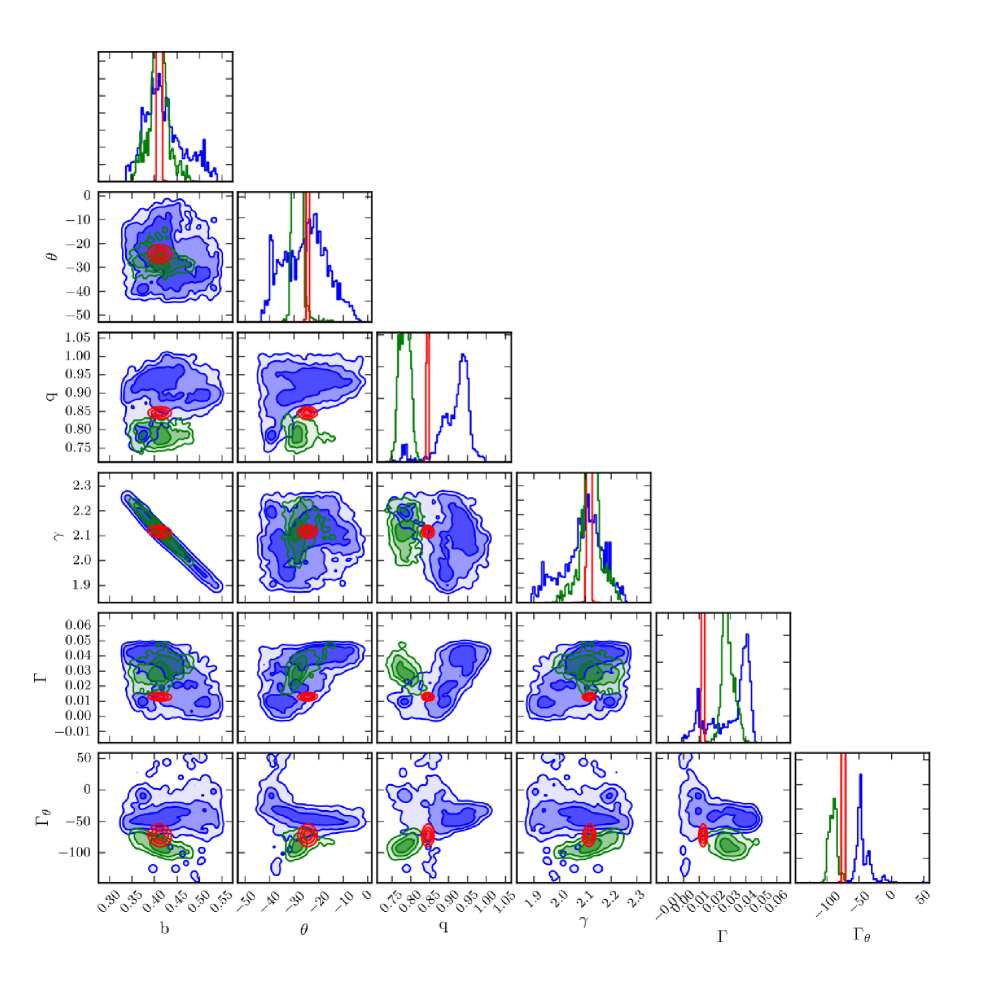
The best lens models (as determined from maximum-likelihood analysis) for the K′-band, H-band, and NICMOS data sets are presented in Figs. 3, 3 and 3, respectively, while the individual parameters of these models are listed in Table 2. In addition to the maximum-likelihood values, we also derive mean values and confidence intervals for each parameter’s marginalized posterior probability distribution function by exploring the Bayesian evidence in the full multidimensional parameter space (see Table 2 for the results). One- and two-dimensional slices of these marginalized posterior probability distributions are shown in Fig. 4. Using Multinest v2.7 (Feroz & Hobson, 2008), we are able to integrate over this posterior probability and obtain the marginalized Bayesian evidence, which is the probability of the data given the model family.
Incorporating a robust PSF model can be challenging for AO data, since the PSF varies rapidly over time. This is a particular concern for the B1938+666 AO data sets as we are unable to observe the lens system and a PSF star simultaneously. Therefore, we carry out the modelling using different PSF stars taken at different times, leading to a different “best” model for each PSF. As the arc is sufficiently extended and the dynamic range is relatively low, we find that the lens modelling of B1938+666 is not significantly affected by the choice of PSF (see Vegetti et al. 2012 for details). However, the Bayesian evidence allows one to choose the best PSF model objectively. For example, the PSF used for the model labelled in Table 2 yields the largest evidence value for the K′-band data.
The best models for each data set are consistent, as can be seen by comparing the maximum-likelihood parameters given in Table 2. Many of the marginalized posterior probability distributions are also in agreement (Fig. 4), though we do note that there are discrepancies in the axis ratios and external shear parameters, especially between the NICMOS and H-band models (see Section 5.1). However, the precision with which the lens parameters can be recovered is significantly higher for the Keck AO data, with the highest precision obtained for the K′-Band. This clearly shows that the higher resolution provided by the AO imaging allows for a more precise lens modelling, when compared to the HST imaging, despite the lower signal-to-noise ratio (SNR).
Finally, it is interesting to note that all of the models using the adaptive and grid-based Bayesian technique lead to a total mass centroid position and flattening that are consistent with those of the parametric mass modelling presented in Section 4.1. Also, all of the models have a total density profile that is very nearly isothermal (i.e., 2) out to the Einstein radius of the system.
| Model | Evidence | ||||||
|---|---|---|---|---|---|---|---|
| 0.452 | 22.4 | 0.853 | 2.05 | 0.014 | 77.1 | ||
| 0.413 | 24.3 | 0.846 | 2.12 | 0.013 | 72.7 | 48806.4 | |
| 0.447 | 22.3 | 0.853 | 2.05 | 0.019 | 78.5 | ||
| 0.410 | 28.5 | 0.786 | 2.12 | 0.029 | 89.1 | 46280.0 | |
| 0.439 | 23.0 | 0.856 | 2.07 | 0.016 | 74.1 | ||
| 0.424 | 25.0 | 0.918 | 2.09 | 0.031 | 42.4 | 7027.16 | |
5 Discussion
We now discuss our results. First, we give a comparison of modelling the gravitational lens system using high angular resolution data from space- and ground-based telescopes. We then discuss the properties of the lensing galaxy and the magnification of the background source that we infer from our model. Finally, we investigate the possibility of there being a second gravitationally lensed source for this system.
5.1 Comparing HST and AO data sets for gravitational lens modelling
The precision and accuracy of mass model constraints from extended sources on strong gravitational lens galaxies is set by three conditions: (i) the number of independent resolution elements across the lensed images (and their multiplicity), (ii) the average SNR of the lensed-image surface brightness distribution and (iii) the level of surface brightness structure in the lensed source. While the first two conditions set the level of information contained in the lensed images and how well, in principle, the mass model of the lens galaxy can be constrained, the third condition determines the level of covariance (i.e., degeneracy) in the mass model, where more structured sources in general lead to a lower level of covariance between model parameters. One of the goals of this paper has been to illustrate points (i) and (ii) by comparing the results of high SNR HST F160W-band data with both lower resolution and pixel-sampling, and lower SNR Keck AO imaging data with higher resolution and sampling. We implicitly assume that the intrinsic source structure in the F160W-, H-, and K′-bands is very much correlated.
Despite the fact that the results of the modelling of the three very different data sets are promisingly similar and the errors are small, we do note that there are differences. In particular, there are discrepancies between the axis ratio and position angle (PA) of the lens mass distribution, and the external shear strength and PA (see Fig. 4). Some tension between these quantities can be expected, as they are strongly covariant (i.e., the external shear mimics the flattening of the lens potential/mass-distribution) and lack of information combined with errors on the data can lead to biases in the maximum-likelihood solutions and the posterior probability distributions of individual parameters. This is especially true for B1938+666, where a nearly circular mass distribution and largely featureless Einstein ring conspire to add uncertainty to the lens model. Specifically, the circularly symmetric mass distribution (coupled with nearly coaxial foreground and background galaxies) makes it difficult to constrain the lensing galaxy’s mass slope – increasing the covariances between other parameters – while the smooth light distribution lacks the contrast needed to differentiate between small-scale variations on the model. Thus, even moderate variations in parameter space can leave the lensed light distribution relatively unchanged, allowing significantly different models to fit the data equally well.
Looking at the marginalized probability distributions in Fig. 4 it is obvious that there is a strong covariance between the lens strength () and mass slope (), especially in the H-band and NICMOS models. This is why model discrepancies are the strongest between these data sets. However, we note that these degeneracies, and the parameter uncertainties in general, are much smaller from the higher-resolution (but lower SNR) Keck AO data. This implies that at least for some systems, ground-based AO data can “out-perform” space-based data in precision – and most likely also in accuracy – due to the better sampled lens image structure. Of course, this does not suggest that higher SNR data is unnecessary: of the two AO-based models, the K′-band data (with its relatively higher SNR) provides much tighter constraints on individual parameters than the H-band model, and indeed, even breaks the mass-slope degeneracy found in the H-band and NICMOS models. Rather, the comparison simply shows that, between SNR and image resolution, resolution seems to dominate any limitations on model precision.
One has to be careful, though, when attempting to generalize this conclusion to other lens systems, because the result depends critically on the complex interplay between SNR, spatial resolution, and source structure. It could very well be that lens systems with highly-structured sources (e.g., space-based B- or U-band data, where star formation could be strong and the sources could be more structured) could out-perform the higher resolution K′-band AO data. This interplay is currently under study. In cases where there is similar data, and a bright star is available, however, our results show that ground-based AO data can perform significantly better than their space-based HST data sets in constraining lens models. As we show in the companion paper, the higher resolution provided by AO imaging was also very powerful in the discovery of a low-mass substructure in this lens system (Vegetti et al., 2012).
5.2 The foreground lensing galaxy
The B1938+666 lensing galaxy is clearly seen in the optical and NIR data sets (Fig. 1), and its surface brightness distribution is well-modelled by a single elliptical Sérsic profile (see Section 4.1). Excluding the HST V-band photometry, we find the galaxy to have IH and HK′ colours of 1.9 and 0.4 magnitudes, respectively, after Galactic reddening corrections. We model these colours with the Bruzual & Charlot (2003) stellar population code and, assuming a Solar metallicity and no dust, find consistency with an old ( 4 Gyr) stellar population. The foreground galaxy’s isophotal regularity, colours, and absorption line spectrum measured by Tonry & Kochanek (2000) suggest that the lens has an early-type morphology; this is consistent with the previous analysis of King et al. (1998) based only on the NICMOS F160W-band imaging.
We use the Bruzual & Charlot (2003) 4 Gyr stellar population model to compute the V-band absolute magnitude and to estimate the stellar mass within the Einstein radius. The luminosity is found to be 3 10 and the stellar template has a V-band stellar mass-to-light ratio of 1.54, implying a stellar mass within the Einstein radius of 4.7 10 if a Chabrier initial mass function (IMF) is assumed. We can compare this to the total mass within the Einstein radius from lensing, and we find a dark-matter mass fraction of 0.55 within the Einstein radius. If we instead use a Salpeter IMF to describe the stellar population, the stellar mass within the Einstein radius becomes 8.2 10, leading to a dark-matter mass fraction of 0.2.
Ideally, we would like to compute the stellar-to-total mass fraction within an aperture physically associated with the lensing galaxy. Therefore, we use two methods to estimate the effective radius from the more robustly measured lensing data. First, we employ the relationship between the power-law density slope and effective radius found by Auger et al. (2010) and correct for early-type galaxy growth rates (e.g., Newman et al., 2010). There are several significant caveats, including evolution of the power-law slope (e.g., Ruff et al., 2011; Bolton et al., 2012) and large uncertainties on these relationships; nevertheless, we find that the effective radius is consistent with being the same size as the Einstein radius. Motivated by this, we check if the assumption that the effective radius of 0.45 arcsec (i.e., equivalent to the Einstein radius) is consistent with measurements of the fundamental plane. We use the velocity dispersion inferred from the lensing model as a proxy for the stellar velocity dispersion and apply a passive evolution correction to the luminosity as determined by the Bruzual & Charlot (2003) 4 Gyr template. We find that, again correcting for size evolution, our assumption that the effective radius and Einstein radius are co-incident yields consistency with the fundamental plane presented by Auger et al. (2010).
5.3 The magnification of the NIR light from the background galaxy
The gravitational lens models also provide an estimate of the source surface brightness distribution, after correcting for the lensing effect. From the pixelated reconstruction, we find that the source is composed of two components at NIR wavelengths (in agreement with the parametrized source distribution discussed in Section 4.1). One component is a high surface brightness region with a projected size of 0.8 kpc, the second component is more extended, up to 1.6 kpc in projected size, and has a lower surface brightness. We defer any detailed discussion about the nature of the NIR source reconstruction – especially with respect to the AGN and molecular gas components traced by the emission at radio wavelengths – to a follow-up paper.
To estimate the total magnification of the NIR source from the gravitational lens models, we compare the model emission found in the lensing plane to that found in the source plane. We use the HST NICMOS data set for this calculation because these data have the most robust measurement of the extended light distribution of the source galaxy; the AO data sets will have some light artificially pushed into an extended envelope (thus leading to a greater chance of confusion between source and lens galaxy light) due to the fact that AO Strehl ratios are less than unity. Additionally, the brightness of the sky background at NIR wavelengths can hide faint, extended emission at the outer edge of the source galaxy, leading to a biased magnification estimate.
Overall, we find that the total magnification factor of the NIR emission is 13. We note that a magnification of 176 has been previously reported for B1938+666 from a simple point-source model (see Barvainis & Ivison 2002 for some details). This larger magnification was used by Riechers (2011) for their analysis of the molecular gas properties of B1938+666, and they found that the CO (3–2) line intensity for B1938+666, and hence the molecular gas mass, was about an order of magnitude lower than for other quasars at a similar epoch. This large discrepancy is almost certainly due to the magnification of the gas emission being over-estimated. However, although we find a smaller magnification for the NIR emission region for this source, some caution should be taken when applying this value to other wavebands, particularly if the emission has a different size, or position with respect to the lensing caustics produced by the lens; only spatially resolved imaging and a good lens model can give a robust estimate of the magnification for any particular emission region of a gravitationally lensed source.
5.4 Luminous Substructure
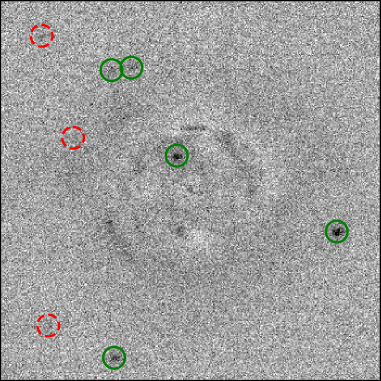
In Vegetti et al. (2012) we presented the detection of a low-mass substructure in the B1938+666 system from the distorting effect the substructure has on the lensed arc. We do not find any evidence of luminous, and probably more massive, substructure in the residual images for the system, which is consistent with the Vegetti et al. (2012) analysis. To determine an upper limit on the brightness of any luminous substructure, we add a series of simulated point sources between 24.5 28 to an image of the lens system from which both the lens galaxy and the Einstein ring emission have been subtracted. For our point source model, we choose the empirical PSF star used in the lens modelling, as this would accurately represent how a point source object would appear in the image. One example simulation is presented in Fig. 5. We choose a point source model over other models – such as Gaussian or Sérsic profiles – because we have no inherent knowledge about the morphologies of these objects, and because the typical small size of satellites relative to a parent galaxy, coupled with the high redshift of the B1938+666 lensing galaxy, suggests that these objects would be likely unresolved in our data. Additionally, since a point source object has a higher surface brightness than an extended object of the same magnitude, a point-source limiting magnitude represents a robust limit to the lowest luminosity that can possibly be observed, placing a hard limit on the luminous properties of any substructure that is independent of morphology.
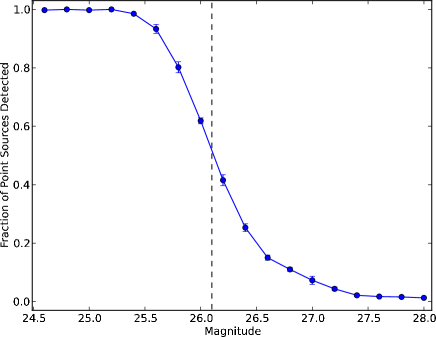
We generate a total of 1000 simulated images, randomizing both the magnitudes and positions of the point sources, and then use SExtractor (Bertin & Arnouts, 1996) to detect the added satellites. We consider a point source to be detected if SExtractor locates an object within 5 pixels and 1.5 magnitudes of the actual position and magnitude of the simulated object. Compiling the results into magnitude bins, we find that we are able to recover the majority (i.e. 50 per cent) of the simulated objects down to an apparent magnitude of K 26.1, which we take to be our detection limit (see Fig. 6). Converting this value to the rest-frame V-band corresponds to an object that has an absolute magnitude of 16.2, which is fainter than the Magellanic clouds (18.5, 17.1), but approximately three times brighter than the Sagittarius dwarf satellite (15; Tollerud et al. 2008).
5.5 A second lensed source?
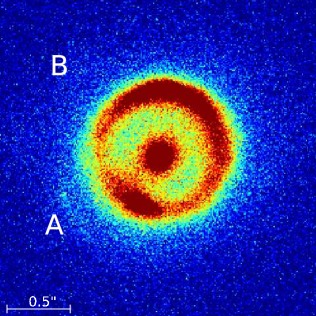
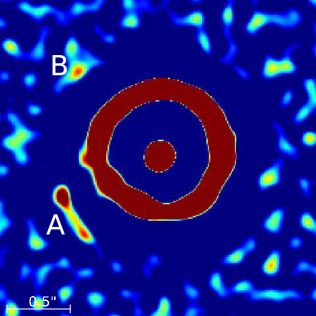
There are two faint arclet structures that can be seen just outside the Einstein ring on the eastern side of the K′ image (Fig. 1; bottom middle panel). To enhance the signal of these arclets, we apply a Gaussian filter ( 6.5 pixels) to smooth the data, followed by a Laplacian filter to increase the contrast around bright flux peaks. Fig. 7 shows a high-contrast image of the original data and an image showing the results of applying Gaussian and Laplacian filters. While the two arcs are barely detectable above the noise in the unprocessed data, the arcs are clearly visible in the filtered image. As the arclets are so faint in the original K′-band data, we do not formally consider them in our lens model. However, taking into account the enhanced image, it is possible – given their positions and orientations relative to the lensing galaxy – that these arclets are actually multiple images of a second background source.
There are three possible scenarios: the arclets are not being lensed; the arclets are images of a strongly-lensed source that is associated with the primary ring (e.g., an additional component of the galaxy being lensed into the ring, a nearby galaxy, or more images of the ring – although this would lead to an extremely peculiar image configuration that we do not expect to arise from well-behaved lensing mass distributions); or the arclets are images of a second source being strongly lensed but at a completely different redshift than the Einstein ring galaxy. We can investigate these scenarios by using the lens models that have been fitted to the Einstein ring. We first use our best lens model to cast the emission from the Einstein ring and the two arclets back to the source plane. As expected, the arclets do not fall on the Einstein ring source. However, the two arclets also are not mapped to a coincident location on the source plane, indicating that if they are at the same redshift as the Einstein ring galaxy they are not multiple images of the same source.
The possibility that the arclets correspond to images of a strongly-lensed source at a different redshift is intriguing; such double-plane lens systems provide very tight constraints to the mass-density slope of the lens and can give useful constraints on cosmological parameters (see Gavazzi et al. 2008 for details). To investigate this possibility we must rescale the lens strength of our mass model, where the scaling is directly proportional to the ratio of angular diameter distances between the lens and the two sources. We find that the two arclets can be mapped to approximately the same location in the source plane if the lens strength is increased by a factor of 1.85. Such a large scaling factor requires an unrealistically high redshift for the source, although two caveats exist that could mitigate this concern: the galaxy being lensed into the Einstein ring can contribute to the lensing, and the mass profile could deviate from the central power law that was found from the Einstein ring fit.
In any case, some estimate of the redshifts of the two potential gravitational arcs will need to be obtained to determine their nature. This will likely require extensive followup with deep, high-resolution spectroscopy. While this is difficult with current telescopes (especially because arclet B is so faint), future instruments such as the James Webb Space Telescope (JWST), the Thirty Meter Telescope (TMT), or the European-Extremely Large Telescope (E-ELT) should provide the resolution and light-gathering power necessary to achieve this goal.
6 Conclusions
We have presented a new mass model for the gravitational lens system B1938+666, using a grid-based Bayesian reconstruction technique on high resolution ground-based AO and space-based HST data, as part of the Strong-lensing at High Angular Resolution Program (SHARP). We find that the smooth component of the lensing galaxy’s mass profile is well-fitted by a (nearly isothermal) power-law distribution, while its light profile (and that of the source galaxy) can be described by Sérsic components. A more in-depth analysis of the mass model, characterizing the amount of substructure present in the system, is presented in a companion paper to this work (Vegetti et al., 2012). The model is consistent over three independent NIR data sets – due largely to the constraints provided by a bright Einstein ring – and agrees well with previously reported results. When compared to models derived from traditional ground-based imaging, though, the high-resolution models are significantly more precise.
The relative improvement in precision varies from data set to data set. Thus, by generating both AO- and HST-based models, we have provided a quantitative comparison between instruments. Overall, we find that the uncertainties on the model parameters derived from the AO data sets are smaller than those measured from the HST, by as much as an order of magnitude. This suggests that AO data are better at constraining lens models than equivalent HST data (at least in cases where the lens and source galaxies are red and have reasonably smooth light profiles), and therefore, that AO observations of lens systems can lead to a better description of those systems’ mass distributions. However, confirmation of this result will require a much larger data set and will be explored in a future paper (SHARP II; Fassnacht et al., in prep).
ACKNOWLEDGMENTS
DJL and CDF acknowledge support from NSF-AST-0909119. The Centre for All-sky Astrophysics is an Australian Research Council Centre of Excellence, funded by grant CE110001020. SV is supported by a Pappalardo Fellowship at the Massachusetts Institute of Technology and is grateful to the Helena Klyuver female visitor program for funding her stay at ASTRON, during which part of this work was carried out. LVEK is supported (in part) through an NWO-VIDI program subsidy (project number 639.042.505). All of the authors would like to extend thanks to ASTRON for the warm hospitality (and financial support) during the SHARP workshop, held in Dwingeloo, the Netherlands. This research was supported in part by the National Science Foundation under Grant No. NSF-PHY11-25915. The data presented herein were obtained at the W. M. Keck Observatory, which is operated as a scientific partnership among the California Institute of Technology, the University of California and the National Aeronautics and Space Administration. The Observatory was made possible by the generous financial support of the W. M. Keck Foundation. The authors wish to recognize and acknowledge the very significant cultural role and reverence that the summit of Mauna Kea has always had within the indigenous Hawaiian community. We are most fortunate to have the opportunity to conduct observations from this mountain. The results present herein were also based on observations collected with the NASA/ESA HST, obtained at STScI, which is operated by AURA, under NASA contract NAS5-26555.
References
- Auger et al. (2009) Auger M. W., Treu T., Bolton A. S., Gavazzi R., Koopmans L. V. E., Marshall P. J., Bundy K., Moustakas L. A., 2009, ApJ, 705, 1099
- Auger et al. (2010) Auger M. W., Treu T., Gavazzi R., Bolton A. S., Koopmans L. V. E., Marshall P. J., 2010, ApJ, 721, L163
- Auger et al. (2011) Auger M. W., Treu T., Brewer B. J., Marshall P. J., 2011, MNRAS, 411, L6
- Barkana (1998) Barkana R., 1998, ApJ, 502, 531
- Barvainis & Ivison (2002) Barvainis R., Ivison R., 2002, ApJ, 571, 712
- Behroozi, Conroy, & Wechsler (2010) Behroozi P. S., Conroy C., Wechsler R. H., 2010, ApJ, 717, 379
- Bertin & Arnouts (1996) Bertin E., Arnouts S., 1996, A&AS, 117, 393
- Blumenthal et al. (1986) Blumenthal G. R., Faber S. M., Flores R., Primack J. R., 1986, ApJ, 301, 27
- Bolton et al. (2006) Bolton A. S., Burles S., Koopmans L. V. E., Treu T., Moustakas L. A., 2006, ApJ, 638, 703
- Bolton et al. (2012) Bolton A. S. et al., 2012, ApJL, submitted (arXiv:1201.2988)
- Bosma (1999) Bosma A., 1999, ASPC, 182, 339
- Browne et al. (1998) Browne I. W. A., Wilkinson P. N., Patnaik A. R., Wrobel J. M., 1998, MNRAS, 293, 257
- Bruzual & Charlot (2003) Bruzual G., Charlot S., 2003, MNRAS, 344, 1000
- Conroy et al. (2007) Conroy C. et al., 2007, ApJ, 654, 153
- de Blok & McGaugh (1997) de Blok W. J. G., McGaugh S. S., 1997, MNRAS, 290, 533
- Diemand, Kuhlen, & Madau (2007) Diemand J., Kuhlen M., Madau P., 2007, ApJ, 667, 859
- Diemand et al. (2008) Diemand J., Kuhlen M., Madau P., Zemp M., Moore B., Potter D., Stadel J., 2008, Nat, 454, 735
- Dutton et al. (2011) Dutton A. A., et al., 2011, MNRAS, 417, 1621
- Feroz & Hobson (2008) Feroz F., Hobson M. P., 2008, MNRAS, 384, 449
- Fukugita, Hogan, & Peebles (1998) Fukugita M., Hogan C. J., Peebles P. J. E., 1998, ApJ, 503, 518
- Gavazzi et al. (2007) Gavazzi R., Treu T., Rhodes J. D., Koopmans L. V. E., Bolton A. S., Burles S., Massey R. J., Moustakas L. A., 2007, ApJ, 667, 176
- Gavazzi et al. (2008) Gavazzi R., Treu T., Koopmans L. V. E., Bolton A. S., Moustakas L. A., Burles S., Marshall P. J., 2008, ApJ, 677, 1046
- Gnedin et al. (2004) Gnedin O. Y., Kravtsov A. V., Klypin A. A., Nagai D., 2004, ApJ, 616, 16
- Heymans et al. (2006) Heymans C. et al., 2006, MNRAS, 371, L60
- Hoekstra, Yee, & Gladders (2004) Hoekstra H., Yee H. K. C., Gladders M. D., 2004, ApJ, 606, 67
- King et al. (1997) King L. J., Browne I. W. A., Muxlow T. W. B., Narasimha D., Patnaik A. R., Porcas R. W., Wilkinson P. N., 1997, MNRAS, 289, 450
- King et al. (1998) King L. J. et al., 1998, MNRAS, 295, L41
- Kochanek (2006) Kochanek C. S., 2006, glsw.conf, 91
- Kochanek, Keeton & McLeod (2001) Kochanek C. S., Keeton C. R., McLeod B. A., 2001, ApJ, 547, 50
- Koopmans (2005) Koopmans L. V. E., 2005, MNRAS, 363, 1136
- Lagattuta et al. (2010) Lagattuta D. J. et al., 2010, ApJ, 716, 1579
- Lagattuta, Auger & Fassnacht (2010) Lagattuta D. J., Auger M. W., Fassnacht C. D., 2010, ApJ, 716, L185
- Mandelbaum et al. (2006) Mandelbaum R., Seljak U., Kauffmann G., Hirata C. M., Brinkmann J., 2006, MNRAS, 368, 715
- McKean et al. (2007) McKean J. P. et al., 2007, MNRAS, 378, 109
- More et al. (2009) More A., McKean J. P., More S., Porcas R. W., Koopmans L. V. E., Garrett M. A., 2009, MNRAS, 394, 174
- McLean et al. (1998) McLean I. S., et al., 1998, SPIE, 3354, 566
- Napolitano, Romanowsky, & Tortora (2010) Napolitano N. R., Romanowsky A. J., Tortora C., 2010, MNRAS, 405, 2351
- Newman et al. (2010) Newman A. B., Ellis R. S., Treu T., Bundy K., 2010, ApJ, 717, L103
- Patnaik et al. (1992) Patnaik A. R., Browne I. W. A., Wilkinson P. N., Wrobel J. M., 1992, MNRAS, 254, 655
- Riechers (2011) Riechers D. A., 2011, ApJ, 730, 108
- Rhoads, Malhotra & Kundic (1996) Rhoads J. E., Malhotra S., Kundic T., 1996, AJ, 111, 642
- Rubin, Peterson, & Ford (1980) Rubin V. C., Peterson C. J., Ford W. K. Jr., 1980, ApJ, 239, 50
- Ruff et al. (2011) Ruff A. J., Gavazzi R., Marshall P. J., Treu T., Auger M. W., Brault F., 2011, ApJ, 727, 96
- Schulz, Mandelbaum, & Padmanabhan (2010) Schulz A. E., Mandelbaum R., Padmanabhan N., 2010, MNRAS, 408, 1463
- Sérsic (1963) Sérsic J. L., 1963, BAAA, 6, 41
- Springel et al. (2008) Springel V. et al., 2008, MNRAS, 391, 1685
- Suyu & Halkola (2010) Suyu S. H., Halkola A., 2010, A&A, 524, A94
- Suyu et al. (2010) Suyu S. H., Marshall P. J., Auger M. W., Hilbert S., Blandford R. D., Koopmans L. V. E., Fassnacht C. D., Treu T., 2010, MNRAS, 711, 201
- Suyu et al. (2012) Suyu S. H., et al., 2012, ApJ, 750, 10
- Tollerud et al. (2008) Tollerud E. J., Bullock J. S., Strigari L. E., Willman B., 2008, ApJ, 688, 277
- Tonry & Kochanek (2000) Tonry J. L., Kochanek C. S., 2000, AJ, 119, 1078
- van Albada & Sancisi (1986) van Albada T. S., Sancisi R., 1986, RSPTA, 320, 447
- Vegetti & Koopmans (2009a) Vegetti S., Koopmans L. V. E., 2009a, MNRAS, 392, 945
- Vegetti & Koopmans (2009b) Vegetti S., Koopmans L. V. E., 2009b, MNRAS, 400, 1583
- Vegetti, Czoske, & Koopmans (2010) Vegetti S., Czoske O., Koopmans L. V. E., 2010, MNRAS, 407, 225
- Vegetti et al. (2010) Vegetti S., Koopmans L. V. E., Bolton A., Treu T., Gavazzi R., 2010, MNRAS, 408, 1969
- Vegetti et al. (2012) Vegetti S., Lagattuta D. J., McKean J. P., Auger M. W., Fassnacht C. D., Koopmans L. V. E., 2012, Nat, 481, 341
- Wilkinson et al. (1998) Wilkinson P. N., Browne I. W. A., Patnaik A. R., Wrobel J. M., Sorathia B., 1998, MNRAS, 300, 790