A new Method to Constrain Supernova Fractions using X-ray Observations of Clusters of Galaxies
Abstract
Supernova (SN) explosions enrich the intra-cluster medium (ICM) both by creating and dispersing metals. We introduce a method to measure the number of SNe and relative contribution of Type Ia supernovae (SNe Ia) and core-collapse supernovae (SNe cc) by directly fitting X-ray spectral observations. The method has been implemented as an XSPEC model called snapec. snapec utilizes a single temperature thermal plasma code (apec) to model the spectral emission based on metal abundances calculated using the latest SN yields from SN Ia and SN cc explosion models. This approach provides a self-consistent single set of uncertainties on the total number of SN explosions and relative fraction of SN types in the ICM over the cluster lifetime by directly allowing these parameters to be determined by SN yields provided by simulations. We apply our approach to the XMM-Newton European Photon Imaging Camera (EPIC), Reflection Grating Spectrometer ( RGS), and 200 ks simulated Astro-H observations of a cooling flow cluster, A3112. We find that various sets of SN yields present in the literature produce an acceptable fit to the EPIC and RGS spectra of A3112. We infer that 30.3%5.4% to 37.1%7.1% of the total SN explosions are SNe Ia, and the total number of SN explosions required to create the observed metals is in the range of () to (), from snapec fits to RGS spectra. These values may be compared to the enrichment expected based on well-established empirically-measured SN rates per star formed. The proportions of SNe Ia and SNe cc inferred to have enriched the ICM in the inner 52 kpc of A3112 is consistent with these specific rates, if one applies a correction for the metals locked up in stars. At the same time, the inferred level of SN enrichment corresponds to a star-to-gas mass ratio that is several times greater than the 10% estimated globally for clusters in the A3112 mass range.
Subject headings:
galaxies: clusters: intracluster medium, galaxies: individual (A3112) nucleosynthesis, abundances supernovae: general X-rays: galaxies: clusters1. Introduction
The use of Type Ia supernovae (SNe Ia) as standardizable candles in the discovery of dark energy (Riess et al. 1998; Perlmutter et al. 1999) installed the nature of SN Ia progenitors and the physics of the explosion as one of the prime problems in astrophysics. The evolution of the SN Ia rate is one of the promising methods for unveiling SN Ia progenitors (Ruiz-Lapuente & Canal 1998; Yungelson & Livio 2000). Measuring the evolution of the supernova (SN) rate is particularly important at higher redshifts where direct SN rate constraints are limited (Gal-Yam et al. 2002; Barbary et al. 2012).
Galaxy clusters represent the largest scales of organized matter in the universe, making them unique laboratories for chemical enrichment of the universe from all possible sources including SN Ia. The intra-cluster medium (ICM) emits X-rays due to the highly ionized gas which has been heated by infall from the intergalactic medium (Gunn & Gott 1972). The metals produced, during all stages of cluster formation and evolution, by stars and galaxies enter the ICM via SN explosions (De Young 1978) and strong galactic winds (Mathews & Baker 1971). They remain in the ICM due to cluster’s deep potential well. Since X-ray spectroscopy yields accurate measurements of metal abundances in the ICM, the large reservoir of metals in clusters of galaxies provides a unique way to probe SN rates and therefore SN Ia progenitor models on a universal scale.
The launch of ASCA triggered studies of the relative contributions of SNe Ia and core-collapse supernovae (SNe cc) to ICM metal enrichment. These studies used specific elemental abundance ratios (e.g., nickel to iron) measured in clusters to distinguish between SN Ia models (Baumgartner et al. 2005; Dupke & White 2000; Dupke & Arnaud 2001; Mushotzky & Loewenstein 1997). With the launch of observatories with better spectral and spatial resolution, such as XMM-Newton, Chandra, and Suzaku, radial profiles of specific elemental abundances were used to determine the relative contribution of SNe Ia to the enrichment of clusters as a function of position (e.g., Matsushita et al. (2007); Sato et al. (2007); Million et al. (2011)). High-resolution XMM-Newton Reflection Grating Spectrometer ( RGS) measurements of specific elemental abundance ratios within the ICM have also been used to determine the integral yield of all the SN Ia and SN cc explosions and to distinguish between SN models with different levels of pre-enrichment of the progenitors and with different initial-mass functions (IMF) (Werner et al. 2006b; de Plaa et al. 2007; Grange et al. 2011).
In this paper we introduce a new approach to determine the total number of SN explosions, and the relative contributions of different SN types, to the total enrichment of the ICM using high-resolution X-ray observations. The method relies on using the full set of nucleosynthetic yields produced by recent SN models for elements with emission lines in the X-ray bandpass to probe the total number of SN explosions and relative contribution of SNe Ia. We validate this approach using CCD resolution XMM-Newton European Photon Imaging Camera ( EPIC) and high-resolution RGS observations of the cooling flow cluster A3112. A brief summary of the method is given in Section 2. The application of the method to analysis of XMM-Newton RGS, EPIC, and simulated Astro-H Soft X-Ray Spectrometer (SXS) data is outlined in Section 3. We provide our discussions and conclusions in Sections 4 and 5.
2. xspec SuperNova Abundance Model (snapec)
2.1. A Brief Description of snapec
Most of the metals from oxygen through nickel residing in the ICM were synthesized by SN Ia or SN cc explosions. We provide a new XSPEC model called snapec to determine the total number of SN explosions and relative contributions of SN types to the metal content of the ICM using elemental yields provided by SN nucleosynthesis calculations in the literature. The expected elemental yields of SNe type Ia, and SNe cc from massive (1050 M⊙) progenitor stars of various metallicity (0 1 A⊙) have been intensively studied by several authors (Woosley & Weaver 1995; Iwamoto et al. 1999; Nomoto et al. 2006). For instance, SN models predict that SNe Ia produce significant amounts of iron (Fe), nickel (Ni) and silicon (Si) while, for SNe cc, large quantities of oxygen (O), neon (Ne) and magnesium (Mg) are produced but very little Fe and Ni escapes the compact remnant.
snapec calculates the mass of the ith element () in terms of the number of SNe Ia () and SNe cc () explosions that enrich the ICM and the yields per SNe Ia () and SNe cc (),
| (1) | ||||
| (2) |
where R is the ratio of SNe Ia to SNe cc (), and is the total number of SN explosions . The SN yields and are obtained from published SN models and stored in the snapec database in solar units. The database includes yields of thirty elements from SN Ia explosions of slow deflagration (W7, C-DEF), delayed detonation (WDD, CDDT, ODDT) and core degenerate scenarios (CDD) (Tsujimoto et al. 1995; Iwamoto et al. 1999; Maeda et al. 2010) (T95, I99, and M10, hereafter), and from core collapse SNe yields from an extensive range of progenitor masses (1050 ) and metallicities (01 times solar) (Tsujimoto et al. 1995; Iwamoto et al. 1999; Woosley & Weaver 1995; Nomoto et al. 2006) (WW95 and N06, hereafter). snapec adopts solar abundances for metals with atomic number (e.g., helium, lithium, beryllium, boron, carbon, and nitrogen).
The snapec model allows a selection of solar abundance standards the database incorporates the sets of Anders & Grevesse (1989), Lodders (2003), or Asplund et al. (2009). Since the majority of hydrogen and helium in the ICM was produced during the big bang, the standard hot big bang nucleosynthesis (BBN) model predicts the primordial helium abundance by unit mass to be 0.2565 0.0010 (Izotov & Thuan 2010) which corresponds to 8.3% helium atoms in number assuming 0.3 solar abundances for metals (e.g., Markevitch (2007)). The Asplund et al. (2009) solar abundances we use here predict 8.5% of helium which is consistent with BBN predictions.
The SNe cc yields of the ith element, averaged over the IMF(), is
| (3) |
where and are the lower and upper limits for the masses of SN cc progenitors. Here we assume that stars with masses M 10 and M 50 M⊙ do not explode as SNe cc. In this work we use the standard Salpeter IMF slope above 10 M⊙, (Salpeter 1955).
It is straightforward to transform Equation (2) to an expression for the abundance, by number relative to hydrogen, of the ith element. As long as the total mass fraction of metals is small and the He abundance is solar,
| (4) | ||||
| (5) |
is the mass of the ith element for an ICM with solar abundances, i.e.
| (6) |
where is the abundance of the ith element in solar units, is the atomic mass of the ith element, and g/H-atom is the average nucleon mass per hydrogen atom (Asplund et al. 2009).
This XSPEC model, snapec, has five free parameters: gas temperature (), the total number of SN explosions () and the SN ratio (R) that enriches the ICM in the spectral region being analyzed, the cluster’s redshift, and the XSPEC normalization factor identical to those defined for other thermal plasma models (see below). In addition, there are two fixed parameters, numerical indices that specify the SN Ia and SN cc models from which the yields are drawn. The predicted spectrum is constructed using the single temperature thermal model (apec) (Smith et al. 2001) and AtomDB 2.0.1 (A. Foster et al. 2012, in preparation) to determine the continuum and line emission for the metal abundances calculated using Equation (5). This method has the advantage of simultaneously providing a single set of uncertainties on the SN ratio and the total number of SN explosions that enrich the ICM since the formation of the cluster. The results presented in this work are obtained using the Asplund et al. (2009) solar abundances.
snapec redefines the quantities in Equation (5) to express the abundances in terms the total number of SNe per of ICM plasma i.e., rescaled to yield values appropriate for cluster cores. The total number of SNe is derived by multiplying by the ICM mass (in units of ) within the spectral extraction region. This may be estimated from the XSPEC normalization, which is proportional to the emission measure,
| (7) |
where is the electron number density, is the angular diameter distance, and z is the cluster’s redshift.
| Obs Id | R.A. | DEC | Exposure | Clean |
|---|---|---|---|---|
| Time | Time | |||
| (J2000) | (J2000) | (ksec) | (ksec) | |
| 0603050101 | 03 17 57.4 | - 44 14 14.7 | 118.9 | 100.1 |
| 0603050201 | 03 17 57.4 | - 44 14 12.8 | 80.8 | 80.4 |
| SN Ia | SN cc | R | of Source | of Bkgd | |||
|---|---|---|---|---|---|---|---|
| Model | Model | (keV) | () | (%) | Spectra | Spectra | |
| (2608 dof) | (1490 dof) | ||||||
| T95 (W7) | T95 | 3.69 0.23 | 1.06 0.33 | 0.52 0.09 | 34.3 6.4 | 2817.8 | 2026.8 |
| I99 (W7) | I99 | 3.70 0.23 | 1.06 0.34 | 0.52 0.09 | 34.2 6.3 | 2818.7 | 2026.4 |
| I99 (W70) | I99 | 3.74 0.23 | 1.07 0.33 | 0.50 0.09 | 33.5 6.2 | 2822.5 | 2025.5 |
| I99 (WDD1) | I99 | 3.81 0.23 | 1.15 0.35 | 0.57 0.10 | 36.2 6.8 | 2835.8 | 2022.9 |
| I99 (WDD2) | I99 | 3.80 0.22 | 1.09 0.34 | 0.48 0.08 | 32.3 5.9 | 2831.6 | 2023.6 |
| I99 (WDD3) | I99 | 3.80 0.21 | 1.06 0.33 | 0.44 0.08 | 30.3 5.4 | 2829.5 | 2024.1 |
| I99 (CDD1) | I99 | 3.81 0.22 | 1.17 0.35 | 0.59 0.12 | 37.1 7.1 | 2836.6 | 2022.8 |
| I99 (CDD2) | I99 | 3.81 0.22 | 1.08 0.34 | 0.45 0.08 | 31.2 5.7 | 2831.5 | 2023.7 |
| M10 (W7) | I99 | 3.70 0.23 | 1.06 0.33 | 0.51 0.09 | 33.9 6.4 | 2819.2 | 2826.2 |
| M10 (CDEF) | I99 | 3.66 0.30 | 1.28 0.43 | 1.23 0.27 | 56.3 13.7 | 2809.5 | 2026.9 |
| M10 (CDDT) | I99 | 3.33 0.23 | 1.17 0.41 | 1.34 0.29 | 57.2 14.5 | 2806.4 | 2026.8 |
| M10 (ODDT) | I99 | 3.71 0.23 | 1.12 0.34 | 0.61 0.11 | 37.8 7.2 | 2823.6 | 2025.1 |
3. Applications to X-ray Spectra
Accurately determining the elemental abundances is crucial for understanding the relative contributions of different SN types to the metal enrichment of galaxies and intra-cluster gas. Earlier attempts to determine the relative fraction of SNe Ia using XMM-Newton measurements of individual elements such as Si, S, Ar, Ca, Fe, and Ni in the ICM (Werner et al. 2006b; de Plaa et al. 2007) concluded that T95 and I99 SNe models overestimated Ar and Ca abundances, and could not produce acceptable fits to XMM-Newton data. de Plaa et al. (2007) also inferred a number ratio of SNe cc to SNe Ia (using W7 yields) of 3.5, based on XMM-Newton observations of 22 clusters. Grange et al. (2011) studied EPIC and RGS observations of two groups of galaxies, NGC 5044 and NGC 5813 and found that 30%40% of SNe contributing to metal enrichment of the intra-galactic gas were type Ia while the other 60%70% of supernovae then were core collapse. This result was consistent with what was previously found for M87 by Werner et al. (2006a). Simionescu et al. (2009) reported that WDD3 or W7 SN Ia models are needed in order to reproduce the low Si abundance in Hydra A clusters of galaxies. They also noted that abundance patterns in the XMM-Newton observation of all other clusters preferred WDD1 and WDD2 models. However these studies proceeded by first determining the best-fit values and uncertainties on individual elemental abundances, followed separately by fitting abundance ratios to determine the relative fractions of SNe Ia and SNe cc using the T95 and I99 models. By contrast, in this work we apply the yields obtained from SN models to immediately predict the spectrum, skipping the intermediate step required in previous studies. The best-fit and parameters, and parameter confidence levels, are thus directly estimated from X-ray spectra and their statistical uncertainties for a given set of SNe yields, allowing one to use the goodness-of-fit to assess the accuracy of the predictions and compare different yield sets on a well-defined statistical basis.
| SN Ia | SN cc | R | ||||
|---|---|---|---|---|---|---|
| Model | Model | (keV) | () | (%) | (1683 dof) | |
| T95 (W7) | T95 | 3.49 0.02 | 1.06 0.02 | 0.40 0.01 | 28.6 1.0 | 2737.7 |
| I99 (W7) | I99 | 3.50 0.02 | 1.06 0.03 | 0.40 0.01 | 28.6 1.0 | 2737.8 |
| I99 (W70) | I99 | 3.50 0.02 | 1.06 0.02 | 0.39 0.01 | 28.1 1.0 | 2723.9 |
| I99 (WDD1) | I99 | 3.47 0.02 | 0.82 0.02 | 0.76 0.03 | 43.2 2.9 | 2893.6 |
| I99 (WDD2) | I99 | 3.49 0.02 | 0.89 0.02 | 0.51 0.01 | 33.8 1.0 | 2783.9 |
| I99 (WDD3) | I99 | 3.47 0.02 | 0.91 0.11 | 0.42 0.02 | 29.6 1.9 | 2749.8 |
| I99 (CDD1) | I99 | 3.41 0.01 | 0.82 0.11 | 0.81 0.03 | 44.8 2.9 | 2927.6 |
| I99 (CDD2) | I99 | 3.50 0.02 | 0.87 0.11 | 0.49 0.02 | 32.9 1.9 | 2767.1 |
| M10 (W7) | I99 | 3.51 0.02 | 1.06 0.01 | 0.40 0.01 | 28.6 1.0 | 2744.1 |
| M10 (CDEF) | I99 | 3.54 0.02 | 1.36 0.11 | 0.77 0.03 | 43.5 2.9 | 2775.8 |
| M10 (CDDT) | I99 | 3.39 0.02 | 1.11 0.10 | 1.28 0.07 | 56.1 6.5 | 3627.5 |
| M10 (ODDT) | I99 | 3.49 0.02 | 0.83 0.13 | 0.82 0.04 | 45.1 3.8 | 2842.3 |
3.1. XMM-Newton RGS Observations of A3112
XMM-Newton’s high-spectral resolution RGS instrument (wavelength bandpass ranging from 5 to 38 Å) can resolve strong X-ray lines and measure elemental abundances accurately in the compact central regions of nearby bright clusters of galaxies. We examined the RGS observations of the cool core cluster A3112 (see Table LABEL:table:previousObs) using version 11.0 of the Science Analysis Subsystem (SAS) software. For details about RGS data reduction and analysis see Bulbul et al. (2012, hereafter, Paper I) . We fit the combined RGS firstorder and secondorder spectra using an absorbed snapec model in the 7 22Å and 7 16Å wavelength range, respectively. The absorption column density was fixed to the Leiden/Argentine/Bonn Galactic value (Kalberla et al. 2005). The , R, redshift, , and normalization parameters were allowed to freely vary. The best-fit model parameters obtained from the snapec fits to RGS spectra for various SN models are shown in Table LABEL:table:RGSbestFit. Since, as in Paper I, fitting is conducted using the C-statistic and the C-statistic does not provide a direct estimate of the goodness-of-fit, we asses the goodness-of-the fit using the corresponding value. These final values, obtained from the best fit determined by C-statistics, are reported in Table LABEL:table:RGSbestFit.
We calculated the projected gas mass of A3112 confined in the central region corresponding to the effective RGS aperture (Paper I) based on the best-fit normalization parameter in the singletemperature thermal model (apec) fit to the RGS spectra using Equation (7). The apec normalization of gives a projected gas mass of (4.80 0.70) within the 38′′ ( 52 kpc) region. We also calculated a spherical gas mass of ( within the 38′′ ( 52 kpc) which is consistent with the projected mass obtained from the apec normalization. This spherical gas mass was calculated using the deprojection analysis and modeling of the XMM-Newton EPIC observations of A3112 (see Bulbul et al. (2010, 2012)). Thus, a conversion factor 0.41 is applied to the SNe per derived from spectral fits to obtain the total number of SNe, parameters, which are also reported in Table LABEL:table:RGSbestFit.
We also convert the R parameter obtained from snapec fits into the fractional contribution of SNe Ia to the total number of SN explosions as follows:
| (8) | ||||
| (9) |
We find that 30.3%5.4% 37.1%7. % of the total SN explosions are SNe Ia for models that use W7, CDD, and WDD yields. Application of M10 CDDT and CDEF SN Ia models implies a significantly higher fraction of SN Ia explosions ( 57%14.5%). The reason for this difference is that M10 CDDT, CDEF SN Ia models have lower Fe abundance compared to the W7, W70, CDD, WDD, and ODDT models. Since Fe is mainly produced by SN Ia explosions, a lower abundance of Fe in SN Ia models in M10 CDDT, CDEF yields results in a higher number of SN Ia explosions and thus higher SN Ia fraction. The fraction of SN Ia explosions inferred using the I99 CDD and WDD models reported in Table LABEL:table:RGSbestFit are consistent with those in de Plaa et al. (2007) based on elements accessible to the EPIC detectors: Si, S, Ar, Ca, Fe, and Ni. However de Plaa et al. (2007) find a lower SNe Ia fraction for W7 SN Ia models.
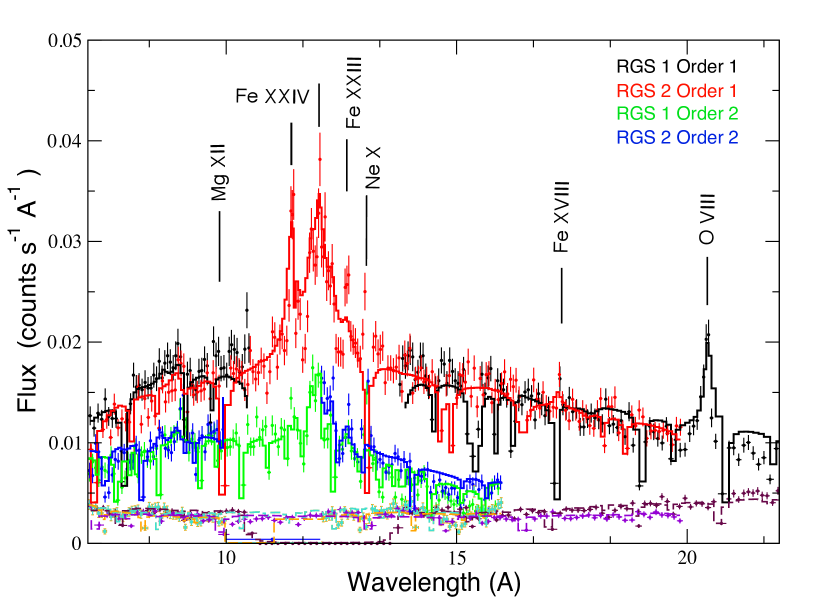
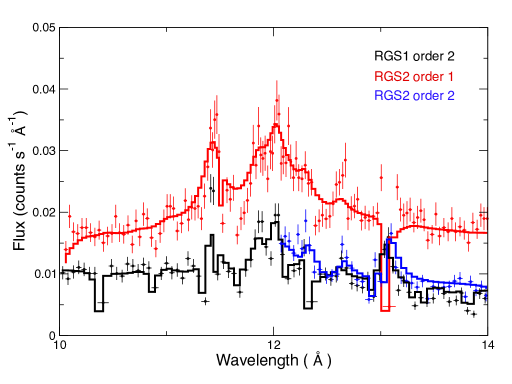
The SN models we use in this work produce equally good fits to RGS data (see Table LABEL:table:RGSbestFit). Therefore, global fits to the currently available highresolution X-ray observations of clusters of galaxies do not allow one to distinguish between different types of SN models in an individual cluster. The RGS firstand secondorder spectral fits obtained using the I99 SN Ia (W7) yields and Salpeter-IMF-averaged I99 SN cc yields are shown in Figure 1. We also show a close-up view of the fit in the RGS Fe-L bandpass obtained using the T95 SNe Ia (W7) and Salpeter-IMF-averaged T95 SN cc yields in Figure 2. Figure 2 shows that the T95 SN yields accurately reproduce the RGS spectrum in the Fe-L bandpass.
3.2. XMM-Newton EPIC Observations of A3112
We examined the EPIC observations of the cool core cluster A3112 (see Table 1) using version 11.0 of the SAS software. The EPIC data processing and background modeling were carried out with the XMM-Newton Extended Source Analysis Software (XMM-ESAS) and methods (Kuntz & Snowden 2008; Snowden et al. 2008) described in Paper I. Since the EPIC spectra can constrain Si, S, Fe and O abundances only in the innermost 30′′ region (see Paper I), we examined only the central 30′′ spectra in this work. We fit the cluster emission using the absorbed snapec model allowing the absorption column density, , R, redshift, , and normalization parameters freely vary. The best fit parameters of the instrumental and cosmic X-ray background model components were fixed to the best-fit values obtained from the overall fits and reported in Paper I. A conversion factor 0.41 was again applied to the SNe per derived from EPIC spectral fits to obtain the parameter. The best-fit model parameters obtained from the snapec fits to EPIC spectra for various SN nucleosynthesis models are shown in Table LABEL:table:epicBestFit. These final values, reported in Table LABEL:table:epicBestFit, were obtained from the best fit determined by C-statistics.
The temperature, SN ratio (), and the total number of SN measurements obtained from EPIC spectra are consistent with RGS results (Table LABEL:table:RGSbestFit) at the 1 level. The 1 difference is due to different temperature measurements reported by EPIC and RGS observations. Most of the SN nucleosynthesis models we use in this work produce equally good fits to EPIC data as in the case of RGS analysis. High signal-to-noise CCD resolution EPIC spectra yield stringent constraints on the model parameters (e.g. SN ratio () and the total number of SNe) but cannot distinguish between different types of SN nucleosynthesis models. Maeda et al. (2010) CDDT SN Ia models yield a worse fit to the EPIC spectra compared to Iwamoto et al. (1999); Tsujimoto et al. (1995) or Maeda et al. (2010) W7, CDEF, ODDT SN Ia models.
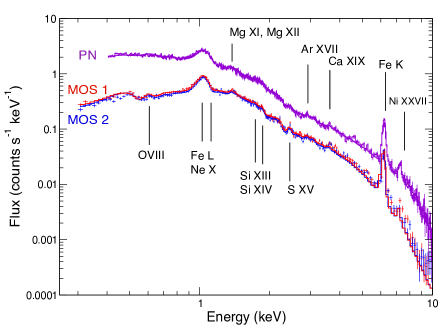
We find that fits to the EPIC spectra find a slightly wider range of SN Ia fraction, so that 28.1%1.0% 44.8%2.9% of the total SN explosions are SNe Ia for models that use W7, CDD, and WDD nucleosynthesis yields. As in the case of the RGS analysis, the M10 CDEF, CDDT SNe Ia models imply a significantly higher fraction of SN Ia explosions (43.512.9%56.16.5%) as a result of lower Fe abundance compared to the W7, W70, CDD, WDD models. We also found that all W7 models from several simulations (e.g. T95, I99 and M10) produce similar goodness-of-the-fit, the total number of SNe, and SN Ia fraction. The snapec fits to EPIC MOS1, MOS2, and PN spectra performed using the Iwamoto et al. (1999) W70 SN Ia and SalpeterIMFweighted Iwamoto et al. (1999) SN cc metal yields are shown in Figure 3.
3.3. Astro-H Simulations of A3112
The Japan/U.S. Astro-H Observatory is scheduled to launch in 2014 and will carry an X-ray calorimeter, the SXS, with a high energy resolution of 4.5 eV (Takahashi et al. 2010). The detector will be able to determine line widths and metal abundances with high precision, revolutionizing our understanding of physical processes (e.g. turbulence, the contributions of SN explosions to metal enrichment) in the ICM. We simulated 200 ks SXS observations of A3112 using the X-ray events simulator software (simx 1.2.1), based on the temperature and abundance measurements obtained from the snapec fits convolved with I99 SN Ia (W7) and I99 Salpeter-IMF-weighted SN cc yields. simx uses predefined detector response matrix, effective area, and predicted background for the SXS instrument to produce an event file by convolution with the telescope’s point spread function.111http://hea-www.harvard.edu/simx/index.html The SXS spectrum is extracted using the FTOOL xselect based on the event file produced with the simx software.
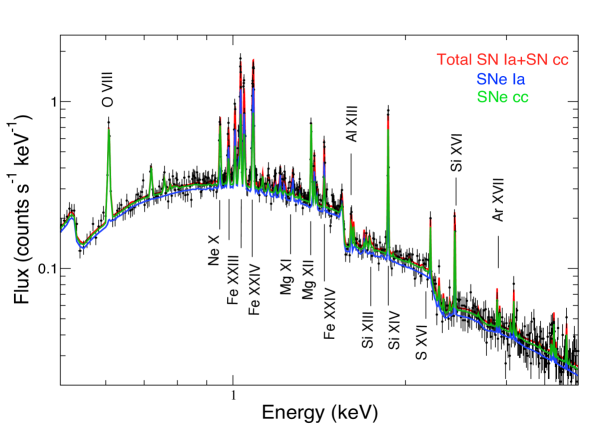
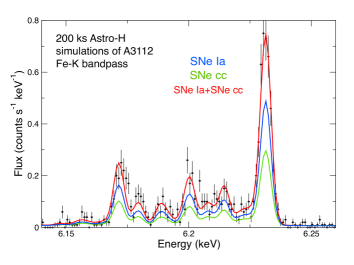
We then fit the simulated SXS spectrum with the snapec model convolved with various SN Ia and SN cc yields for variable temperature, , R, redshift, and normalization. Figures 4 and 5 show the soft X-ray band and a close-up view of the Fe-K bandpass for fits to the simulated SXS spectrum of A3112 obtained assuming the same SN yields used to create the spectrum. The relative contributions of SN Ia and SN cc products to the spectrum are shown as green and blue lines in Figures 4 and 5, respectively. The figures illustrate how the significant amounts of Fe and Mg produced by SN Ia explosions, and large quantities of O synthesized in SN cc explosions, are manifest in the spectrum. The best-fit parameters and goodness-of-fits obtained using the I99, T95, and M10 SNe yields are shown in Table LABEL:table:bestFitAstroH. The features from metals primarily produced by SNe Ia explosions such as S, Ar, Ca, and Ni that were inaccessible to the EPIC and RGS now become important diagnostics for Astro-H data analysis. As a result of the accurate abundance measurements of these metals, uncertainties in the and R parameters are reduced, and they may be determined more robustly and with higher precision (see Table LABEL:table:bestFitAstroH).
As expected, good fits are found using SN models that have similar elemental yields, e.g. using T95 (W7) or I99 (W70) SN Ia models, to those of the I99 (W7) SN Ia and SN cc yields adopted to produce the simulated Astro-H spectrum (see Table LABEL:table:bestFitAstroH). On the other hand, the significantly higher values obtained from fits with SN models that have markedly different yield patterns, e.g. I99 CDD and I99 WDD models, demonstrates that future Astro-H observations of galaxy clusters will allow one to distinguish between different SN models and provide fundamental constraints on SN nucleosynthesis.
| SN Ia | SN cc | R | |||
|---|---|---|---|---|---|
| Model | Model | (keV) | () | (886 dof) | |
| T95 (W7) | T95 | 3.77 0.03 | 1.10 0.07 | 0.50 0.02 | 1124.5 |
| I99 (W7) | I99 | 3.77 0.03 | 1.09 0.06 | 0.51 0.02 | 1119.9 |
| I99 (W70) | I99 | 3.76 0.03 | 1.08 0.06 | 0.49 0.02 | 1113.8 |
| I99 (WDD1) | I99 | 3.78 0.03 | 1.06 0.06 | 0.60 0.03 | 1319.4 |
| I99 (CDD1) | I99 | 3.69 0.05 | 1.07 0.08 | 0.33 0.02 | 1348.9 |
| M10 (CDEF) | I99 | 3.76 0.03 | 1.46 0.08 | 0.89 0.05 | 1223.9 |
| M10 (CDDT) | I99 | 3.83 0.03 | 1.16 0.05 | 1.54 0.12 | 1795.0 |
| M10 (ODDT) | I99 | 3.84 0.03 | 1.07 0.07 | 0.69 0.03 | 1292.6 |
4. Discussion
By developing and applying a new spectral analysis methodology to RGS spectra, we measure the total number of SNe that have enriched the ICM presently in the inner 52 kpc of A3112 and the relative contributions of SNe Ia and SNe cc. In this section we compare this with the enrichment expected based on the number of SN Ia and SN cc explosions derived from the amount of starlight and well-established empiricallymeasured SN rates per star formed. We also investigate prospective local enrichment sources related to the brightest cluster galaxy (BCG). In this way we can interpret our data analysis in the context of the origin of the gas and its metals.
4.1. Global Cluster Context for the Number of SNe
Within its virial radius, a sufficiently massive cluster is approximately a closed box. For a global efficiency of converting gas to stars , the total mass in stars formed is
| (10) |
where is the total baryon mass. At the present time the total mass in stars, whether contained in individual cluster galaxies (including the BCG) or associated with intra-cluster light (ICL), is
| (11) |
and the mass in gas is
| (12) | ||||
| (13) |
where is the mass return fraction. We can safely neglect the distinction between the mass in gas and the mass in the ICM for a cluster as rich as A3112 where the gas mass in galaxies is relatively small, and henceforth equate with . The star formation efficiency, in terms of the observable ,
| (14) |
The total numbers of SN cc and Type Ia explosions can be expressed as
| (15) |
and
| (16) |
where and are, respectively, the specific numbers of SN cc and SN Ia explosions per star formed. Connecting and to the snapec model parameters defined in §2,
| (17) |
and
| (18) |
where . We note that these refer to all of the SNe while in Section 2, and R parameters refer only to SNe that enrich the ICM.
Adopting a “diet Salpeter” IMF that produces relatively fewer low mass stars (Bell & de Jong 2001), Maoz & Mannucci (2011) estimated to be . Adopting the mass return fraction and specific SNe cc rate for the diet Salpeter IMF: (Fardal et al. 2007; O’Rourke et al. 2011), , and (Maoz & Mannucci 2011; Botticella et al. 2012), one predicts , which corresponds to , and . For clusters in the A3112 mass range (e.g., , Paper I), recent analysis finds, typically, (Balogh et al. 2011; Lin et al. 2012). Therefore, from Equation (18), the estimated total number of SN explosions per of ICM is . Multiplying by the correction factor of 0.41 appropriate to the core of A3112, becomes . Comparing with our results in Table LABEL:table:RGSbestFit, we may conclude that the inner 52 kpc of A3112 has been enriched by more SNe, with a higher percentage of SNe Ia, than is true globally for a typical cluster of its mass.
4.2. SN Metals Locked Up in Stars
The galactic mass in clusters is dominated by early-type galaxies that form their stars quickly. This results in the well-established enhancement in , the abundance ratio of -elements to Fe (expressed as the logarithm with respect to solar) i.e., SNe cc are preferentially locked up in stars. In their investigation of the giant elliptical galaxy NGC 4472, Loewenstein & Davis (2010) found that a ratio of SNe Ia to total SNe of () and a number of supernova per mass in (present-day) stars of , resulted in and (as observed in this particular galaxy, but typical of the class) assuming yields from Kobayashi et al. (2006). This enables us to estimate the lock-up corrections, and , to the total specific numbers of SNe per star formed. This provides, in turn, the corresponding values available to enrich the ICM, and :
| (19) | ||||
| (20) |
| (21) | ||||
| (22) |
| (23) |
and
| (24) |
That is, the metal production from % of SNe cc, and % of SNe Ia, must be locked up in stars to enrich them to solar Fe abundances and . This results in revised predictions of consistent with our RGS results for A3112, but an even lower expected total number of SNe SNe.
4.3. Direct SNe Injection
Sand et al. (2012) recently estimated a specific SN Ia rate in cluster galaxies of SNuM 2221 SNuM = Supernova rate per 100 yr per in stars within ( Mpc) (see also Maoz et al. (2010)) that may be directly injected into the ICM by the kpc stellar population. The implied level of SNIa available for enrichment accumulated over time is
| (25) |
where the stellar mass refers to the kpc region, and should now be interpreted as an average over . We use the Hernquist approximation (Hernquist 1990) to deVaucouleurs profiles for the A3112 BCG and ICL components and estimate within 52 kpc i.e., . A large star-to-gas ratio, and a long timescale yr (with the accompanying increase in ) would be required for this to be a significant source of enrichment.
4.4. The Cluster Enrichment Puzzle as Realized in the Core of A3112
For most of the yield sets we consider, the level of ICM enrichment for the central (4.06 0.70) requires SNe, with SNe Ia accounting for one-third of the total. Although our SN parameters are derived for the inner 52 kpc, the high gas mass and temperature imply that this gas is primarily intra-cluster in origin. If we account for the fraction of SN products locked up in cluster galaxy stars, which is higher for SNe cc based on the measured stellar enhancement, we can explain the proportions of SNe Ia and SNe cc that we infer enriched the ICM. However, the total number of SNe we infer is greater than expected by a factor of for a typical star-to-gas ratio, . These conclusions are altered by direct injection of SN Ia ejecta in the BCG only if accumulated over a large fraction of a Hubble time; and, are exacerbated for the M10 CDEF and CDDT models. Evidently, the stellar population responsible for enriching this material is characterized by enhanced efficiency in producing SNe, and/or the mass in stars responsible for the enrichment, .
Larger estimates of at the A3112 mass range may be found in Gonzalez, Zaritsky, & Zabludoff (2007) (see, also Langana et al. (2011)). Indeed A3112 was investigated by Gonzalez, Zaritsky, & Zabludoff (2007), from which we may derive . The implication is that there is substantial ICL component unaccounted for in other studies (see also Bregman, Anderson, & Dai (2010)) and that the star formation efficiency is very high Equation (14).
Even if of intra-cluster origin, the enrichment of this inner cluster gas is likely to reflect the somewhat special conditions in the cluster core where high initial overdensity may result in enhanced efficiency of galaxy and star formation. Thus, the effective value of may very well be larger than is representative of the ICM as a whole. At the same time, for rich galaxy clusters in general, the global ICM shows enrichment beyond what is expected based on the stars we see in galaxies today (Portinari et al. 2004; Loewenstein 2006; Maoz et al. 2010; Bregman, Anderson, & Dai 2010).
Another possible mechanism contributing to the greater than expected number of SNe found in our fits is strong early enrichment of the lowest-entropy X-ray emitting gas stripped from early galaxies. The heavier metals found in gas stripped at large radii will settle into the cluster core due to the central gravitational potential, while the stars that produced them remain at larger radii. Therefore, a significant fraction of metals residing in the cluster core that we observe today may not have originated from the local stellar population (Million et al. 2011). In this scenario, the apparent total expected number of SNe will be enhanced relative to that inferred from . A more extensive study of a larger sample is needed to fully address this issue.
5. Conclusions
In this work we introduce a new approach to determine the total number of SNe explosions and the relative contribution of SNe Ia to the total enrichment of the ICM using highresolution X-ray observations of clusters of galaxies. The method has been implemented as an XSPEC model called snapec. The method relies upon the apec model for spectral emission, but uses the metal abundances determined from SNe yields from the latest published SN Ia and SN cc explosion models normalized to the solar abundances (e.g., Anders & Grevesse (1989), Lodders (2003), or Asplund et al. (2009)). This model returns the total number of SN explosions and the relative contribution of the SN types in the spectral extraction region that enrich the ICM integrated over the cluster life-time, although it does not explicitly constrain the SN products locked up in stars in member galaxies. Contrary to previous studies in the literature, this method has the ability to use all relevant elements, allowing spectra and SN yields obtained from published models to determine the best fit to their abundances. The main advantage of this approach is that it provides a self-consistent single set of uncertainties on the total number of SN explosions and relative fraction of SN types by directly allowing these parameters to be determined by SN yields provided by simulations. This method provides both rigorous assessments of uncertainty and improved statistical efficiency in estimating the total number of SN explosions and relative SN fractions.
We use XMM-Newton EPIC and RGS observations of A3112 to validate the method and determine the total number of SNe and fraction of SNe Ia using various published SN yields (Tsujimoto et al. 1995; Iwamoto et al. 1999; Maeda et al. 2010). Since the T95, I99, and M10 SN models produce equally good fits to RGS data, current CCD resolution EPIC and highresolution RGS observations of clusters of galaxies do not allow one to distinguish between different SN models. The SN Ia fraction reported by EPIC observations are consistent with RGS measurements at 1 level. We also find that T95, I99, and M10 models produce consistent values of the total number of SNe and SN Ia fractions. 30.3% 5.4% to 37.1% 7.1% of the total SN explosions are SNe Ia and the total number of SN explosions are in the range of () to (). The best-fit SN Ia ratios for WDD and CDD we obtained from RGS spectra are consistent with de Plaa et al. (2007) measurements. However, de Plaa et al. (2007) find a lower SN Ia fraction for W7 SN Ia models.
We also applied this method to simulated Astro-H SXS observations of A3112. Astro-H simulations were performed using I99 W7 SN Ia and I99 Salpeterweighted SN cc models. Assuming that I99 W7 models reflects the true nature of the ICM enrichment, higher values obtained from the I99 WDD, I99 CDD, and M10 CDDT models indicate that we will be able to distinguish between different SN models with Astro-H observations of clusters of galaxies.
The estimated mix of SNe Ia and SNe cc (30% and 70%, respectively) expected in the ICM of A3112 based on well-established, empirically measured SN rates per star formed is close to what we infer to have enriched the ICM in the inner 52 kpc of A3112 based on this new method of high resolution spectral analysis. The inferred level of SN enrichment, SNe per of ICM, corresponds to - compared to that has been estimated as typical for clusters in the A3112 mass range.
When applied to RGS observations of a large sample of cool core galaxy clusters, this method can provide stringent constraints on the contribution of SN explosions to the metal enrichment of the ICM and the evolution of the total number of SNe Ia with redshift. This method will also provide an independent measure of a key diagnostic of the nature of SN Ia progenitors, the dependence of the evolution of SN Ia rate to the distribution of the delay time between the formation of the progenitor system and its explosion as an SN.
Acknowledgments
The authors thank Hiroya Yamaguchi for kindly providing help on the simx software. We also thank the referee for their careful reading of the paper and insightful suggestions. We gratefully acknowledge support for this research from NASA XMM-Newton grant NNX09AP92G and NASA ROSES-ADP grant NNX09AC71G.
References
- Anders & Grevesse (1989) Anders, E., & Grevesse, N. 1989, Geochim. Cosmochim. Acta, 53, 197
- Asplund et al. (2009) Asplund, M., Grevesse, N., Sauval, A. J., & Scott, P. 2009, ARA&A, 47, 481
- Balogh et al. (2011) Balogh, M. L., Mazzotta, P., Bower, R. G., et al. 2011, MNRAS, 412, 947
- Barbary et al. (2012) Barbary, K., Aldering, G., Amanullah, R., et al. 2012, ApJ, 745, 32
- Baumgartner et al. (2005) Baumgartner, W. H., Loewenstein, M., Horner, D. J., & Mushotzky, R. F. 2005, ApJ, 620, 680
- Bell & de Jong (2001) Bell, E. F. & de Jong, R. S., 2001, ApJ, 550, 212
- Botticella et al. (2012) Botticella, M. T., Smartt, S. J., Kennicutt, R. C., et al. 2012, A&A, 537, A132
- Bregman, Anderson, & Dai (2010) Bregman, J. N., Anderson, M. E., & Dai, X. 2010, ApJ, 716, L63
- Bulbul et al. (2010) Bulbul, G. E., Hasler, N., Bonamente, M., & Joy, M. 2010, ApJ, 720, 1038
- Bulbul et al. (2012) Bulbul, G. E., Smith, R. K., Foster, A., et al. 2012, ApJ, 747, 32
- de Plaa et al. (2007) de Plaa, J., Werner, N., Bleeker, J. A. M., et al. 2007, A&A, 465, 345
- De Young (1978) De Young, D. S. 1978, ApJ, 223, 47
- Dupke & Arnaud (2001) Dupke, R. A., & Arnaud, K. A. 2001, ApJ, 548, 141
- Dupke & White (2000) Dupke, R. A., & White, R. E., III 2000, ApJ, 537, 123
- Gal-Yam et al. (2002) Gal-Yam, A., Maoz, D., & Sharon, K. 2002, MNRAS, 332, 37
- Fardal et al. (2007) Fardal, M. A., Katz, N., Weinberg, D. H., & Davé, R. 2007, MNRAS, 379, 985
- Gonzalez, Zaritsky, & Zabludoff (2007) Gonzalez, A., Zaritsky, D., & Zabludoff, A. I. 2007, ApJ, 666, 147
- Grange et al. (2011) Grange, Y. G., de Plaa, J., Kaastra, J. S., et al. 2011, A&A, 531, A15
- Gunn & Gott (1972) Gunn, J. E., & Gott, J. R., III 1972, ApJ, 176, 1
- Hernquist (1990) Hernquist, L. 1990, ApJ, 356, 359
- Iwamoto et al. (1999) Iwamoto, K., Brachwitz, F., Nomoto, K., et al. 1999, ApJS, 125, 439
- Izotov & Thuan (2010) Izotov, Y. I., & Thuan, T. X. 2010, ApJ, 710, L67
- Kalberla et al. (2005) Kalberla, P. M. W., Burton, W. B., Hartmann, D., et al. 2005, A&A, 440, 775
- Kobayashi et al. (2006) Kobayashi, C., Umeda, H., Nomoto, K., Tominaga, N., & Ohkubo, T. 2006, ApJ, 653, 1145
- Kuntz & Snowden (2008) Kuntz, K. D., & Snowden, S. L. 2008, A&A, 478, 575
- Langana et al. (2011) Lagana, T. F.; Zhang, Y.-Y., Reiprich, T. H., & Schneider, P. 2011, ApJ, 743, 13
- Lin et al. (2012) Lin, Y-T, Stanford, S. A., Eisenhardt, P. R. M., et al. 2012, ApJ, 745, L3
- Lodders (2003) Lodders, K. 2003, ApJ, 591, 1220
- Loewenstein (2004) Loewenstein, M. 2004, in Origin and Evolution of the Elements, 422
- Loewenstein (2006) Loewenstein, M. 2006, ApJ, 648, 230
- Loewenstein & Davis (2010) Loewenstein, M., & Davis, D. S. 2010, ApJ, 716, 384
- Maeda et al. (2010) Maeda, K., Röpke, F. K., Fink, M., et al. 2010, ApJ, 712, 624
- Maoz & Mannucci (2011) Maoz, D., & Mannucci, F. 2011, arXiv:1111.4492
- Maoz et al. (2010) Maoz, D., Sharon, K., & Gal-Yam, A. 2010, ApJ, 722, 1879
- Markevitch (2007) Markevitch, M. 2007, arXiv:0705.3289
- Mathews & Baker (1971) Mathews, W. G., & Baker, J. C. 1971, ApJ, 170, 241
- Matsushita et al. (2007) Matsushita, K., Böhringer, H., Takahashi, I., & Ikebe, Y. 2007, A&A, 462, 953
- Million et al. (2011) Million, E. T., Werner, N., Simionescu, A., & Allen, S. W. 2011, MNRAS, 418, 2744
- Mushotzky & Loewenstein (1997) Mushotzky, R. F., & Loewenstein, M. 1997, ApJ, 481, L63
- Nomoto et al. (2006) Nomoto, K., Tominaga, N., Umeda, H., Kobayashi, C., & Maeda, K. 2006, Nuclear Physics A, 777, 424
- O’Rourke et al. (2011) O’Rourke, D. J. P., Shabala, S. S., & Alexander, P. 2011, MNRAS, 418, 2145
- Perlmutter et al. (1999) Perlmutter, S., Aldering, G., Goldhaber, G., et al. 1999, ApJ, 517, 565
- Portinari et al. (2004) Portinari, L., Moretti, A., Chiosi, C., & Sommer-Larsen, J. 2004, ApJ, 604, 579
- Riess et al. (1998) Riess, A. G., Filippenko, A. V., Challis, P., et al. 1998, AJ, 116, 1009
- Ruiz-Lapuente & Canal (1998) Ruiz-Lapuente, P., & Canal, R. 1998, ApJ, 497, L57
- Salpeter (1955) Salpeter, E. E. 1955, ApJ, 121, 161
- Sand et al. (2012) Sand, D. J., Graham, M. L., Bildfell, C., et al. 2012, ApJ, 746, 163
- Sato et al. (2007) Sato, K., Tokoi, K., Matsushita, K., et al. 2007, ApJ, 667, L41
- Simionescu et al. (2009) Simionescu, A., Werner, N., Böhringer, H., et al. 2009, A&A, 493, 409
- Smith et al. (2001) Smith, R. K., Brickhouse, N. S., Liedahl, D. A., & Raymond, J. C. 2001, ApJ, 556, L91
- Snowden et al. (2008) Snowden, S. L., Mushotzky, R. F., Kuntz, K. D., & Davis, D. S. 2008, A&A, 478, 615
- Takahashi et al. (2010) Takahashi, T., Mitsuda, K., Kelley, R., et al. 2010, Proc. SPIE, 7732,
- Tsujimoto et al. (1995) Tsujimoto, T., Nomoto, K., Yoshii, Y., et al. 1995, MNRAS, 277, 945
- Werner et al. (2006a) Werner, N., Böhringer, H., Kaastra, J. S.,et al. 2006a, A&A, 459, 353
- Werner et al. (2006b) Werner, N., de Plaa, J., Kaastra, J. S., et al. 2006b, A&A, 449, 475
- Woosley & Weaver (1995) Woosley, S. E., & Weaver, T. A. 1995, ApJS, 101, 181
- Yungelson & Livio (2000) Yungelson, L. R., & Livio, M. 2000, ApJ, 528, 108