VLT and Suzaku observations of the Fermi pulsar
PSR J10285819††thanks: Based on observations collected at ESO, Paranal, under Programme 086.D-0392(B)
Abstract
Context. The launch of the Fermi Gamma-ray Space Telescope in 2008 opened new perspectives in the multi-wavelength studies of neutron stars, with more than 100 -ray pulsars now detected. While most Fermi pulsars have been already observed in the X-rays with Chandra and XMM-Newton, optical observations with 8m-class telescopes only exist for a tiny fraction of them.
Aims. Here, we aim at searching for optical emission from the Fermi pulsar PSR J10285819 ( ms). With a spin-down age kyr and a rotational energy loss rate erg s-1, PSR J10285819 can be considered a transition object between the young, Vela-like pulsars and the middle-aged ones. At a distance of kpc and with a relatively low hydrogen column density, PSR J10285819 is a good potential target for 8m-class telescopes.
Methods. Due to its recent discovery, no optical observations of this pulsar have been reported so far. We used optical images taken with the Very Large Telescope (VLT) in the and bands to search for the optical counterpart of PSR J10285819 or constrain its optical brightness. At the same time, we used an archival Suzaku observation to confirm the preliminary identification of the pulsar’s X-ray counterpart obtained by Swift.
Results. Due to the large uncertainty on the pulsar’s radio position and the presence of a bright () early F-type star at (Star A), we could not detect its counterpart down to flux limits of and , the deepest obtained so far for PSR J10285819. From the Suzaku observations, we found that the X-ray spectrum of the pulsar’s candidate counterpart is best-fit by a power-law with spectral index and an absorption column density cm-2, which would support the proposed X-ray identification. Moreover, we found possible evidence for the presence of diffuse emission around the pulsar. If real, and associated with a pulsar wind nebula (PWN), its surface brightness and angular extent would be compatible with the expectations for a 100 kyr old pulsar at the PSR J10285819 distance.
Conclusions. A far more accurate radio position for PSR J10285819 is necessary to better determine its position relative to Star A. Future high-spatial resolution observations with both the HST and Chandra are better suited to disentangle the optical emission of PSR J10285819 against the halo of Star A and to confirm the existence of the candidate PWN.
Key Words.:
Optical: stars; neutron stars: individual: PSR J102858191 Introduction
The launch of NASA’s Fermi Gamma-ray Space Telescope in June 2008 marked a breakthrough in -ray observations of pulsars. The Large Area Telescope (LAT; Atwood et al. 2009) has now detected more than 100 -ray pulsars, to be compared with the 7 detected by the Compton Gamma Ray Observatory (CGRO) in 10 years of operation (see, e.g. Thompson 2008 for a recent review). Some of them are associated with known, or recently discovered, radio pulsars, while others are yet undetected in the radio despite of deep searches and are, thus, members of the long-hypothesised class of radio-silent -ray pulsars, of which Geminga was the first example (e.g., Bignami & Caraveo 1996; Abdo et al. 2010a). In both cases, multi-wavelength follow-ups are important to study the pulsar radiation processes over several decades in energy, to constrain the source distance and position, and to search for pulsar wind nebulae (PWNe), still challenging targets in -rays despite of the unprecedented spatial resolution of the Fermi-LAT (e.g., Ackermann et al. 2011). In the X-rays, many Fermi pulsars were already observed prior to their -ray detection, while for the others systematic follow-up observations have been carried out recently with Chandra, XMM-Newton, and Swift (see, e.g. Marelli et al. 2011 for a summary of the X-ray observations of Fermi pulsars). In the optical, the source coverage with 8m-class telescopes is still sparse with only a few Fermi pulsars observed beforehand and only a few deep follow-up observations on well-selected targets have been carried out so far (Mignani et al. 2011; Shearer et al. 2012).
The radio pulsar PSR J10285819 ( ms) was discovered by Keith et al. (2008) during a 3.1 GHz survey of a sample of low-latitude unidentified EGRET error boxes performed with the Parkes radio telescope and the Australia Telescope Compact Array (ATCA), prior to the launch of Fermi. The pulsar’s period derivative s s-1 yields a spin-down age of 92.1 kyr, a spin-down power erg s-1 and a dipolar magnetic field G. Thus, PSR J10285819 may be considered a transition object between the young, Vela-like pulsars and the middle-aged ones. The dispersion measure (DM=96.525 cm-3 pc) implies a distance of 2.3 kpc, according to the Galactic electron density model of Cordes & Lazio (2002). Initially associated with the EGRET source 3EG 10275817 upon its coincidence with the -ray error box, PSR J10285819 was recently identified as a -ray pulsar by Fermi (Abdo et al. 2009a) and included both in the Fermi catalogue Bright Source List (Abdo et al. 2009b) and in the first Fermi-LAT catalogue of -ray pulsars (Abdo et al. 2010b). Like for many Fermi pulsars, the -ray light curve is characterised by a double-peak profile, with a phase separation of , which trails the single radio peak by in phase. The pulsar’s -ray spectrum is fit by a power-law (PL) with an exponential cut-off, with a photon index and a cut-off energy GeV. Possible evidence for a PWN was also found in the Fermi data (Ackermann et al. 2011). Recently, PSR J10285819 was found to be spatially coincident with a TeV -ray source HESS J1023575 (Abramowski et al. 2011), whose emission is probably associated with the PWN. In the X-rays, PSR J10285819 was identified with a faint X-ray source detected by the Swift X-ray Telescope (XRT) in a short follow-up observation (Abdo et al. 2009a; Marelli et al. 2011) of the -ray source error box. Unfortunately, the low detection significance () hampered the characterisation of the pulsar’s X-ray spectrum.
While deeper X-ray observations of PSR J10285819 are now in progress with Chandra, no optical observations have been performed, so far. Here, we present the first optical observations of PSR J10285819, performed with the Very Large Telescope (VLT) as a part of a planned survey aimed at the optical identification of Fermi pulsars. To complement our multi-wavelength analysis, we also present a re-analysis of the published Swift/XRT observation of the pulsar and the first results of a more recent, yet unpublished, Suzaku observation available in the public science data archive.
This paper is organised as follows: observations, data reduction and analysis are described in Sect. 2, while results are presented and discussed in Sect. 3 and 4, respectively. Conclusions follow.
2 Observations and data reduction
2.1 VLT observation
PSR J10285819 was observed in service mode on February 10th and 11th, 2011 with the VLT Antu telescope at the ESO Paranal and the FOcal Reducer/low dispersion Spectrograph (FORS2), a multi-mode camera for imaging and long-slit/multi-object spectroscopy (Appenzeller et al. 1998). FORS2 was used in imaging mode and equipped with its standard MIT detector, a mosaic of two 2k4k CCDs optimised for wavelengths longer than 6000 Å. With its high-resolution colimator, the detector has a pixel scale of 0125 (22 binning), which corresponds to a projected field–of–view (FOV) of 4 over the CCD mosaic. However, due to vignetting, the effective sky coverage is smaller, and is larger for the upper CCD chip.
Observations were performed with the standard low gain, fast read-out mode, with the high-resolution collimator, and through the high-throughput ( Å; Å) and ( Å; Å) filters. To allow for cosmic ray removal, we obtained sequences of short exposures (100 s) for a total integration time of 4800 s in both the and filters. We set such a short exposure time to minimise the saturation of a bright star close to the pulsar position, identified in the Digitised Sky Survey (DSS) images. Exposures were taken in dark time and under photometric conditions, as recorded by the ESO ambient condition monitor111http://archive.eso.org/asm/ambient-server, with an airmass of and image quality of , measured directly on the images by fitting the full-width at half maximum (FWHM) of unsaturated field stars.
Data were reduced through the ESO FORS2 pipeline222http://www.eso.org/sci/software/pipelines for bias subtraction and flat–field correction. Per each band, we aligned and average-stacked the reduced science images using the swarp program (Bertin et al. 2002), applying a filter on the single pixel average to filter out residual hot and cold pixels and cosmic ray hits. Since all exposures were taken with sub-arcsec image quality, we did not apply any selection prior to the image stacking. We applied the photometric calibration by using the extinction-corrected night zero points computed by the FORS2 pipeline and available through the instrument data quality control database333www.eso.org/qc.
2.2 Swift observations
PSR J10285819 was pointed by the Swift/XRT on November 23rd 2008, during a Target of Opportunity (ToO) observation (Obs ID 00031298001) requested soon after the pulsar detection by Fermi. The XRT (Burrows et al. 2005) is a grazing incidence Wolter I telescope equipped with an X-ray CCD imaging spectrometer, yielding a 110 cm2 effective area at 1.5 keV, a FOV (236/pixel), and an Half Energy Width of 15″ in the 0.2–10 keV energy range. The integration time was 9.6 ks (7.9 ks accounting for the exposure map correction). The observations was performed in PC mode. Data reduction and analysis were performed as in Marelli et al. (2011) but using the newest version (6.11) of the HEAsoft software package444heasarc.gsfc.nasa.gov/docs/software/lheasoft/. On the same visit, the PSR J10285819 field was also observed in the near-UV with the Ultra-Violet Optical Telescope (UVOT) on board Swift. The UVOT (Roming et al. 2005) is a 30 cm, f/12.7 Ritchey-Chrétien telescope using a microchannel-intensified CCD detector which operates in photon counting mode, covering the –8000 Å range over a FOV (05/pixel). Observations were performed with the UVM2 ( Å; Å) and the UVW2 ( Å; Å) filters (Poole et al. 2008) for a total integration time of 4115 s and 5701 s, respectively. We retrieved the data from the Swift science data archive and we combined the single exposures in order to obtain the best signal–to–noise (S/N). We used the UVOT data analysis software available in HEAsoft and the version 20110131 of the UVOT calibration files.
2.3 Suzaku observations
The field of PSR J1028–5819 was observed also by Suzaku (Mitsuda et al. 2007) on July 22nd 2009. The observation (Obs ID 504045010) was performed with the pulsar located at the nominal aim-point position of the X-ray Imaging Spectrometer (XIS; Koyama et al. 2007). The XIS consists of three front-illuminated (FI) CCD cameras (XIS0, XIS2 and XIS3), and one that is back-illuminated (BI; XIS1). Each CCD camera is combined with a single X-ray telescope (Serlemitsos et al. 2007) and has a single chip, yielding a 330 cm2 (FI) or 370 cm2 (BI) effective area at 1.5 keV, field of view (pixel), and spatial resolution in the 0.2–12 keV energy range. One of the front-illuminated CCDs, XIS2, was not available at the time of our observation, since it suffered from a damage on 2006 November 9 and is unusable since then. The observations was performed in full-frame mode.
We downloaded the data from the public Suzaku science data archive through the DARTS interface555www.darts.isas.jaxa.jp/astro/suzaku/. Data reduction and analysis of the XIS was performed with HEAsoft following the procedures described in the Suzaku ABC Guide666heasarc.gsfc.nasa.gov/docs/suzaku/analysis/abc/ version 2. We used the task xispi to convert the unfiltered XIS event files to pulse-invariant channels and then xisrepro to obtain cleaned event files. For each XIS, and edit modes cleaned event data were combined using xis5x5to3x3 and xselect. Following standard practices, we excluded times within 436 s of Suzaku passing through the South Atlantic Anomaly and we also excluded the data when the line of sight was elevated above the Earths limb by less than , or is less than from the bright-Earth terminator. Moreover, we excluded time windows during which the spacecraft was passing through the low cut-off rigidity of below 6 GV. Finally, we removed hot and flickering pixels using sisclean. The nominal on-source time is 23 ks. With all the aforementioned data selection criteria applied, the resulting total effective integration time is 20.2 ks. For the spectral analysis, the response matrices were generated with xisrmfgen and using ray-tracing simulations with xissimarfgen.
3 Results
3.1 VLT astrometry
The radio position of PSR J10285819 has been obtained through interferometry observations with the ATCA (Keith et al. 2008) and is: () and (), at MJD=54562. Due to the relatively small difference of yrs between the epoch of the reference radio position and that of our VLT observation, we can neglect any additional uncertainty on the pulsar position due to its unknown proper motion. If assuming the DM pulsar distance of 2.3 kpc and a transverse velocity three times as large as the peak value of the radio pulsar velocity distribution ( 400 km s-1; Hobbs et al. 2005), the time difference would correspond to an additional uncertainty (in the radial direction) of 03, much smaller than the nominal error on the radio position. No more recent (and more accurate) radio position for PSR J10285819 has been obtained by the Fermi Pulsar Timing Consortium (Smith et al. 2008), with Weltevrede et al. (2010) assuming the original ATCA position of Keith et al. (2008), while the measured Swift/XRT position of the pulsar candidate counterpart, and (Marelli et al. 2011), has an estimated radial uncertainty of . Thus, we assume the ATCA radio position as a reference. We note that Simbad reports a quite different position, and , which is still that given in the Fermi-LAT Bright Source List (Abdo et al. 2009b).
To register the pulsar position on the FORS2 frames as precisely as possible, we re-computed their astrometric solution which is, by default, based on the coordinates of the guide star used for the telescope pointing. As a reference, we used stars selected from the Guide Star Catalogue 2 (GSC-2; Lasker et al. 2008). Although the recently released UCAC-3 catalogue (USNO CCD Astrograph Catalog; Zacharias et al. 2010) has a better astrometric accuracy then the GSC-2, it is cut at brighter magnitudes () so that most of the reference UCAC-3 stars are saturated even in the short-exposures FORS2 images. We selected GSC-2 stars evenly distributed in the field–of–view but far from the CCD edges and the vignetted regions, where geometric distortions appear to be larger than expected. We noticed this effect for the first time in our data set and, apparently, it affects all FORS2 images taken with the high-resolution collimator after 2009 (M. van den Ancker, priv. comm.). Its origin is still under investigation. We measured the star centroids through Gaussian fitting using the Graphical Astronomy and Image Analysis (gaia) tool777star-www.dur.ac.uk/pdraper/gaia/gaia.html and used the code astrom888www.starlink.rl.ac.uk/star/docs/sun5.htx/sun5.html to compute the pixel-to-sky coordinate transformation through an high-order polynomial, which accounts for the CCD distortions. The rms of the astrometric fits was in the radial direction. To this value we added in quadrature the uncertainty on the registration of the FORS2 image on the GSC2 reference frames, , where is the mean positional error of the GSC2 coordinates and is the number of stars used to compute the astrometric solution (Lattanzi et al. 1997). After accounting for the accuracy of the link of the GSC2 coordinates to the International Celestial Reference Frame (ICRF), we thus estimate that the overall () uncertainty of our FORS2 astrometry is . This is negligible compared with the absolute error on the reference pulsar position.
3.2 The search for the pulsar’s optical counterpart
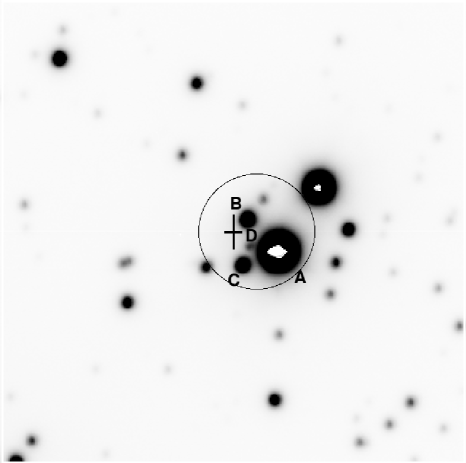
The computed PSR J10285819 position is shown in Fig. 1, overlaid on the FORS2 V-band image. As mentioned in Sectn. 2.1, it falls from a bright () field star (Star A) west of it. Unfortunately, since its halo extends to from the pulsar position we could not mask Star A without risking of severely hampering our observations. Indeed, since the angular separation between Star A’s halo and the pulsar is compatible with the telescope pointing accuracy and smaller than the absolute uncertainty on the pulsar’s position (see above), this could have been accidentally covered by one of the FORS2 occulting bars ( width with the high-resolution collimator). Moreover, Star A is part of a triplet (Star B, C) of relatively bright stars which was not resolved in the DSS-2 images, the only ones available for a quick look of the pulsar field, due to their coarse spatial resolution. This would have caused the mask to be put even closer to the pulsar position, thus increasing the risk of an accidental occultation of our target. We note that the northern star of the triplet (Star B) overlaps the pulsar position. However, its relatively high flux (; ) obviously rules it out as a possible candidate counterpart to the pulsar (e.g., Mignani 2011). The same argument also applies to the southern star of the triplet (Star C) which is of comparable brightness (; ).
A fourth, fainter star (Star D) is visible in the V-band image at from the nominal radio pulsar position, superimposed to the halo of the much brighter Star A, while in the B-band image it can not be clearly resolved, partially because of the slightly worse image quality. The offset is comparable with the uncertainty on the pulsar position, which, in principle, makes it a possible candidate counterpart. We computed the flux of Star D through customised aperture photometry using a small aperture of 4 pixel radius (05) to minimise the contribution of the bright Star A’s halo and optimise the S/N. We sampled the local background within circular areas of the same radius as the photometry aperture placed below and above the Star D’s position. We then computed the aperture correction using the growth curves of a few unsaturated field stars. The computed magnitude is , where the photometric error is dominated by the uncertainty on the subtraction of the background of the bright Star A’s halo, which makes it also an improbable candidate pulsar counterpart.
No other object is clearly visible at, or close to, the radio pulsar position. Although our images were taken under sub-arcsec seeing conditions and with short exposure times to minimise the flux contamination of Star A, its bright halo still significantly affects the background close to the pulsar position, hampering the detection of its faint counterpart. We tried to subtract Star A using the model image point spread function (PSF), computed by fitting the intensity profile of several unsaturated field stars. To this aim, we used the tools daofind, nstar, peak and substar available in the IRAF package daophot. Since Star A is partially saturated, this procedure obviously leaves some residuals at the PSF core, but can account for the subtraction of most of the PSF and its wings. Similarly, we also PSF-subtracted stars B, C, and D.
We did not detect any excess signal in the PSF-subtracted images, which can be associated with emission from a point-like source at the pulsar position. Thus, we concluded that PSR J10285819 was not detected in our VLT images. We computed the optical flux upper limits in the PSF-subtracted B and V bands images from the rms of the background sampled in the pulsar radio error box within cells of pixels, i.e. of size equal to the computed image FWHM, and we applied the computed aperture correction. We then derived upper limits of and . Unfortunately, these limits are affected by the residuals of the PSF subtraction of the four stars, with Star A and B contributing the most, which increase the local sky background by a factor of 4 with respect to other regions in the field, where the limiting magnitudes are about 1.5 magnitudes deeper.
3.3 The pulsar’s X-ray counterpart: Swift observation
It is interesting to compare our derived optical flux upper limits on PSR J10285819, the deepest obtained so far, with the extrapolation of the best-fit to the X-ray spectrum of the pulsar’s counterpart. Unfortunately, this is poorly constrained by the available Swift/XRT observation (Fig. 2), due to the short integration time (7.9 ks) and the low count statistics. We extracted all counts within a 20″radius using a similar sized background region. This yields counts s-1 in the 0.3–10 keV energy range. We re-analysed the XRT spectral data using the newest version (12.7) of the xspec fitting package (Arnaud et al. 1996). As in Marelli et al. (2011), we found a satisfactory fit with a PL with fixed photon index , assuming a fixed hydrogen column density cm-2 inferred from the Galactic value along the line of sight using the Heasarc nH tool999http://heasarc.gsfc.nasa.gov/cgi-bin/Tools/w3nh/w3nh.pl scaled for the pulsar distance of 2.3 kpc assuming a constant distribution. We note that this value of the is about a factor of smaller than assumed by Abdo et al. (2009a), cm-2, whose determination, however, is not explained. For these spectral parameters, the Swift/XRT spectrum corresponds to an unabsorbed 0.5–10 keV X-ray flux erg cm-2 s-1.
3.4 The pulsar’s X-ray identification revisited
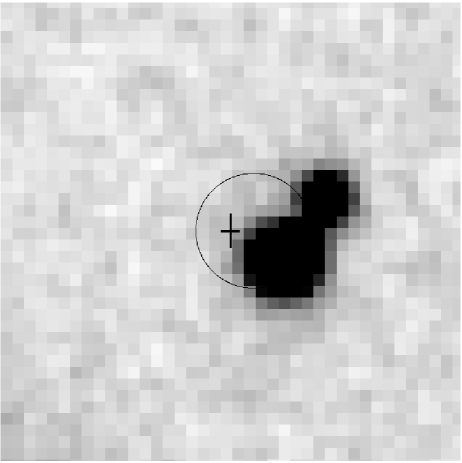
The uncertainty on the pulsar’s X-ray spectrum obviously affects the comparison with our optical flux measurements. Moreover, the positional coincidence between the Swift/XRT error circle of the pulsar candidate counterpart and Star A (Fig. 1) suggests that, in principle, this might contribute to the observed X-ray emission, which would make the characterisation of the pulsar X-ray spectrum even more uncertain. As a most extreme possibility, it cannot be ruled out that the Swift/XRT source is, actually, the X-ray counterpart to Star A and not to the pulsar. The star was clearly detected by the Swift/UVOT (see Fig. 3) but, admittedly, its possible contribution to the emission of the X-ray source was not accounted for by Marelli et al. (2011). Thus, we tried to evaluate such contribution by determining the star’s spectral type via multi-band photometry.
For the Swift/UVOT observations, we used the ftool uvotsource to determine the count rate of the star in both the UVM2 and in the UVW2 filters. We used a 2″aperture in order to minimise contamination from the nearby star north-west of it. The count rate was aperture-corrected to a radius of 5″ in order to apply the count-rate to magnitude conversion using the zero points from the the Swift/UVOT calibration (Breeveld et al. 2010, 2011). The computed magnitudes (in the Vega system) are and , where the associated errors are purely statistic (systematic errors are magnitudes). The star’s optical magnitudes are and , according to the GSC-2 (Lasker et al. 2008), while the near-infrared magnitudes, as derived from 2MASS (Skrutskie et al. 2006), are ; ; . Unfortunately, the UVOT, DSS, and 2MASS, images have not enough angular resolution to resolve the triplet of stars around Star A, while the star north-west of it (Fig. 1) is clearly resolved in all of them (see, e.g. Fig. 3). Thus, the above magnitudes must be taken with due care. However, from our VLT data we see that Star B and C are at least a factor of 50 fainter than Star A in both the B and V bands. Thus, their contribution only marginally affects the estimate of the star colours.
| Model | Observed / unabsorbed fluxa | /dof | ||||
|---|---|---|---|---|---|---|
| ( cm-2) | (keV) | ( erg cm-2 s-1) | ||||
| Power law | 1 | – | 1.09/21 | |||
| Bremmstrahlung | 0.5 | – | 1.16/21 | |||
| Raymond-Smith | 0.6 | – | 1.17/21 | |||
| Blackbody | 0.5 | – | 1.97/21 | |||
-
a
In the 0.5–10 keV energy range.
The colours of Star A are compatible with those of an early F-type main sequence star, assuming an interstellar extinction corresponding to an . According to the relation of Predhel & Schmitt (1995), this value would correspond to an cm-2, i.e. lower than estimated from scaling the Galactic value along the line of sight for the PSR J10285819 distance, suggesting that Star A is, possibly, foreground to the pulsar, consistent with a distance of kpc derived from its distance modulus. Usually, F-type stars have an X-ray–to–optical flux ratio – (e.g. Krautter et al. 1999) which might yield an X-ray flux comparable with that of the Swift/XRT source. Thus, it is possible that this is, indeed, the X-ray counterpart to Star A and not to the pulsar. However, any conclusion still depends on a better characterisation of the X-ray source spectrum and flux. To this aim, we have used the archival Suzaku observation (see Sectn. 2.3).
3.5 The pulsar’s X-ray counterpart: Suzaku observation
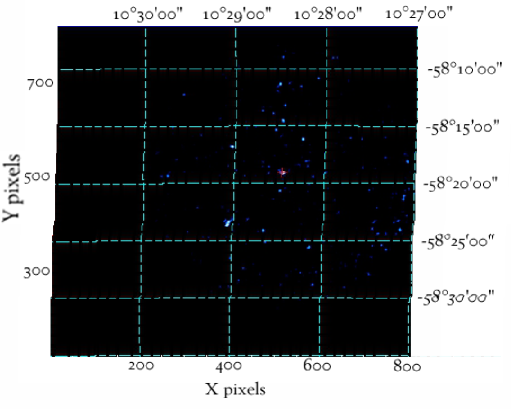
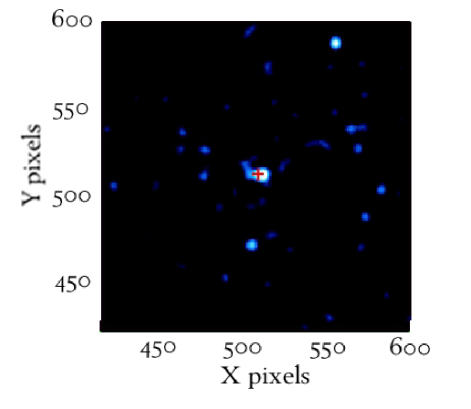
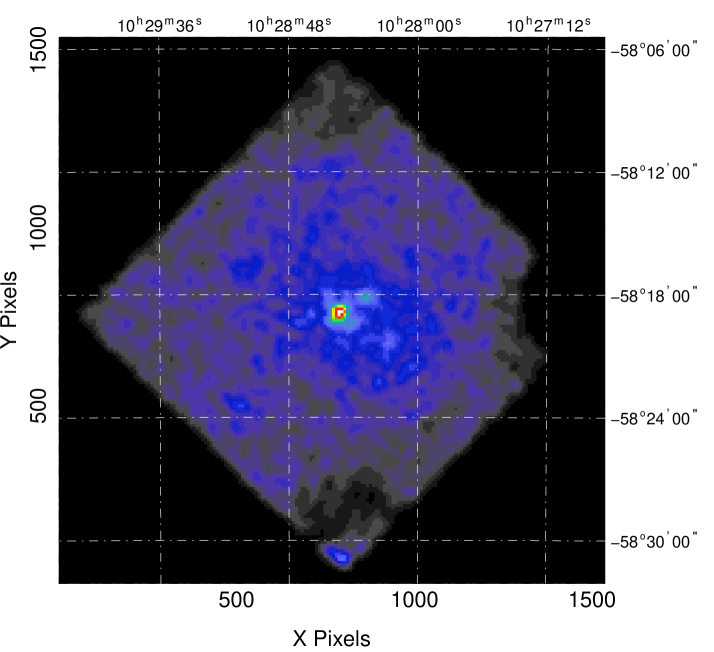
The Suzaku image of the PSR J1028–5819 field obtained combining the data from the three XIS cameras is shown in Fig. 4. Using the sliding-cells source detection algorithm in the ximage package, a source is detected at the centre of the XIS FOV with a signal-to-noise ratio of 18 in the 0.2–10 keV energy range. The source best-fit position, , (J2000), is consistent, within the absolute astrometry accuracy of Suzaku (; Uchiyama et al. 2008), with the ATCA coordinates of PSR J1028–5819 and with those of the source detected by Swift.
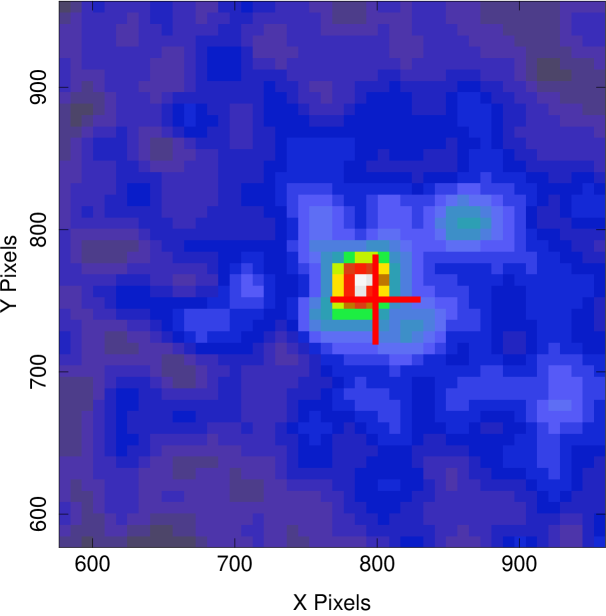
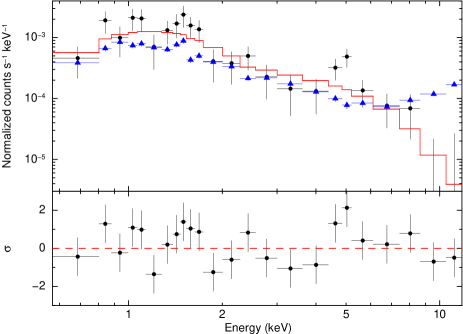
We extracted the source counts from each XIS detector using a circular region of radius centred on the best fit ximage position. This comparatively small region, corresponding to 50% of the encircled energy fraction, was chosen in order to improve the signal–to–noise ratio of the spectra and reduce the possible contamination from the diffuse emission apparent in Fig. 4. The background was extracted from an annulus with radii 3′ and 5′ centred on the X-ray source. Accounting for the counts of all the XIS detectors, the 0.5–10 keV net source count rate is counts s-1, which is not a very high statistics for a detailed spectral analysis. To increase photon statistics, we merged the source spectral files and response matrices using addascaspec. The 3-XIS spectrum was binned so as that each bin contains a minimum of 15 counts. As done for the Swift/XRT spectrum, we performed our spectral fits using the XSPEC fitting package (version 12.7). The fit with an absorbed PL model (Fig. 5) yields a spectral index and an absorption poorly constrained at cm-2 at (1), with a reduced for 21 degrees of freedom. This corresponds to an unabsorbed 0.5–10 keV X-ray flux erg cm-2 s-1, very well consistent with the value derived by Marelli et al. (2011) from the Swift/XRT observation in a similar energy range. We note that our upper limit on the is lower than the value inferred by scaling the Galactic value along the line of sight (Marelli et al. 2011), although it is not incompatible with the latter once the associated uncertainties are taken into account. We also tried other single-component models, like a blackbody (BB), a Bremsstrahlung, and a Raymond-Smith plasma (Raymond & Smith 1977). However, they all give higher values than the PL, although the fits obtained using the Bremsstrahlung and Raymond-Smith plasma models are only slightly worse than obtained using the PL (see Table 1 for a summary). To improve our results, we tried to fit the joint Swift/XRT and Suzaku/XIS spectra, but due to the low statistics of the former observation our results did not change significantly.
Our spectral fits confirm the qualitative results of Marelli et al. (2011), based on a lower statistics. In particular, the good fit with a PL () suggests that the spectrum of the X-ray source is non-thermal. Thus, it would not be produced by coronal emission from a main sequence star, like Star A. This would confirm that the X-ray source detected by both the Swift/XRT and Suzaku is, indeed, the pulsar’s X-ray counterpart. Due to the still limited statistics, we could not try spectral fits with two-component models like, e.g. a PL+BB. Thus, we can not rule out that Star A might, indeed, contribute at some level to the observed X-ray emission. Deeper observations with XMM-Newton will allow one to obtain a more precise characterisation of the X-ray spectrum of the PSR J10285819 counterpart, while optical spectroscopy of Star A will provide a far more precise classification of its spectral type, allowing one to better quantify its expected X-ray flux. In addition, high-resolution Chandra images will allow one to spatially resolve a possible X-ray source associated with Star A from the pulsar’s X-ray counterpart and secure its identification through the detection of X-ray pulsations101010We note that the frame times of the Swift/XRT in PC mode and of the Suzaku/XIS in full-frame mode are 2.507 s and 8s, respectively, which makes it impossible to seach for pulsations at the the PSR J10285819 91 ms period.
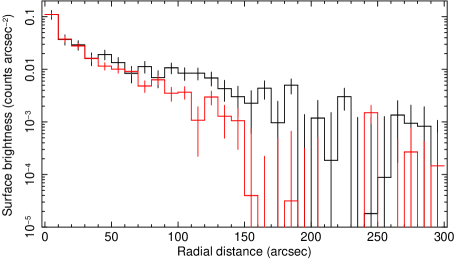
We also inspected the Suzaku data to search for possible evidence of a PWN associated with PSR J10285819. As mentioned above, diffuse emission on a scale of a few arcminutes isobserved around the pulsar’s X-ray counterpart (Fig. 4), with an apparent elongation in the south-west direction. The count-rate in this region is counts s-1 arcmin-2 in the 0.2–10 keV, computed after summing the counts collected with the three XIS detectors. However, since each XRT/XIS has a different position-dependent and broad PSF, with a complicated (roughly cross-shaped) and asymmetric profile (see, e.g. Sugizaki et al. 2009), it is difficult to determine whether the diffuse emission observed around the pulsar’s X-ray counterpart is real or not. As a test, we compared its surface brightness profile with that of a reference X-ray source. Since there are no suitable sources detected in the PSR J10285819 field–of–view (Fig. 4), we used as a reference an X-ray source detected in another Suzaku observation (Obs ID 804017020) and identified with the ms-pulsar PSR J12311411. Since both sources were observed on-axis, our comparison is not affected by the position dependance of the XIS PSF. In both cases, we selected photons in the 0.3–10 keV energy range in all the three XIS detectors and we used the xissim tool to simulate and subtract the background, accounting for the detector vignetting. Then, we extracted the radial intensity profiles, averaged over a 360∘ angle, for both the PSR J10285819 counterpart and the reference source. Finally, we normalised the counts of the reference source, computed within a radial distance bin of , to that of the PSR J10285819 counterpart. As seen from Fig. 6, the latter seems to feature an excess of counts with respect to the reference X-ray source at radial distances –, although such excess is much less evident at larger distances. This, coupled with the low count-rate of the diffuse emission, makes it difficult to determine whether it is real, hence possibly associated with a PWN or with an unresolved field source, and to quantify its contribution to the observed emission of the PSR J10285819 X-ray counterpart, in particular at angular distances smaller than . Chandra observations will be crucial to confirm the presence of the diffuse emission observed by Suzaku. If real, future measurements of the PSR J10285819 radio proper motion will, then, allow one to search for a possible alignment with the semi-major axis of the candidate PWN.
4 Discussion
4.1 The pulsar luminosity
We used our magnitude upper limits in the B-band111111For comparison with the luminosities quoted in Zharikov et al. (2006), which are computed in the B bandto compute the corresponding extinction-corrected optical flux and luminosity of PSR J10285819. As a reference for the interstellar extinction correction we assumed the upper limit on the hydrogen column density ( cm-2) derived from the fits to the Suzaku X-ray spectrum. According to the relation of Predhel & Schmitt (1995), this corresponds to an interstellar extinction . Using the extinction coefficients of Fitzpatrick (1999), the extinction-corrected B-band upper limit is, thus, erg cm-2 s-1. If we assume for the pulsar the unabsorbed Suzaku X-ray flux derived from the best-fit PL model, erg cm-2 s-1, our extinction-corrected B-band upper limit would correspond to an X-ray–to–optical flux ratio , too low to independently suggest that the X-ray source detected by Swift and Suzaku is indeed the PSR J10285819 counterpart. We computed the upper limit on the pulsar optical luminosity using as a reference its DM-based distance of 2.3 kpc (Keith et al. 2008). We note that while the uncertainty on the measured DM is negligible (DM=96.525 cm-3 pc), the Galactic electron density model of Cordes & Lazio (2002) is known to have an average uncertainty of 30% which, however, can be much larger for individual objects. As in the first Fermi-LAT catalogue of -ray pulsars (Abdo et al. 2010a), we assumed the typical uncertainty on the nominal DM-based distance of PSR J10285819. This corresponds to an uncertainty of kpc, which we assume in the following discussion. The B-band flux upper limit corresponds to an optical luminosity erg s-1 for PSR J10285819, after accounting for the assumed distance uncertainty. Given the pulsar spin-down age of 92.1 kyr, we can assume that its, yet undetected, optical emission be purely non-thermal, as normally observed in the youngest pulsars (see, e.g. Mignani 2011). Thus, for the pulsar’s spin-down power, erg s-1, our luminosity upper limit implies an optical emission efficiency . Both limits are consistent with the optical luminosity and efficiency computed for most pulsars older than 0.1 Myr (Zharikov et al. 2006) and confirm an apparent turnover in the pulsar optical emission properties. Similarly, the pulsar X-ray flux derived from the best-fit PL mode would correspond to an X-ray luminosity erg s-1, after accounting for the X-ray flux and pulsar distance uncertainties. This value would imply an X-ray emission efficiency , for an assumed beaming factor . The derived X-ray efficiency would be consistent, within the large scatter, with the trend observed for the Fermi pulsars (Marelli et al. 2011).
4.2 The pulsar multi-wavelength spectrum
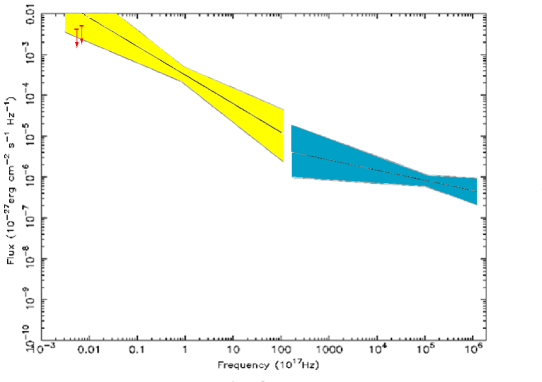
We compared the extinction-corrected B and V-band spectral flux upper limits with the extrapolations in the optical domain of the X-ray and -ray spectra of PSR J10285819. For the X-ray spectrum we used as a reference our best-fit PL model with spectral index , while for the -ray spectrum we assumed a PL with exponential cutoff, with spectral index and cutoff energy GeV, obtained from a re-analysis of the Fermi data (see also Marelli et al. 2011). The multi-wavelength spectral energy distribution (SED) of PSR J10285819 is shown in Fig. 7, where we accounted for the uncertainty on the extrapolations of the X and -ray PL spectra. The optical spectral flux upper limits are clearly above the extrapolation of the -ray PL, which does not rule out that the optical emission of PSR J10285819 can be associated with the low-energy tail of the -ray spectrum, as suggested for most -ray pulsars identified in the optical (Durant et al. 2011). This would imply a break in the optical–to–X-ray spectrum, as observed in most pulsars (see, e.g. Mignani et al. 2010). In this case, the observed optical flux would be –34, a range only marginally reachable by current 8m-class telescopes. On the other hand, the optical upper limits are also compatible with the extrapolation of the X-ray PL, which does not allow yet one to confirm the presence of a possible spectral break in the optical–to–X-ray spectrum. In general, the SED suggests that no single PL can fit the optical–to–-ray spectrum of the pulsar, with at least one spectral break required between the X and -ray energy ranges. This trend has been observed also in other Fermi pulsars (e.g., Mignani et al. 2011), probably related to a complex particle energy and density distribution in the neutron star magnetosphere.
4.3 The candidate PWN
Finally, we verified whether the diffuse emission marginally detected in the Suzaku data (Sectn. 3.5) would be compatible, if it were indeed a PWN, with the PSR J10285819 energetics and distance. PWNe have been detected in the X-rays around a number of young and energetic pulsars (see, e.g. Kargaltsev & Pavlov 2010 for a recent compilation), with luminosities equal to – of the pulsar spin-down power . In the case of PSR J10285819, one would then expect an X-ray luminosity erg s-1 for its PWN, assuming . At the PSR J10285819 distance of kpc, this would correspond to an integrated flux erg cm-2 s-1 for the PWN. By using the WebPIMMS tool121212http://heasarc.nasa.gov/Tools/w3pimms.html assuming a PWN spectral index and an hydrogen column density cm-2, this would correspond to a count-rate of counts s-1 in the 0.2–10 keV energy range. Following, e.g. Bamba et al. (2010), a PWN around a kyr old pulsar would have an angular extent of – at a distance of kpc, i.e. comparable to that of the diffuse emission detected in the Suzaku data. For the expected PWN extension, we then derive an expected count-rate of counts s-1 arcmin-2. This value is up to a factor of 30 lower than the actual count-rate measured for the diffuse emission around PSR J10285819. However, it is not incompatible with it if one assumes, e.g. either a correspondingly larger , which would still be within the observed range for the known PWNe, or a non-uniform PWN surface brightness. Thus, it is indeed plausible that the diffuse emission detected by Suzaku might be associated with the PSR J10285819 PWN.
5 Summary and conclusions
We performed the first deep observations of the Fermi pulsar PSR J10285819 with the VLT. Unfortunately, due to the presence of a bright star F-type star (Star A; ) away from the pulsar radio position (Keith et al. 2008) we could only set limits of and on its optical flux, admittedly affected by the residuals after the subtraction of Star A’s PSF and by the coarse accuracy of the radio coordinates. These limits correspond to an optical luminosity erg s-1 and emission efficiency , consistent with the pulsar spin-down age of 92.1 kyr. We also analysed archival Suzaku observations of PSR J10285819, which provide a better detection of the pulsar’s X-ray candidate counterpart and support its identification as a pulsar from a better characterisation of the X-ray spectrum, which is best-fit by a PL with spectral index . The inferred pulsar’s X-ray efficiency () would be consistent with the trend observed for the Fermi pulsars (Marelli et al. 2011). The pulsar multi-wavelength spectrum cannot be fit by single PL, implying at least one spectral break in the optical–to–-ray energy range, as observed in other Fermi pulsars. We also find a possible evidence for the presence of X-ray diffuse emission around PSR J10285819, with a surface brightness and angular extent consistent with the observed X-ray luminosity and size of known PWNe. More observations are required to complete the multi-wavelength study of PSR J10285819 at low energies. On the optical side, high-spatial resolution observations with the HST, possibly in the near-UV to exploit the low interstellar extinction along the line of sight, coupled with a much more accurate radio position, are needed to resolve the pulsar emission against the PSF wings of Star A. On the X-ray side, follow-up observations with XMM-Newton and Chandra are needed to obtain a better characterisation of the pulsar’s X-ray spectrum, accounting for any possible contribution from Star A, and detect X-ray pulsations, which will confirm the proposed identification. Chandra observations will also be crucial in confirming the existence of the diffuse emission marginally detected by Suzaku and study its spectrum and morphology.
Acknowledgements.
A key contributor to the FORS2 pipeline, Carlo Izzo (ESO), prematurely passed on June 23 2011 after fighting courageously a short illness. Thanks to Carlo’s work, the results from many FORS2 observations were published, making his inheritance forever lasting. RPM thanks Paul Ray for checking the PSR J10285819 coordinates and Mario van den Ancker and Sabine Moheler (ESO) for investigating the FORS2 geometric distortions. The authors thank Fabio Mattana for useful comments. This research made use of data obtained from Data ARchives and Transmission System (DARTS), provided by Center for Science-satellite Operation and Data Archives (C-SODA) at ISAS/JAXA. PE acknowledges financial support from the Autonomous Region of Sardinia through a research grant under the program PO Sardegna FSE 2007–2013, L.R. 7/2007 “Promoting scientific research and innovation technology in Sardinia”. This research has made use of data obtained from the High Energy Astrophysics Science Archive Research Center (HEASARC) and the Leicester Database and Archive Service (LEDAS), provided by NASA’s Goddard Space Flight Center and the Department of Physics and Astronomy, Leicester University, UK, respectively. SRO acknowledges the support of the UK Space Agency.References
- (1) Abdo, A.A., et al., 2009a, ApJ, 695, L72
- (2) Abdo, A.A., et al., 2009b, ApJS, 183, 46
- Abdo et al. (2010) Abdo, A. A., Ackermann,M., Ajello, M., et al. 2010a, ApJ, 720, 272
- (4) Abdo, A.A., et al., 2010b, ApJS, 187, 460
- (5) Abramowski, A., Acero, F., Aharonian, F., et al., 2011,
- (6) Ackermann, M., et al., 2011, ApJ, 726, 35
- (7) Appenzeller, I., et al., 1998, The Messenger, 94, 1
- Arnaud (1996) Arnaud, K. A. 1996, in ASP Conf. Ser., San Francisco CA, Vol. 101, Jacoby, G. H. and Barnes, J., eds., Astronomical Data Analysis Software and Systems V., 17
- (9) Atwood, W. B., et al., 2009, ApJ, 697, 1071
- (10) Bamba, A., Anada, T., Dotani, T., et al., 2010, ApJL, 719, 116
- (11) Bertin, E., Mellier, Y., Radovich, M., et al., 2002, in ADASS XI, ASP Conf. Series, 281, 228
- (12) Bignami, G.F. & Caraveo,,P.A. 1996, Ann. Rev. A&A, 34, 331
- (13) Breeveld, A. A., Curran, P. A., Hoversten, E. A., et al., 2010, MNRAS, 406, 1687
- (14) Breeveld, A. A., Landsman, W., Holland, S. T., et al., 2011, in GRB 2010 symposium, AIP Conference Series, in press, arXiv:1102.4717
- (15) Burrows, D. N., Hill, J. E., Nousek, J. A., et al.. 2005, SSRv, 120, 165
- (16) Cordes, J. M., & Lazio, T. J. W. 2002, arXiv:astro-ph/0207156
- (17) Durant, M., Kargaltsev, O., Pavlov, G. G., 2011, ApJ, 743, 38
- (18) Fitzpatrick, E. L. 1999, PASP, 111, 63
- (19) Hobbs, G., Lorimer, D. R., Lyne, A. G., Kramer, M., 2005, MNRAS, 360, 974
- (20) Kargaltsev, O. & Pavlov, G. G., 2010, in X-ray Astronomy 2009, AIP Conf. Proc., Vol. 1248, p. 25
- (21) Keith, M.J., Johnston, S., Kramer, M., et al., 2008, MNRAS, 389, 1881
- Koyama et al. (2007) Koyama, K., Tsunemi, H., Dotani, T., et al. 2007, PASJ, 59, 23
- (23) Krautter, J., Zickgraf, F.-J., Appenzeller, I., et al., 1999, A&A, 350, 743
- (24) Lasker, B. M., Lattanzi, M. G., McLean, B. J., et al.,2008, AJ, 136, 735
- (25) Lattanzi, M. G., Capetti, A., Macchetto, F. D., 1997, A&A, 318, 997
- (26) Marelli, M., De Luca, A., Caraveo, P.A., 2011, ApJ, 733, 82
- (27) Mignani, R.P., Sartori, A., De Luca, A., et al., 2010, A&A, 515, 110
- (28) Mignani, R.P., Shearer, A., De Luca, A., et al., 2011, A&A, 533, 101
- (29) Mignani, R.P., 2011, AdSpR, 47,1281
- Mitsuda et al. (2007) Mitsuda, K., Bautz, M., Inoue, H., et al. 2007, PASJ, 59, 1
- (31) Newberry, M.V., 1991, PASP, 103, 122
- (32) Poole, T.S., Breevel, A.A., Page, M.J., et al., 2008, MNRAS, 383, 627
- (33) Predehl, P. & Schmitt, J.H.M.M. 1995, A&A, 293, 889
- Raymond & Smith (1977) Raymond, J. C. & Smith, B. W. 1977, ApJS, 35, 419
- (35) Roming, P. W. A., Kennedy, T. E., Mason, K. O., et al., 2005, Space Sci. Rev., 120, 95
- Serlemitsos et al. (2007) Serlemitsos, P. J., Soong, Y., Chan, K.-W., et al. 2007, PASJ, 59, 9
- (37) Shearer, A., Mignani, R.P., Collins, S., et al., 2012, MNRAS, to be submitted
- (38) Skrutskie, M. F., Cutri, R. M., Stiening, et al., 2006, AJ,131, 1163
- (39) Smith, D.A., Guillemot, L., Camilo, F., et al., 2008, A&A, 492, 923
- (40) Sugizaki, M., Kamae, T., Maeda, T., 2009, PASJ, 61, S55
- (41) Thompson, D.J., 2008, Rep. Prog. Phys. 71, arXiv:0811.0738
- Uchiyama et al. (2008) Uchiyama, Y., Maeda, Y., Ebara, M., et al. 2008, PASJ, 60, 35
- (43) Weltevrede, P., Johnston, S., Manchester, R.N., et al., 2010, PASP, 27, 64
- (44) Zacharias, N., et al. 2010, AJ, 139, 2184
- (45) Zharikov, S. V., Shibanov, Yu. A., & Komarova, V. N,. 2006, AdSpR, 37, 1979