Complete ionisation of the neutral gas: why there are so few detections of 21-cm hydrogen in high redshift radio galaxies and quasars
Abstract
From the first published survey of 21-cm absorption within the hosts of radio galaxies and quasars, Curran et al. (2008b) found an apparent dearth of cool neutral gas at high redshift. From a detailed analysis of the photometry, each object is found to have a Å continuum luminosity in excess of W Hz-1, a critical value above which 21-cm has never been detected at any redshift. At these wavelengths, and below, hydrogen is excited above the ground state so that it cannot absorb in 21-cm. In order to apply the equation of photoionsation equilibrium, we demonstrate that this critical value also applies to the ionising ( Å) radiation. We use this to show, for a variety of gas density distributions, that upon placing a quasar within a galaxy of gas there is always an ultra-violet luminosity above which all of the large-scale atomic gas is ionised. While in this state the hydrogen cannot be detected nor engage in star formation. Applying the mean ionising photon rate of all of the sources searched, we find, using canonical values for the gas density and recombination rate coefficient, that the observed critical luminosity gives a scale-length (3 kpc) similar that of the neutral hydrogen (H i) in the Milky Way, a large spiral galaxy. Thus, this simple, yet physically motivated, model can explain the critical luminosity ( W Hz-1), above which neutral gas is not detected. This indicates that the non-detection of 21-cm absorption is not due to the sensitivity limits of current radio telescopes, but rather that the lines-of-sight to the quasars, and probably the bulk of the host galaxies, are devoid of neutral gas.
Subject headings:
galaxies: active — galaxies: ISM — radio lines: galaxies — ultra violet: galaxies — galaxies: high redshift — cosmology: early universe1. Introduction
Hydrogen gas accounts for 75% of all the baryonic matter in the Universe, of which the cool component, the reservoir for star formation, is traced by the radio-band 21-cm spin-flip transition. Due to the low probability of the transition, compounded by the inverse square law, this is essentially undetectable at (see Catinella et al. 2008), although in absorption the line strength is dependent only upon the column density of the absorbing gas and the radio flux of the background source.
Hydrogen has been detected in the ultra-violet band Lyman- transition, which traces all of the neutral gas, in 1500 high redshift galaxies intervening the sight-lines to more distant quasi-stellar objects (QSOs, see Curran et al. 2002; Noterdaeme et al. 2009). However, despite four decades of searches, knowledge of the cool component of this gas in the distant () Universe remains very scarce, with only 42 cases reported in these absorbers, intervening radio-loud QSOs (quasars)111Compiled in Curran (2010), with the addition of those recently reported by Srianand et al. (2010); Curran et al. (2011c)., in addition to 35 associated with the quasar host galaxy itself.222Compiled in Curran & Whiting (2010), with the addition of three new associated absorbers, two reported in Curran et al. (2011a) and one in Curran et al. (2011d). See also Allison et al. (2012).
In both cases, the majority of detections occur at redshifts of (look-back times Gyr).333We employ a standard cosmology with km s-1 Mpc-1, and . In the case of the intervening absorbing galaxies, the apparent lack of cold gas at high redshift may be accounted for by geometry effects: In an expanding Universe absorbers at redshifts of are always disadvantaged, in comparison to the low redshift () absorbing galaxies, in how effectively the absorber can cover the higher redshift background source (Curran & Webb, 2006; Curran, 2012).
Since for the associated systems the absorbing gas is located within the quasar host galaxy, such geometry effects cannot account for the fact that the 21-cm detection rate at is double that at . Furthermore, only one associated 21-cm absorber has ever been found at (Uson et al., 1991). This runs contrary to the expectation that at these redshifts (look-back times Gyr), much of the gas has yet to be consumed by star formation, meaning that we would expect the abundance of hydrogen to be many times higher than in the present day Universe (e.g. Péroux et al. 2001).
In addition to these covering factor effects, for a given column density, the optical depth of the 21-cm absorption is dependent upon the spin temperature of the gas (Wolfe & Burbidge, 1975). Since only atoms populating the lower hyperfine level can absorb in 21-cm, the spin temperature may be elevated through:
-
1.
Excitation to the upper hyperfine level (Purcell & Field, 1956).
-
2.
Excitation above the ground state, particularly by Lyman- ( Å) photons (Field, 1959).
-
3.
Ionisation.
Although, with the data available, excitation to the upper hyperfine level through collisions (Purcell & Field 1956, see also Draine 2011) cannot be ruled out, Curran et al. (2008b) find no dependence of the 21-cm detection rate on the rest-frame 1420 MHz continuum luminosity of the active galactic nucleus (AGN), thus at least ruling out excitation through this radiative process.
Curran et al. (2008b) do, however, find a strong dependence on the rest-frame Å ( Hz) continuum luminosity. Specifically, that 21-cm absorption has never been detected above an apparent critical luminosity of W Hz-1. For a detection rate at W Hz-1 (Curran et al., 2008b), the probability of 0 detections out of 19 searches occuring by chance is (significant at assuming Gaussian statistics, Curran et al. 2011a). So although the gas may be excited through other processes (collisions and the Cosmic Microwave Background), this correlation strongly suggests that excitation above the ground state (and possible ionisation) by Å photons is the dominant cause of the non-detections.
Given that 17 of the 19 W Hz-1 sources are type-1 AGN, it is also possible that the absorption, by cool gas in the circumnuclear obscuring torus invoked by unified schemes, simply does not occur along our line-of-sight to the continuum source (e.g. Morganti et al. 2001; Pihlström et al. 2003; Gupta et al. 2006). However, at W Hz-1, both type-1 and type-2 AGN exhibit a 50% detection rate (Curran et al., 2008b, 2011a), indicating the absorption must primarily arise in the main galactic disk, which is randomly oriented with respect to the torus. Therefore, the bias towards type-1 objects at W Hz-1 is due to these tending to arise in the more luminous quasars, as opposed to radio galaxies, which tend to be associated with type-2 objects and is therefore not an orientation effect (Curran & Whiting, 2010).
Thus, Curran et al. (2008b) interpreted their exclusive non-detections at to the traditional optical selection of targets, in conjunction with the high redshifts, introducing a bias towards the sources more luminous in rest-frame ultra-violet.444Despite shortlisting the faintest objects (with blue magnitudes of , see figure 5 of Curran et al. 2009). The same critical ultra-violet continuum luminosity is also evident in the lower redshift surveys (see Allison et al. 2012) and attributing the lack of cold gas in the hosts of powerful AGN to the high ultra-violet luminosities exciting the gas beyond detection (which we dub “the UV interpretation”), can explain why this effect is seen at all redshifts. The UV interpretation may also account for several other issues in extragalactic radio astronomy, such as the elevated detection rate in compact objects and the preference for 21-cm detection in radio galaxies over quasars (Curran & Whiting, 2010).
Given the low probability of zero detections occuring by chance above a given Å continuum luminosity, in conjunction the fact that Å photons excite (and possibly ionise) the gas so that it cannot absorb in 21-cm, there is little doubt that the UV interpretation is the correct physical description. This has been confirmed by an independent survey for 21-cm in 143 radio sources at redshifts , where the lack of detections is correlated with the UV luminosity (Grasha & Darling, 2011), as well as by Page et al. (2012), who find a critical X-ray luminosity, above which sources are not detected in 250 m continuum emission, a tracer of star formation.
However, one question remains unanswered: Why is there a hard limit to the UV luminosity, above which the gas is excited beyond detection by the most sensitive radio telescopes, rather than a continuum where the detections gradually become fewer and fewer as the ultra-violet luminosity increases? We address this issue here.
2. Photoionsation Equilibrium
For a cloud of hydrogen containing an ionising source, the equilibrium between photoionsation and recombination of protons and electrons in a nebula can be written as (Osterbrock, 1989),
| (1) |
where is the specific luminosity at frequency and is the Planck constant, giving the number of ionising photons per second. On the right hand side, is the extent of the ionisation, and are the proton and electron densities, respectively, and the radiative recombination rate coefficient of hydrogen (see Sect. 2.2).
Since, after excitation to the upper hyperfine level, the next excitation is to by Lyman- photons, our proxy has been the Å continuum luminosity. However, since excitation to the level and ionisation of the hydrogen atom are so close in energy (both events being times as energetic as the spin-flip transition), this critical luminosity should also apply in the case of ionisation. In order to verify this, in Fig. 1 we show the Å continuum luminosity distribution.
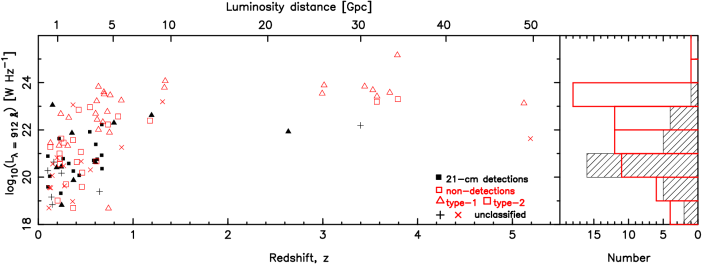
The luminosities have been derived from the photometries as described in Curran et al. (2008b), but with the inclusion of data from the Galaxy Evolution Explorer (GALEX, Martin et al. 2003). These, in conjunction with the magnitudes from the literature, allow reliable power-law fits to the rest-frame UV data (corrected for Galactic extinction using the maps of Schlegel et al. 1998) over a range of redshifts, from which the Å continuum luminosities were derived (see Curran et al. 2012).
From Fig. 1, we see that the same approximate critical value applies in the case of ionising photons. That is, 21-cm absorption has never been detected above a luminosity close to W Hz-1. The largest measured 912 Å luminosity for which there is a detection is W Hz-1, above which there are 20 non-detections. Of the sources for which we could reliably determine , there are 38 detections and 60 non-detections (i.e. a 39% detection rate) below this luminosity. Applying this probability of for a non-detection to the W Hz-1 sources, there is a binomial probability of of the 20 non-detections occuring by chance, a significance.
Thus, although only excitation above the ground state is required to explain the dearth of 21-cm absorption in UV luminous sources, it is possible that ionisation of the gas is the primary cause of the non-detections. Given that the lifetime in the state is only sec, this is the more likely situation and so we are justified in applying Eq. 1 to this problem. Thus, in Sect. 2.1 we derive the value of the left hand side of the equation, for the sources searched in 21-cm, and in Sect. 2.2, we apply various recombination models to the right hand side of the equation.
2.1. Photoionsation rates
In addition to determining the UV fluxes from the GALEX photometries and the magnitudes, in order to investigate differences between the 21-cm detected and UV luminous non-detected samples, we obtained multi-wavelength data from all of the relevant photometries given by the NASA/IPAC Extragalactic Database (NED), again correcting for Galactic extinction using the maps of Schlegel et al. (1998). As per the Å continuum luminosities, above, we used the redshifts of the targets to blue-shift the observed frequencies back to the source rest-frame values and converted the observed fluxes to luminosities. We then averaged all of the luminosities within a specified frequency range to obtain a composite SED for all of redshifted the sources searched in 21-cm absorption.
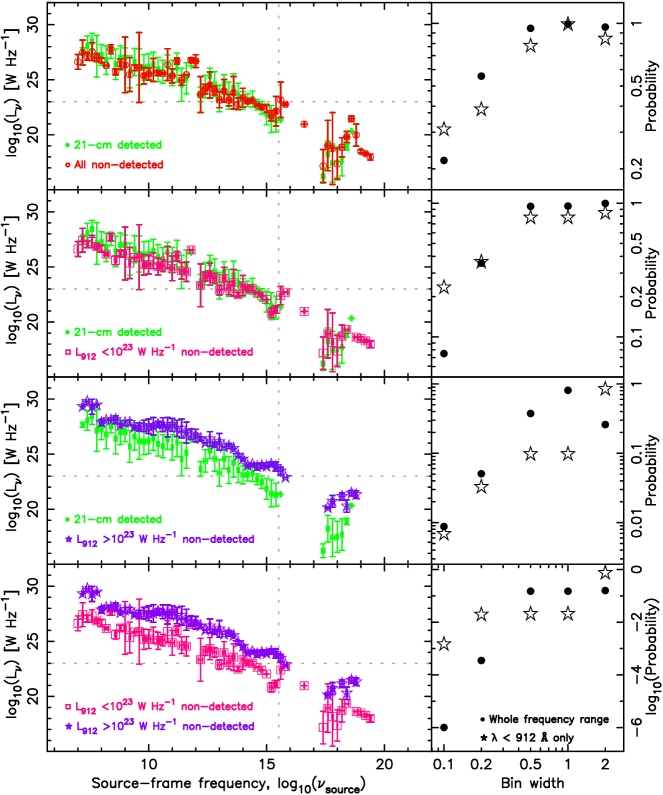
Performing a Kolmogorov-Smirnov test between the binned luminosities of the various sub-samples (shown in each panel of Fig. 2), we find no evidence that the 21-cm detected and W Hz-1 non-detected samples are drawn from different populations, with a probability of (for all bin widths) that they are drawn from the same population. However, between either the 21-cm detected/ W Hz-1 non-detected samples and the W Hz-1 sample, it is seen that, for sufficiently high resolution bins, the probability can get as low as , although this is due to the extra high frequency points in the W Hz-1 non-detected sample, with a probability of being more likely. This still suggests, however, that the UV luminous sources are drawn from a different sample than those with W Hz-1.
In order to obtain the rate of ionising photons, we are interested in frequencies above Hz. However, as seen from Fig. 2, there is a large gap in the SEDs between and Hz, the range of spaced-based ultra-violet observations between the optical and X-ray bands. Although the X-ray observations are also space-based, these generally have more sky coverage than the ultra-violet observations and are thus more likely to have observed one of our sources. So, in order to obtain an estimate of , where Hz, we smooth the SEDs (Fig. 3) and interpolate a power-law fit between and Hz
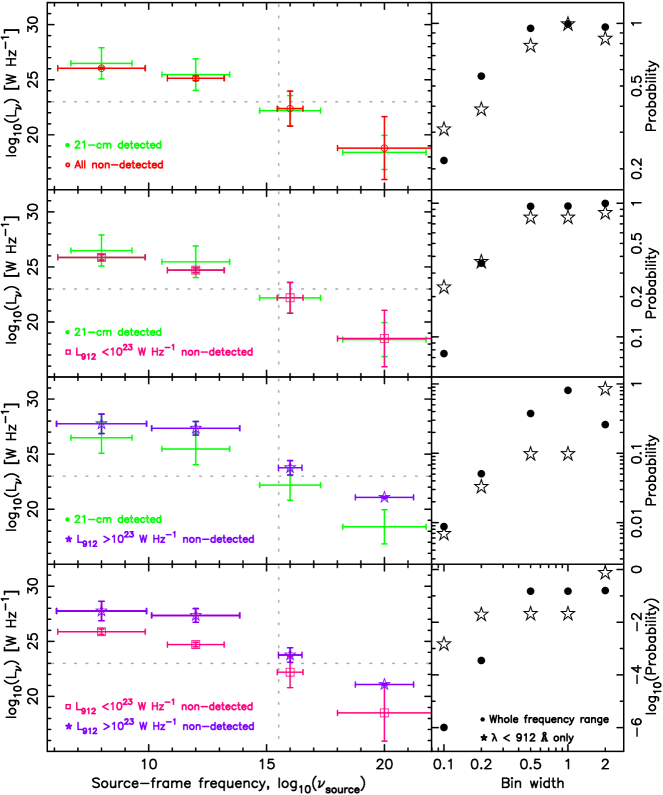
to obtain the mean dependence of on . The photon rate is given by
for a power-law, where is the spectral index and the intercept. Solving this,
From the composite SEDs, for the non-UV luminous sample we find W Hz-1, giving ionising photons sec-1 and for the UV luminous sample, W Hz-1, giving ionising photons sec-1. This is times the luminosity of the 21-cm detected sample, which is consistent with the factor of in the luminosity distances between the sample and the cluster of 21-cm detections at (Fig. 1).
2.1.1 The critical photoionsation rate
Since we are interested in the ionising photon rate resulting from a critical luminosity of W Hz-1 (Fig. 1), we use the highest 21-cm detected luminosity of W Hz-1 at Hz, together with the above spectral index of , to obtain W Hz-1, which gives sec-1 for the critical ionising photon rate. Referring to the literature, from the spectra of several hundred QSOs, Telfer et al. (2002) find a mean optical–X-ray slope of . This is significantly steeper than the mean spectral index derived for our sample, which consists exclusively of powerful radio sources, although applying a critical luminosity of W Hz-1 gives W Hz-1 sec-1, which is in the ballpark of the value derived for our sample. This is a consequence of the steeper spectral index being compensated by a larger constant (intercept) and the fact that the lower frequency end of the UV SED ( Hz) contains most of the energy. We are therefore confident in applying photons sec-1 to the left hand side of Eq. 1.555Other studies of the UV continuum slope in quasars and AGN indicate their spectral indices to be in the range to , although with considerable scatter. These give critical photon rates of and sec-1 (Scott et al. 2004; Shull et al. 2012, respectively).
Lastly, it is clear that, while the specific continuum luminosity ( or ) may provide an indicator of the amount ionising radiation from the AGN, the integrated ionising luminosity (i.e. the ionising photon rate) is the correct measure. By fitting polynomials to the photometry of the individual sources (Curran et al., 2012), in Fig. 4 we re-plot Fig. 1 in terms of .
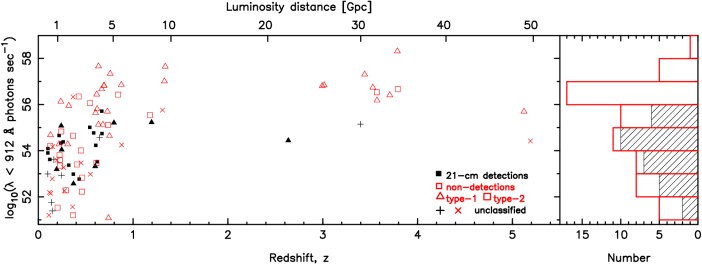
For those for which accurate polynomial fits could be obtained, we see that above ionising photons sec-1, 21-cm searches have resulted in exclusive non-detections. The highest photon rate for a detection, which could be reliably determined, is sec-1, a value above which there are 29 non-detections. Below this rate there are 38 detections and 51 non-detections, giving a probability of a non-detection. Using this proxy, the binomial probability of 29 out of 29 non-detections occuring by chance is just . This result therefore strongly suggests that ionisation of the gas by Å photons from the AGN is responsible for the non-detection of 21-cm absorption in high redshift sources.
2.2. Recombination models
We now parametrise the right hand side of the photoionsation equilibrium expression (Eq. 1). Since we are concerned with the ionisation of neutral gas and its subsequent recombination, . Also, in optical band observations of an optically thick plasma, where direct capture onto the ground state is excluded, is used. However, since we are concerned with the ground state, is the relevant total recombination rate coefficient (Osterbrock & Ferland, 2006). We choose this value at K, cm3 sec-1,666Compared with cm3 sec-1, hence the choice of or making little difference. the typical upper limit to the spin temperature found in intervening absorbers (when the Lyman- line is also detected and an upper limit to the spin temperature can be determined, Curran et al. 2010).
Naïvely assuming a constant particle density of (typical of the cool neutral 21-cm absorbing interstellar medium) throughout the nebula, we find and kpc for the mean radii of the “Strömgren spheres” of the UV non-luminous and UV luminous samples, respectively. Although the latter value is of the same order of magnitude as the extent of neutral gas in a large galaxy, this model represents a gradual increase in ionised radius with luminosity, with no critical value.
2.2.1 Exponential gas density distribution
Unlike the idealised ionised region around a star, we do not expect the gas density to remain constant on galactic scales. A more realistic model of the density of the cold neutral medium (CNM) within a galaxy is that of an exponential decrease in the gas density with distance from the nucleus (Begeman et al., 1991; Kalberla et al., 2007). Thus, for , where is the gas density at and is a scale-length describing the rate of decay of this with radius, Eq. 1 becomes
| (2) |
Unlike the constant density distribution, this becomes independent of at sufficiently large radii, i.e. . Conversely, for a given scale-length, , there always exists a “ceiling luminosity” (the number of ionising photons ) for which all of gas is ionised (Fig. 5).
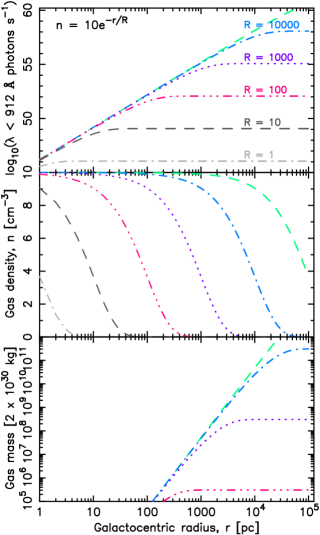
Using the above values of cm3 sec-1 and cm-3, the critical ionising photon rate of sec-1 gives a scale-length of kpc. We can compare this to the H i in the Milky Way, where Kalberla & Kerp (2009) fit an exponential profile to the mid-plane volume density distribution to find kpc and cm-3. This is in close agreement with our values, demonstrating that the mean SED normalised by a Å continuum luminosity of W Hz-1 is sufficient to ionise all of atomic gas in a large spiral galaxy, rendering it undetectable in 21-cm.
It is therefore clear that an exponential decrease in gas density with distance from the nucleus can naturally yield a critical value in the UV luminosity which is close to that found observationally. This does however, rely on a simple model of the CNM, within which various structures and phases will be embedded, such as the warm neutral medium, as well as localised regions of ionised gas and dense molecular clouds. However, here we are modelling the large-scale CNM, for which an exponential density distribution is a realistic model (Begeman et al., 1991; Kalberla et al., 2007).
Although using the canonical values for and gives the correct scale-length for the observed photon rate, a further physical (sanity) check can be obtained by deriving the total gas mass from the gas density and volume via . In this case, where the particle density of protons cm-3 corresponds to kg m-3, exponentially decaying with across a disk of thickness, , we have
| (3) |
where the flare factor, , describes the flaring of the H i gas scale-height with galactocentric radius. Applying the mean Milky Way value of (Kalberla et al., 2007), a scale-length of kpc gives a total gas mass of M⊙ (Fig. 5, bottom panel). This is close to the mean value found from a low redshift survey of 21-cm emission from the 1000 H i brightest galaxies in the southern sky (Koribalski et al., 2004), giving us further confidence in the exponential decay model and choice of gas density.
2.2.2 Alternative temperatures and disk profiles
Although spin temperatures in intervening 21-cm absorbers may be, on average, K, without the total neutral hydrogen column density from the Lyman- transition, as is the case for the associated absorbers, an upper limit to the spin temperature cannot be computed. Traditionally in the discussion of gas ionisation, temperatures of K are brandished (e.g. Osterbrock 1989; Haiman & Rees 2001), although these are in the case of Lyman- emission, rather than the much less energetic 21-cm absorption. Given that the gas is most likely ionised however, in Fig. 6 (top panel) we show the ionising luminosity versus the extent of the ionised gas for cm3 sec-1 (i.e. at K ). From the observed critical rate of photons sec-1, we see that the
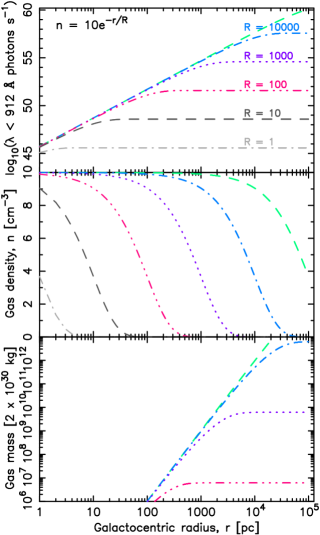
scale-length increases to kpc, which is larger than that of the Milky Way. Thus, for this temperature the photon rate is more than that required to ionise all of the neutral gas, while demonstrating that our main result is not overly sensitive to the choice of temperature.777Since (http://amdpp.phys.strath.ac.uk/tamoc/DATA/RR/)
Although having no effect on the extent of the ionisation, in order to investigate the effect of a different disk profile on the mass, in Fig. 6 we show the distribution of gas mass for a sphere, rather than a disk (i.e. ). For kpc, this gives a total gas mass of M⊙, which is close to the total (dynamical) mass expected in a galaxy and is thus too high888See Curran et al. (2008a) for an inventory of the various masses in a near-by active galaxy. and, applying a temperature of K (i.e. kpc), lowers this only slightly to M⊙. This confirms that the disk model, which reproduces a gas mass close to the typically observed value, is the more physically accurate distribution. Furthermore, although the most luminous quasars may reside in elliptical galaxies (Taylor et al., 1996), this shape traces the stellar distribution and not necessarily that of the neutral gas. For instance, “superdisks” of gas and dust in the elliptical hosts of powerful radio galaxies have been proposed (Athreya et al., 1998; Gopal-Krishna & Wiita, 2000), with diameters of kpc (Gopal-Krishna & Wiita, 2000), perhaps up to kpc (Curran et al., 2011d).
2.2.3 Alternative gas distributions
For completeness, we investigate several alternative density distributions for the gas. These are typically profiles that arise from dynamical models, often applied to the dark matter content of a galaxy, although we are interested in their effects when applied to the distribution of the CNM. The Jaffe profile (Jaffe, 1983) models the distribution of light in a spherical galaxy as , where is the radius which contains half the total emitted light. In this case Eq. 1 becomes
| (4) |
However, due to the “cuspy” nature of the distribution, solving this over these limits yields infinities and between any reasonable limits yields unreasonably large numbers, even when the approximation is used.
A similarly asymptotic density distribution is given by the Navarro–Frenk–White (NFW) profile (Navarro et al., 1996), which models the density as the distribution of dark matter in the halo, via , where and are the core density and radius of the halo, respectively. Here the right hand side of Eq. 1 becomes
| (5) |
Unlike the Jaffe profile, the photoionsation equilibrium equation can be solved, again giving a ceiling luminosity, albeit less pronounced than for the exponential gas distribution (Fig. 7, top panel). The W Hz-1 threshold of Å photons per second gives kpc, which is very close to the scale-length of the exponential disk and typical of that found for near-by galaxies (de Blok et al., 2008; Oh et al., 2011).

For a spherical mass distribution the NFW profile gives
| (6) |
from which kpc gives a total gas mass of M⊙, which, not surprisingly given the distribution used, is close to the expected value for the dynamical mass.
The asymptotic density distribution of the NFW profile can be avoided by employing the halo density distribution of an isothermal sphere (Begeman et al., 1991), i.e. , Fig. 8 (middle panel).
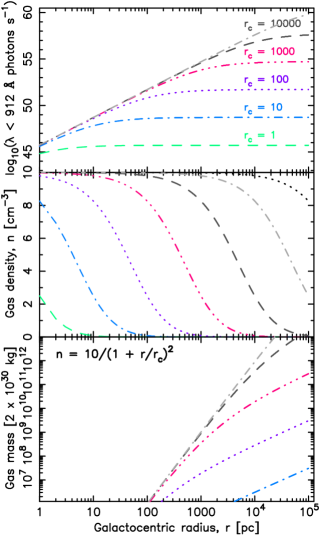
For this, the right hand side of Eq. 1 gives
| (7) |
which yields kpc for Å photons per second. Note that the ceiling luminosities are more pronounced than for the NFW profile, due to the steeper power law rise at , similar to that of the exponential gas distribution (Fig. 8, top panel). For a spherical mass distribution the profile gives
which again gives an physically unrealistic total gas mass, M⊙.
Based on the derived gas masses, we therefore conclude that the exponential distribution is the most relevant to the density profile of the CNM within the host galaxy, although the alternative models do reproduce the observed critical Å luminosity for a similar scale-length (all of which, at kpc, are close to that of the Milky Way). Although the exponential distribution may apply to our own galaxy (Kalberla et al., 2007) and, through the assumption of the canonical values, reproduces the observed critical luminosity and gas mass, currently we do not have the means to map the density profile of the CNM at high redshift. Saying this, the important point is that all of these distributions introduces a critical luminosity above which all of the gas is ionised: At lower radii, when the last term in Eqs. 2, 5 and 7 are important, a power law is seen where , which is the also the case for a constant gas density profile (Osterbrock, 1989). However, for a sufficiently high luminosity, this term is negligible and , where the decreasing UV flux with distance from the AGN maintains a sufficient number photons to fully ionise the thinning gas.
3. Discussion and Conclusions
From the first high redshift survey of associated 21-cm absorption, Curran et al. (2008b) found an apparent lack of cool neutral gas within the hosts of radio galaxies and quasars. Upon an analysis of the photometry of each source, a strong correlation between the Å continuum luminosity of the AGN and the non-detection of 21-cm was found. Specifically, that 21-cm absorption has never been detected in a source in which the luminosity exceeds W Hz-1. Although other factors may contribute to the raising of the spin temperature of the gas, the fact that 21-cm cannot be detected above the ground state, in conjunction with the lack of detections above this critical luminosity (significant at ), strongly suggests that excitation by Å photons is the dominant cause of the dearth of 21-cm in optically bright radio sources.
Here we demonstrate that this critical luminosity is also applicable to ionising ( Å) photons, showing that associated 21-cm is not detected for any source where W Hz-1 or, more precisely, when there are ionising photons sec-1. Applying this photoionsation rate, together with various gas density distribution models to the equation of photoionsation equilibrium, from canonical values for the gas density ( cm-3) and the recombination rate coefficient ( cm3 sec-1):
-
•
We obtain the observed critical photon rate for a scale-length of kpc for all of the tested profiles (exponential, NFW and isothermal sphere). This scale-length is the same as that for the H i in the Milky Way, thus suggesting that the observed critical value is just sufficient to ionise all of the neutral gas within a large spiral galaxy.
-
•
This scale-length gives:
-
–
For an exponential distribution within a disk, a total gas mass of M⊙, typical of that found from 21-cm emission studies of low redshift galaxies.
-
–
For the NFW and isothermal sphere distributions, a total gas mass which exceeds the total expected dynamical mass of the galaxy.
-
–
This leads us to conclude that the exponential profile is the more applicable to the distribution of the CNM (see Kalberla & Kerp 2009), although all of the models give a critical UV luminosity. That is, for a gas profile in which the density decreases with distance from the nucleus, the Strömgren sphere has an infinite radius for a finite luminosity. This suggests that a balance is maintained between the decreasing number of photons and number of particles with increasing distance from the ionising source.
For the sources under consideration here, the critical photon rate (where W Hz-1) is consistent with the dearth of 21-cm detections in all searched high redshift sources (Curran et al., 2008b). A “proximity effect” for highly ionised Lyman- forest clouds has previously been noted (Weymann et al., 1981; Bajtlik et al., 1988), where in these intervening systems the high ionising flux from the QSO is believed to be responsible for the decrease in the number density of the Lyman- lines as the redshift of the absorbing galaxy approaches that of the QSO ().999Bahcall & Ekers (1969) also show that both the 21-cm and the Lyman- flux can contribute to higher spin temperatures at absorber–quasar separations of less than a few tens of kpc.
However, until our high redshift survey of radio galaxies and quasars, no such effect was known for the 21-cm transition.101010From a study of absorber clustering around QSOs in the SDSS DR3, Wild et al. (2008) suggest that the QSO destroys the Mg ii clouds out to beyond 800 kpc. Mg ii has an ionisation potential of 15.04 eV, close that of H i (13.60 eV) and so a similar critical Å luminosity could perhaps account for this. Furthermore, the 21-cm effect is striking in that, rather than a gradual decrease in associated 21-cm absorption with increasing ultra-violet luminosity, there is an abrupt cut-off in the 21-cm detection rate at a single critical luminosity. We show here that, for a typical spectral energy distribution, this is the luminosity required to completely ionise the large-scale distribution of atomic gas in a large spiral galaxy.111111Although not searched in 21-cm, we derive an ionising photon rate of sec-1 ( W Hz-1) for PKS 0424–131. Since this is an order of magnitude higher than the critical rate, it could account for “the mysterious absence of neutral hydrogen”, as traced by Lyman- emission, close to this source (Francis & Bland-Hawthorn, 2004). Bruns et al. (2012) also suggest that the UV emission could be responsible, thus suppressing the star formation.
There is the possibility that the non-detection of 21-cm absorption in the high-luminosity sample is simply due to orientation effects – as mentioned previously (Sect.1), the majority (17 of 19) of the W Hz-1 sources are type-1 AGN. In the plane of the torus there may exist large columns of neutral gas, shielded from the radiation (Hennawi & Prochaska, 2007). The orientation of these objects could explain their high UV luminosities, however there are also many type-1 objects below W Hz-1, which exhibit a 50% probability of detecting 21-cm absorption. This suggests that the absorbing gas is located in the large-scale disk, which must be randomly oriented with respect to the torus (Schmitt et al., 1997; Nagar & Wilson, 1999; Curran & Whiting, 2010; Lawrence & Elvis, 2010).
Therefore, if the non-detection of absorption in the W Hz-1 sources is due to line-of-sight effects, these differ from the lower luminosity AGN in that, unlike these, the large-scale absorbing disk is always aligned with the obscuring torus. It is possible that for these, the high UV luminosities are indeed the consequence of a direct view to the AGN unobscured by the large-scale disk. This would also explain the lower luminosity type-1 objects in which 21-cm is detected, in that the absorbing gas attenuates the radiation.
Using the orientation as the sole explanation for the differences in absorption rates can not, however, explain why there is a critical value in the UV luminosities rather than a gradual decrease in absorption rates as the luminosity increases. The model presented here naturally yields a critical luminosity, and we have shown that this value is sufficient to ionise all of the CNM in a large spiral galaxy.
Our model is supported by the observation of greatly-decreased m emission from AGN above a critical luminosity (Page et al., 2012). The emission is not restricted to the line-of-sight to the nucleus, indicating that the entire galaxy is affected by the presence of a luminous AGN.
Finding redshifted 21-cm absorption is a major science goal of the Square Kilometre Array (SKA). The results found here suggest that the lack of cool neutral gas is not due to a sensitivity issue with current radio telescopes, but a real effect caused by the presence of a quasar in a galaxy of gas. That is, the known high redshift radio galaxies and quasars are probably devoid of a large-scale distribution of neutral gas.121212Simulations suggest that, while the H i content in galaxies is similar to present day values, the molecular component () is larger at (Obreschkow & Rawlings, 2009). For gas densities typical of molecular clouds, cm-3, the critical ionising photon flux of sec-1 gives a scale-length of pc at 2000 K, or pc at a more realistic 20 K. Conversely, luminosities of W Hz-1 ( photons sec-1) and W Hz-1 ( photons sec-1) are required to fully ionise a CNM with cm-3 with a scale-length of 3 kpc at 2000 and 20 K, respectively. If the deficit of neutral gas at high redshift was due to the gas being mostly molecular, there would be little reason for a lack of 21-cm to be correlated with the Å luminosity (although a lack of could be). In any case, the H i deficit is observed at all redshifts, as well as there being no observational evidence for a high molecular gas content within the hosts of radio galaxies and quasars (Curran et al., 2011b). This neutral gas provides the fuel for star formation, and our result suggests that the AGN could therefore suppress star formation in the large-scale disk. Note also that, although the 250 m fluxes are also subject to a sensitivity limit, the deficit of 250 m above a critical luminosity is further evidence of a suppression of star formation (Page et al., 2012). Here we show that this is not a sensitivity issue, but that the neutral gas, and most likely, appreciable star formation activity is simply not present.
Therefore, even the SKA will be unlikely to find this cool gas in the objects currently known.
Where it will excel, however, is in blind surveys of radio sources from which the
visible light is too faint to be detected by optical instruments (Curran et al., 2009).
Although unseen, these sources must exist in order to have had star formation within the
host galaxies of early AGN. As such, the traditional optical selection of targets must
be abandoned in order to find the missing star-forming material within high redshift radio sources.
We would like to thank John Webb, Bob Carswell, Elliot Koch, Julian Berengut, Catherine Greenhill and Nigel Badnell for their helpful input and advice. This research has made use of the NASA/IPAC Extragalactic Database (NED) which is operated by the Jet Propulsion Laboratory, California Institute of Technology, under contract with the National Aeronautics and Space Administration. This research has also made use of NASA’s Astrophysics Data System Bibliographic Service. The Centre for All-sky Astrophysics is an Australian Research Council Centre of Excellence, funded by grant CE110001020.
References
- Allison et al. (2012) Allison, J. R., Curran, S. J., Emonts, B. H. C., et al. 2012, MNRAS, 423, 2601
- Athreya et al. (1998) Athreya, R. M., Kapahi, V. K., McCarthy, P. J., & van Breugel, W. 1998, A&A, 329, 809
- Bahcall & Ekers (1969) Bahcall, J. N. & Ekers, R. D. 1969, ApJ, 157, 1055
- Bajtlik et al. (1988) Bajtlik, S., Duncan, R. C., & Ostriker, J. P. 1988, ApJ, 327, 570
- Begeman et al. (1991) Begeman, K. G., Broeils, A. H., & Sanders, R. H. 1991, MNRAS, 249, 523
- Bruns et al. (2012) Bruns, Jr., L. R., Wyithe, J. S. B., Bland-Hawthorn, J., & Dijkstra, M. 2012, MNRAS, 2543, 421
- Catinella et al. (2008) Catinella, B., Haynes, M. P., Giovanelli, R., Gardner, J. P., & Connolly, A. J. 2008, ApJ, 685, L13
- Curran (2010) Curran, S. J. 2010, MNRAS, 402, 2657
- Curran (2012) —. 2012, ApJ, 748, L18
- Curran et al. (2008a) Curran, S. J., Koribalski, B. S., & Bains, I. 2008a, MNRAS, 389, 63
- Curran et al. (2010) Curran, S. J., Tzanavaris, P., Darling, J. K., et al. 2010, MNRAS, 402, 35
- Curran & Webb (2006) Curran, S. J. & Webb, J. K. 2006, MNRAS, 371, 356
- Curran et al. (2002) Curran, S. J., Webb, J. K., Murphy, M. T., et al. 2002, PASA, 19, 455
- Curran et al. (2011a) Curran, S. J., Whiting, M. T., Murphy, , M. T., et al. 2011a, MNRAS, 413, 1165
- Curran & Whiting (2010) Curran, S. J. & Whiting, M. T. 2010, ApJ, 712, 303
- Curran et al. (2011b) Curran, S. J., Whiting, M. T., Combes, F., et al. 2011b, MNRAS, 416, 2143
- Curran et al. (2012) Curran, S. J., Whiting, M. T., Sadler, E. M., & Bignell, C. 2012, MNRAS, in press (arXiv:1210.1886)
- Curran et al. (2011c) Curran, S. J., Whiting, M. T., Tanna, A., Bignell, C., & Webb, J. K. 2011c, MNRAS, 413, L86
- Curran et al. (2009) Curran, S. J., Whiting, M. T., & Webb, J. K. 2009, Proceedings of Science, 89, Chap. 11
- Curran et al. (2011d) Curran, S. J., Whiting, M. T., Webb, J. K., & Athreya, A. 2011d, MNRAS, 414, L26
- Curran et al. (2008b) Curran, S. J., Whiting, M. T., Wiklind, T., et al. 2008b, MNRAS, 391, 765
- de Blok et al. (2008) de Blok, W. J. G., Walter, F., Brinks, E., et al. 2008, AJ, 136, 2648
- Draine (2011) Draine, B. T. 2011, Physics of the Interstellar and Intergalactic Medium (Princeton University Press)
- Field (1959) Field, G. B. 1959, ApJ, 129, 536
- Francis & Bland-Hawthorn (2004) Francis, P. J. & Bland-Hawthorn, J. 2004, MNRAS, 353, 301
- Gopal-Krishna & Wiita (2000) Gopal-Krishna & Wiita, P. J. 2000, ApJ, 529, 189
- Grasha & Darling (2011) Grasha, K. & Darling, J. 2011, in American Astronomical Society Meeting Abstracts, Vol. 43, 345.02
- Gupta et al. (2006) Gupta, N., Salter, C. J., Saikia, D. J., Ghosh, T., & Jeyakumar, S. 2006, MNRAS, 373, 972
- Haiman & Rees (2001) Haiman, Z. & Rees, M. J. 2001, ApJ, 556, 87
- Hennawi & Prochaska (2007) Hennawi, J. F. & Prochaska, J. X. 2007, ApJ, 655, 735
- Jaffe (1983) Jaffe, W. 1983, MNRAS, 202, 995
- Kalberla et al. (2007) Kalberla, P. M. W., Dedes, L., Kerp, J., & Haud, U. 2007, A&A, 469, 511
- Kalberla & Kerp (2009) Kalberla, P. M. W. & Kerp, J. 2009, Ann. Rev. Astr. Ap., 47, 27
- Koribalski et al. (2004) Koribalski, B. S., Staveley-Smith, L., Kilborn, V. A., et al. 2004, AJ, 128, 16
- Lawrence & Elvis (2010) Lawrence, A. & Elvis, M. 2010, ApJ, 714, 561
- Martin et al. (2003) Martin, C., Barlow, T., Barnhart, W., et al. 2003, in Society of Photo-Optical Instrumentation Engineers (SPIE) Conference Series, Vol. 4854, Society of Photo-Optical Instrumentation Engineers (SPIE) Conference Series, ed. J. C. Blades & O. H. W. Siegmund, 336–350
- Morganti et al. (2001) Morganti, R., Oosterloo, T. A., Tadhunter, C. N., et al. 2001, MNRAS, 323, 331
- Nagar & Wilson (1999) Nagar, N. M. & Wilson, A. S. 1999, ApJ, 516, 97
- Navarro et al. (1996) Navarro, J. F., Frenk, C. S., & White, S. D. M. 1996, ApJ, 462, 563
- Noterdaeme et al. (2009) Noterdaeme, P., Petitjean, P., Ledoux, C., & Srianand, R. 2009, A&A, 505, 1087
- Obreschkow & Rawlings (2009) Obreschkow, D. & Rawlings, S. 2009, ApJ, 696, L129
- Oh et al. (2011) Oh, S.-H., de Blok, W. J. G., Brinks, E., Walter, F., & Kennicutt, Jr., R. C. 2011, AJ, 141, 193
- Osterbrock (1989) Osterbrock, D. E. 1989, Astrophysics of Gaseous Nebulae and Active Galactic Nuclei (Mill Valley, California: University Science Books)
- Osterbrock & Ferland (2006) Osterbrock, D. E. & Ferland, G. J. 2006, Astrophysics of gaseous nebulae and active galactic nuclei (Sausalito, California: University Science Books)
- Page et al. (2012) Page, M. J., Symeonidis, M., Vieira, J. D., et al. 2012, Nature, 485, 213
- Péroux et al. (2001) Péroux, C., Storrie-Lombardi, L. J., McMahon, R. G., Irwin, M., & Hook, I. M. 2001, AJ, 121, 1799
- Pihlström et al. (2003) Pihlström, Y. M., Conway, J. E., & Vermeulen, R. C. 2003, A&A, 404, 871
- Purcell & Field (1956) Purcell, E. M. & Field, G. B. 1956, ApJ, 124, 542
- Schlegel et al. (1998) Schlegel, D. J., Finkbeiner, D. P., & Davis, M. 1998, ApJ, 500, 525
- Schmitt et al. (1997) Schmitt, H. R., Kinney, A. L., Storchi-Bergmann, T., & Antonucci, R. 1997, ApJ, 477, 623
- Scott et al. (2004) Scott, J. E., Kriss, G. A., Brotherton, M., et al. 2004, ApJ, 615, 135
- Shull et al. (2012) Shull, J. M., Stevans, M., & Danforth, C. W. 2012, ApJ, 752, 162
- Srianand et al. (2010) Srianand, R., Gupta, N., Petitjean, P., Noterdaeme, P., & Ledoux, C. 2010, MNRAS, 1888
- Taylor et al. (1996) Taylor, G. L., Dunlop, J. S., Hughes, D. H., & Robson, E. I. 1996, MNRAS, 283, 930
- Telfer et al. (2002) Telfer, R. C., Zheng, W., Kriss, G. A., & Davidsen, A. F. 2002, ApJ, 565, 773
- Uson et al. (1991) Uson, J. M., Bagri, D. S., & Cornwell, T. J. 1991, PhRvL, 67, 3328
- Weymann et al. (1981) Weymann, R. J., Carswell, R. F., & Smith, M. G. 1981, ARA&A, 19, 41
- Wild et al. (2008) Wild, V., Kauffmann, G., White, S., et al. 2008, MNRAS, 388, 227
- Wolfe & Burbidge (1975) Wolfe, A. M. & Burbidge, G. R. 1975, ApJ, 200, 548