Structural, electronic and vibrational properties of amino-adamantane and rimantadine isomers
Abstract
We performed a first principles total energy investigation on the structural, electronic, and vibrational properties of adamantane molecules, functionalized with amine and ethanamine groups. We computed the vibrational signatures of amantadine and rimantadine isomers with the functional groups bonded to different carbon sites. By comparing our results with recent infrared and Raman spectroscopic data, we discuss the possible presence of different isomers in experimental samples.
Escola Politécnica, Universidade de São Paulo, CP 61548, CEP 05424-970, São Paulo, SP, Brazil] Universidade de São Paulo, São Paulo, SP, Brazil Instituto de Física,Universidade de São Paulo, CP 66318, CEP 05315-970, São Paulo, SP, Brazil]
1 Introduction
Diamondoids, also known as molecular diamond, are nanostructured forms containing diamond-like carbon cages passivated with hydrogen atoms. Although they have been known for a long time, only the recent successes in separating them in different sizes and shapes 1 allowed to explore several of their potentialities. Diamondoids have been considered for widespread technological applications, such as electronic devices 2, 3, nano-electro-mechanical systems 4, 5, and pharmaceuticals 6, 7. Over the last few years, pharmaceutical applications have flourished, since functionalization of adamantane with amine groups leads to molecules that can be used to treat several diseases, such as influenza A, depression, and even some cases of parkinsonism.
Functionalization of adamantane () with the amine group () leads to amantadine (), also known as amino-adamantane. Functionalization with the ethanamine group () leads to rimantadine (), also known as adamantyl ethanamine. Those two chemical compounds are used to treat the influenza A virus, and are already present in several commercial drugs. Those molecules act over the influenza virus, by binding into the proton channels of the M2 viral protein and blocking protonation, which is a fundamental step for virus replication 8. However, the microscopic mechanisms of such protein binding are still subject of great controversy 9. This virus strain has recently acquired considerable resistance to amantadine and rimantadine treatments 7, 10. Therefore, it became fundamental to understand the microscopic mechanisms of the interactions between those molecules and the virus membranes, in order to provide enough information to address the upcoming challenges to treat influenza.
Adamantane consists of a single diamond-like carbon cage and carries two types of carbon atoms, represented schematically in Fig. 1, labeled C(1) and C(2). A C(1) is bound to three C(2)’s and one H atom, while a C(2) is bound to two C(1)’s and two H’s. The amine group (-NH2) could bind to either C(1) or C(2), forming respectively 1–amino-adamantane (here labeled 1–amantadine) or 2–amino-adamantane (here labeled 2–amantadine) isomers, schematically represented in Figs. 1b and 1c. The 1– and 2–rimantadine isomers, as represented respectively in Figs. 1d and 1e, could be formed by binding the ethanamine () group to either C(1) or C(2) sites. Although the respective isomers are chemically equivalent, their structural and conformational differences may be relevant when interacting with the M2 virus proton channels. As it has been recently pointed out, the conformation of the amantadine molecules within those narrow proton channels determines its effectiveness in blocking virus protonation 7. In fact, some studies have already discussed the relevance of isomers in treating influenza 11. The signatures of different isomeric molecules could be identified by comparing the respective vibrational modes coming from infrared (IR) and Raman spectra. Here, we used first principles total energy calculations, based on the Gaussian simulation package, to investigate the structural, electronic, and vibrational properties of amantadine and rimantadine isomers. Our results were compared to available experimental data, and suggested the presence of different isomeric forms in samples.
2 Methodology
The stable geometries, electronic structures, and vibrational modes of amantadine and rimantadine isomers were investigated using the Gaussian98 package 12. We considered a hybrid density functional theory (DFT), combining the Becke’s three-parameter hybrid functional 13 and the correlation one of Lee, Yang, and Parr 14 (B3LYP). The electronic states were described by a 6-311++G** Pople basis set, which consists of a split valence triple-zeta basis augmented with diffuse (+) and polarized (*) functions. In all calculations, self-consistent cycles were performed until differences in total energies were lower than 10-6 Ha between two iterations. The geometry optimizations were performed using the Berny’s algorithm 15 with no symmetry constrains. A converged geometry was obtained when the total force in any atom was lower than 10-3 Ha/a.u. This theoretical framework, based on the B3LYP/6-311++G** combination, has been widely used to explore the structural and vibrational properties of several organic molecules 16, 17, 18, 19, 20, providing a good agreement with respective experimental data. Therefore, it is expected that it would also provide an appropriate description of amantadine and rimantadine properties.
We used the adamantane molecule as a control test 21, and checked the reliability of this methodology in describing the structural and vibrational properties of this molecule with respect to other models and basis sets. In terms of the exchange and correlation potentials, a comparison for adamantane, considering the DFT/B3LYP and the MP2 models 22 and a standard 6-31G*, shows that results on interatomic distances (within 1% of accuracy), angles (within 1% of accuracy), and vibrational modes (within 2% of accuracy) are consistent with each other 23. However, the DFT/B3LYP functional provides results which are considerably better than those using a Hartree-Fock level approximation, when compared to experimental data 23.
In terms of the basis set, we compared results for adamantane, using the 6-311++G** and 6-31+G* sets, and found that interatomic distances and angles differ by less than 0.2% and vibrational frequencies (for both IR and Raman modes) differ by less than 1% for most of the modes, except for the CH and CH2 stretching modes, that differs by about 2%. Additionally, as it has been recently shown, convergence for structural and electronic properties of adamantane, in terms of number of orbitals in the basis set, is achieved for the 6-311++G** set 24. In the following section, a methodological certification is presented for the adamantane properties, by comparing our results with available experimental data.
3 Properties of adamantane: control test
Using the theoretical framework described in the previous section, the optimized adamantane molecule presented interatomic distances and bond angles which are in excellent agreement with the experimental data (within 1% of accuracy) for the molecule in the gas phase 25. Additionally, our results are in excellent agreement with those from investigations using different theoretical approaches 4, 16, 21, 26.
The energy gap of this molecule (), the difference in energy between the highest occupied molecular orbital (HOMO) and the lowest unoccupied molecular orbital (LUMO), is 7.22 eV, consistent with the value from a different investigation 24. Additionally, this value should be compared to optical gap 6.49 eV from recent experimental measurements 27 and to the value of 7.62 eV using a different theoretical model 26. The HOMO has a bonding character, and its spatial charge distribution, presented in Fig. 2a, is associated with the interstitial region between the C(1) atoms and their respective H neighbors. On the other hand, the LUMO has an anti-bonding character, associated with the C(1)-C(2) interaction, with the charge distribution in the back-bond of C(2) atoms.
As a stringent test on the reliability of this methodology, we computed the IR and Raman spectra of adamantane and compared with available data, as shown in figure 3. The vibrational spectra of adamantane consists essentially of five distinct regions 29: 400-700 cm-1 (CCC bending modes), 700-1000 cm-1 (CC stretching modes), 1000-1400 cm-1 (CCH2 rocking, twisting, and wagging modes), 1400-1600 cm-1 (CH2 scissor modes), and 2700-3000 cm-1 (CH and CH2 stretching modes). The figure indicates that theoretical results for most of the modes are within 1% of experimental data for both IR and Raman spectra. However, for the CH and CH2 stretching modes, theoretical values underestimate frequencies by about 3%, compared to experimental data. Such theoretical limitation, in treating high frequency vibrational modes, is well documented in the literature 21. Those stretching modes are associated with vibrations involving variations in the C-H interatomic distances in the external molecular bonds, being very sensitive to the molecular environment. It turns out that theoretical results are related to molecules in the gas phase, while experimental data are related to solid or solution phases, in which those external C-H bonds interact with the environment. For all the other vibrational modes, results are insensitive to the molecular environment, since the respective bonds are internal to the molecule. It has also been argued in the literature that such discrepancy in high frequency modes might come from strong anharmonic interactions between closely spaced modes of equal symmetry 30. We stress that increasing the number of orbitals in the basis set does not improve the description of modes in that high frequency range, consistent with other investigations 30.
4 Properties of amantadine isomers
Functionalization of adamantane with the amine group, to form 1– or 2–amantadine, causes negligible structural changes in interatomic distances and angles (in atoms far from the functionalized site) by less than 0.2%, in comparison with those of the original adamantane molecule. Near the functional group, the C(1)-C(2) interatomic distances are slightly affected, but important changes are observed in bond angles. In 1–amantadine, two C(2)-C(1)-N angles are 108.7∘, while the third one is 113.7∘. In 2–amantadine, those angles are 110.9∘ and 116.0∘, respectively. In both isomers, C-N and N-H distances are 1.469 and 1.016 Å, respectively. The introduction of the amine group in adamantane causes important changes on the electronic structure of the original molecule. The resulting for 1– and 2–amantadine is 6.03 and 5.99 eV, respectively. As shown in figure 2b and 2c, the HOMO of both isomers are mostly related to the nitrogen 2p non-bonding lone-pair. On the other hand, their HOMO-1 resemble the HOMO of adamantane. The LUMO for both isomers resembles the one of adamantane, including now some small charge distribution in the back-bond of their nitrogen atoms. Therefore, the reduction in , from adamantane to 1– or 2– amantadine, may be understood as resulting from the introduction of a nitrogen 2p non-bonding orbital above the HOMO of adamantane, while the LUMO is essentially unaffected by the amine incorporation. Those results also indicate that the isomers have a highly reactive site in the amine group, which is related to the nitrogen lone-pair.
In terms of stability, we obtained that the total energy of 2–amantadine molecule is only 0.17 eV higher than that of 1–amantadine, which is in excellent agreement with the experimental value for the difference in heat of formation of 0.16 eV at room temperature 31. Therefore, although samples should contain a prevailing concentration of 1–amantadine, the presence of 2–amantadine should not be negligible. In order to address this point, and confirm the presence of different isomers in experimental samples, we investigated the vibrational signatures of each isomer from IR and Raman spectroscopic data, and compared to available data.
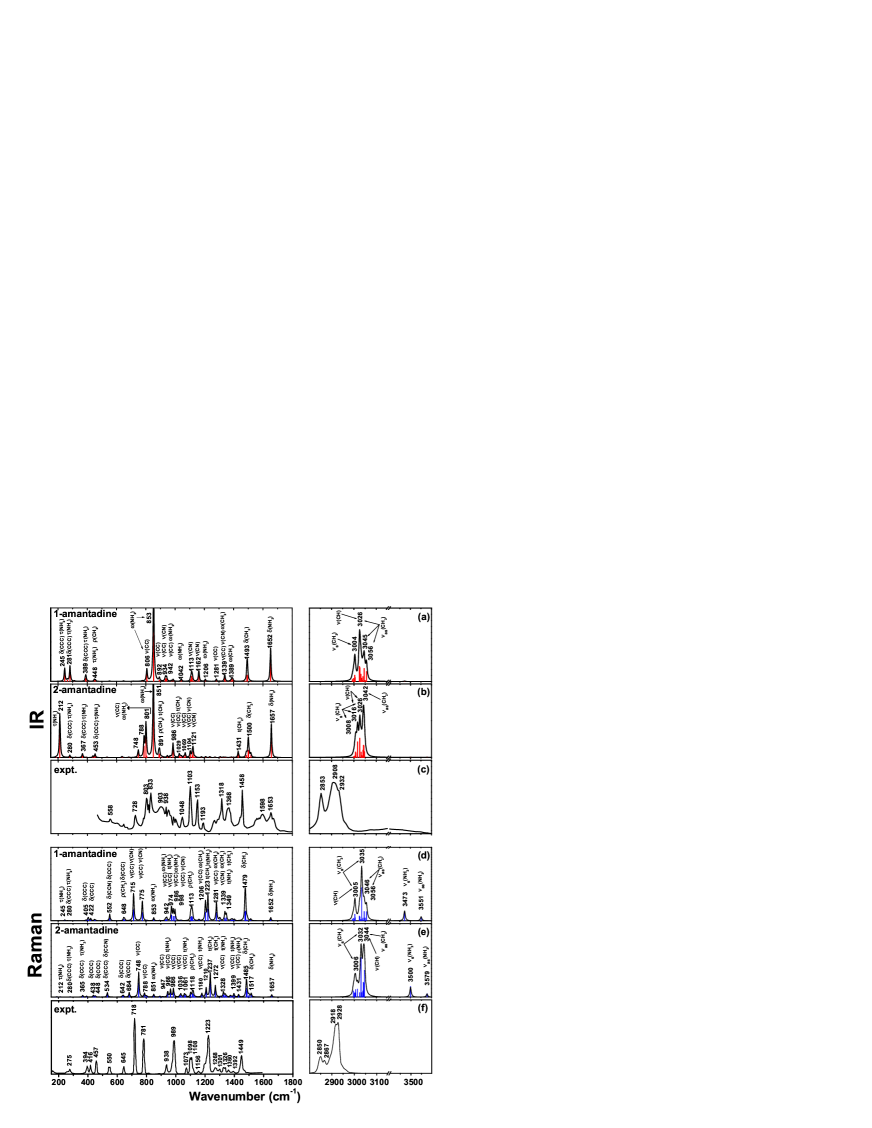
Figure 4 shows the theoretical IR and Raman vibrational spectra of 1– and 2–amantadine, and the respective experimental spectra of amantadine samples (in condensed phases) 28, 32. A major effect of amine incorporation in adamantane, for both isomers, is a symmetry lowering that causes important splitting in most of the vibrational modes. Additionally, the spectra present new nitrogen-related vibrational modes.
In the IR spectra, it is possible to clearly identify vibrational signatures of each isomer. Table 1 presents the assignments of the important vibrational modes of those isomers, according to figure 4. The CH and CH2 stretching modes appear in the 3000 cm-1 region, and there are similarities in the spectra for 1– or 2–amantadine, such that it cannot be used to identify a signature of either isomer in the experimental data, that appears in the 2853-2932 cm-1 range. The CH2 scissor modes appear on 1493 and 1500 cm-1, respectively for 1– and 2–amantadine, while experimental spectra show a single strong peak in 1458 cm-1. The CC stretching modes appear as a set of several peaks in the 806-1042 and 748-1069 cm-1 range for 1– and 2–amantadine, respectively. Experimental IR spectra shows a set of several peaks in that region. The functional group introduces several nitrogen related vibrational modes. The NH2 scissor mode appears as a single peak on 1652 and 1657 cm-1 respectively for 1– and 2–amantadine, while experimental data shows two peaks in that region, which could be a signature of the presence of different isomers in the samples. The NH2 torsion mode appears as a pair of peaks on 245 and 281 cm-1 for 1–amantadine and as a single peak on 212 cm-1 for 2–amantadine. Unfortunately experimental data does not cover such frequency region to allow a proper identification 28. The CN stretching mode appears as a set of two peaks (on 1113 and 1162 cm-1) for 1–amantadine, but as a single peak (on 1121 cm-1) for 2–amantadine. In that region, experimental data present a set of several strong peaks (on 1103, 1153, and 1193 cm-1). The poor resolution of experimental IR data, due to measurements in condensed phases that causes broadening on the peaks, compromises a clear comparison with theoretical spectra, although results indicate a prevailing concentration of 1–amantadine.
The Raman spectroscopy provides results with good frequency resolution, such that a direct assignment of modes and a comparison with experimental data 32 could be easier than for IR spectroscopy. Figure 4 shows the theoretical Raman spectra of 1– and 2–amantadine, while table 1 presents the most relevant vibrational modes. The NH2 stretching modes, which are inactive by IR spectroscopy, show clear peaks in the Raman spectra. The symmetric and antisymmetric modes are on 3473 and 3551 cm-1 for 1–amantadine and on 3500 and 3579 cm-1 for 2–amantadine. The splitting between symmetric and antisymmetric modes is about 80 cm-1 for any isomer. On the other hand, there is a shift of 30 cm-1 in the respective lines for different isomers. This could, in principle, serve as a signature to identify the presence of different isomers on experimental samples. Unfortunately, available experimental data does not cover such frequency range 32. The CC stretching modes appear as a set of several peaks for 1–amantadine, with two strong ones on 715 and 775 cm-1. For 2–amantadine, there are also several peaks, but only one strong on 748 cm-1. Experimental data shows two strong peaks on 718 and 781 cm-1, indicating a prevailing presence of 1–amantadine in samples. The 1000-1100 cm-1 is an interesting frequency range to compare results of different isomers. Our results show no lines for 1–amantadine but several ones for 2–amantadine. The presence of some lines on experimental spectra may indicate traces of 2–amantadine on samples.
5 Properties of rimantadine isomers
Functionalization of adamantane with the ethanamine group, to form 1– or 2–rimantadine, causes negligible structural changes in interatomic distances and angles, as compared to original adamantane molecule. Such changes are even smaller than the ones for amine functionalization, discussed in section 4. In both isomers, C-N and N-H distances are 1.477 and 1.016 Å, respectively. The introduction of the ethanamine group in adamantane causes important changes on the electronic structure of the original adamantane molecule. The resulting for 1– and 2–rimantadine are 6.12 and 6.16 eV, respectively. As shown in figure 2d and 2e, the HOMO of both isomers are related to the nitrogen 2p non-bonding lone-pair, equivalently to those for amantadine molecules. The LUMO for both isomers resembles the one of adamantane, including now some charge distribution in the back-bond of nitrogen and carbon atoms of the functional group. Therefore, the reduction in , from adamantane to rimantadine, can be understood equivalently to the case of amantadine. The results also indicate that the isomers have a highly reactive site in the ethanamine group, which is related to the nitrogen lone-pair.
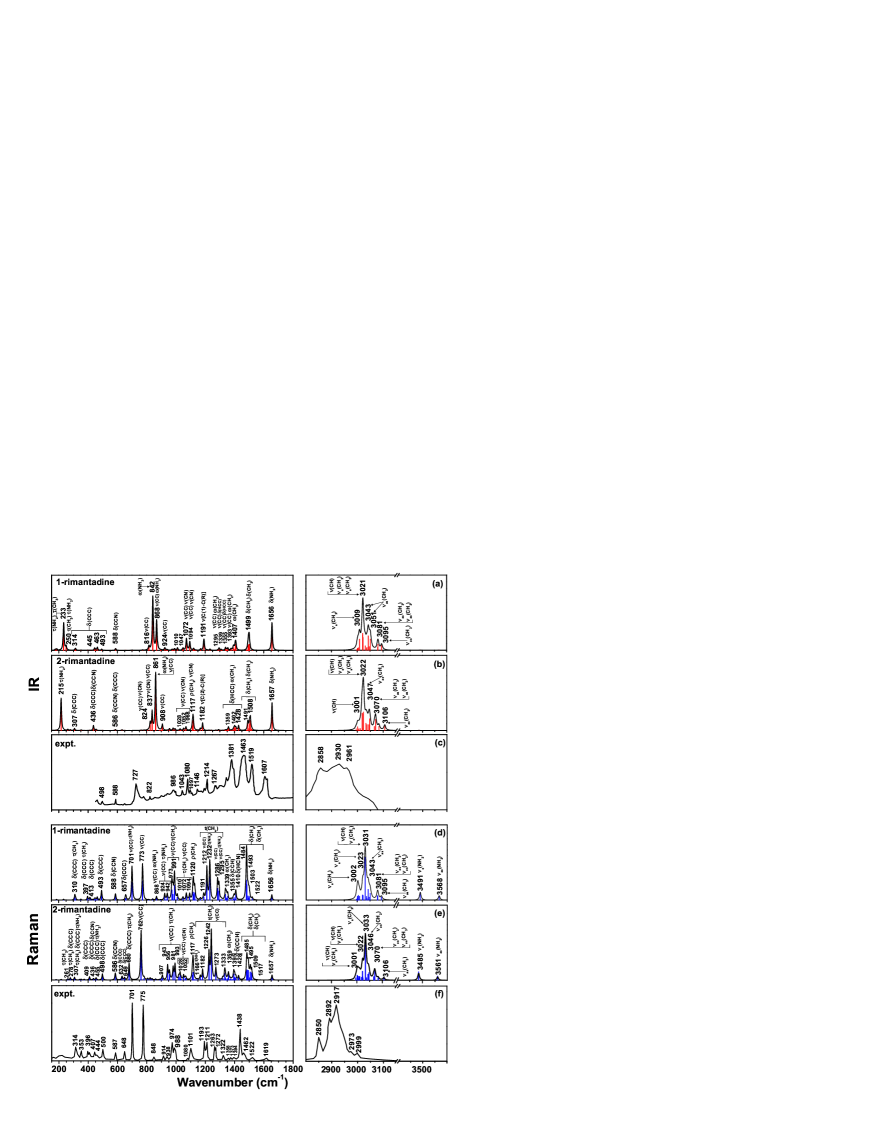
In terms of stability, the total energy of 2–rimantadine molecule is only 0.23 eV higher than that of 1–rimantadine. Equivalently to the case of adamantane, there should be a prevailing concentration of 1–rimantadine in experimental samples, but the presence of 2–rimantadine should not be negligible. IR and Raman spectroscopy could address this point. Figure 5 shows the theoretical IR and Raman vibrational spectra of 1– and 2–rimantadine, and the respective experimental data of rimantadine samples (condensed phase of hydrochloride rimantadine) 33.
Figure 5 shows the theoretical and experimental IR spectra of rimantadine isomers. In the high frequency, there are several CH and CH2 stretching modes, which are mixed with the CH3 stretching mode, coming from the functional group. That wide band for both isomers, in the 3000 cm-1 region, includes a tail in the high frequency, which is related to the CH3 group, and is fully consistent with experimental data 33. Other vibrational modes of rimantadine, described in table 1, show similarities with the respective ones of amantadine. The CH2 plus CH3 rocking modes appear as a single peak in 1–rimantadine (on 1499 cm-1) and as a set of two peaks in 2–rimantadine (on 1491 and 1508 cm-1). The experimental spectra shows a single line on 1519 cm-1, suggesting a prevailing concentration of 1–rimantadine in samples. The NH2 wagging mode appears as a set of two peaks in 1–rimantadine (on 842 and 868 cm-1) and as a single peak in 2–rimantadine (on 861 cm-1), while experimental spectra shows several peaks in that frequency region. Finally, the NH2 torsion mode appears as a set of two peaks on 233 and 250 cm-1 for 1–rimantadine and as a single peak on 215 cm-1 for 2–rimantadine, but there is no experimental data in this frequency region.
Figure 5 shows the theoretical and experimental Raman spectra of rimantadine isomers 33. Most of the vibrational modes resemble the ones for amantadine, as described in table 1. The ethanamine group introduces CH3 stretching modes, which mixed with the CH and CH2 ones, introducing a tail in in the high frequency region. The theoretical spectra shows clear NH2 symmetric and antisymmetric stretching modes, in the high frequency region, in 1–rimantadine (on 3491 and 3568 cm-1) and 2–rimantadine (on 3485 and 3561 cm-1). Although such NH2 modes could be used to identify signatures of either isomers, experimental data does not appear to cover such frequency region.
6 Summary
In summary, we carried a theoretical investigation on the structural, electronic, and vibrational properties of two isomeric forms of amantadine and rimantadine molecules. We find that, for all amantadine and rimantadine isomers, the charge distribution of HOMO is always associated with the nitrogen lone pair, which is also the most chemically reactive site in those molecules. Therefore, the mechanism of interaction between those molecules with the viral proton channels is likely associated with the protonated nitrogen lone pair. Although the HOMO in different isomers have the same nitrogen character, their spatial conformations are different, which would cause different electronic affinity, and consequently, different strength in interactions with proton channel walls.
We additionally found small difference in total energies between isomeric forms of amantadine and rimantadine, which suggest that both isomers could be present in samples. The IR and Raman vibrational spectra of those isomers were discussed in the context of the changes in spectra of adamantane caused by the amine and ethanamine incorporation. The comparison of theoretical and experimental spectra suggested a prevailing presence of 1–amantadine and 1–rimantadine molecules in experimental samples, although the presence of their respective isomers cannot be neglected. Our assignment of all vibrational modes of isomeric forms can be useful in future explorations of those molecules.
Acknowledgments
The authors acknowledge partial support from Brazilian agencies CNPq and FAPESP.
References
- 1 J. E. Dahl, S. G. Liu, and R. M. K. Carlson, Science 299, 96 (2003).
- 2 W. L. Yang, J. D. Fabbri, T. M. Willey, J. R. I. Lee, J. E. Dahl, R. M. K. Carlson, P. R. Schreiner, A. A. Fokin, B. A. Tkachenko, N. A. Fokina, W. Meevasana, N. Mannella, K. Tanaka, X. J. Zhou, T. van Buuren, M. A. Kelly, Z. Hussain, N. A. Melosh, and Z. X. Shen, Science 316, 1460 (2007).
- 3 Y. Y. Wang, E. Kioupakis, X. H. Lu, D. Wegner, R. Yamachika, J. E. Dahl, R. M. K. Carlson, S. G. Louie, and M. F. Crommie, Nature Materials 7, 38 (2008).
- 4 J. C. Garcia, J. F. Justo, W. V. M. Machado, and L. V. C. Assali, Phys. Rev. B 80, 125421 (2009).
- 5 J. C. Garcia, L. V. C. Assali, W. V. M. Machado, and J. F. Justo, J. Phys.: Condens. Matter 22, 315303 (2010).
- 6 H. Huang, E. Pierstorff, E. Osawa, and D. Ho, Nano Lett. 7, 3305 (2007).
- 7 A. L. Stouffer, R. Acharya, D. Salom, A. S. Levine, L. Di Costanzo, C. S. Soto, V. Tereshko, V. Nanda, S. Stayrook, and W. F. DeGrado, Nature 451, 596 (2008).
- 8 J. R. Schnell and J. J. Chou, Nature 451, 591 (2008).
- 9 E. Khurana, M. Dal Peraro, R. DeVane, S. Vemparala, W. F. DeGrado, and M. L. Klein, Proc. Natl. Academ. Sci. U. S. A. 106, 1069 (2009).
- 10 R. M. Pielak, J. R. Schnell, and J. J. Chou, Proc. Natl. Academ. Sci. U. S. A. 106, 7379 (2009).
- 11 G. Zoidis, N. Kolocouris, G. B. Foscolos, A. Kolocouris, G. Fytas, P. Karayannis, E. Padalko, J. Neyts, and E. De Clercq, Antiv. Chem. Chemoth. 14, 153 (2003).
- 12 M. J. Frisch, G. W. Trucks, H. B. Schlegel et al., GAUSSIAN 98, Revision A.11.2 (Gaussian, Inc., Pittsburgh, PA, 2001).
- 13 A. D. Becke, J. Chem. Phys. 104, 1040 (1996).
- 14 C. T. Lee, W. T. Yang, and R. G. Parr, Phys. Rev. B 37, 785(1988).
- 15 C. Y. Peng, P. Y. Ayala, H. B. Schlegel, and M. J. Frisch, J. Comput. Chem. 17, 49 (1996).
- 16 G. Ramachandran and S. Manogaran, J. Molec. Struct. 766, 125 (2006).
- 17 J. P. Merrick, D. Moran, and L. Radom, J. Phys. Chem. A 111, 11683 (2007).
- 18 M. K. Hazra, Chem. Phys. Lett. 473, 10 (2009).
- 19 M. Kurt, J. Raman Spectr. 40, 67 (2009).
- 20 S. Yurdakul and T. Polat, J. Molec. Struct. 963, 194 (2010).
- 21 S. L. Richardson, T. Baruah, M. J. Mehl, and M. R. Pederson, Chem. Phys. Lett. 403, 83 (2005).
- 22 C. Møller and M. S. Plesset, Phys. Rev. 46, 618 (1934).
- 23 J. O. Jensen, Spectrochim. Acta A 60, 1895 (2004).
- 24 F. Marsusi, K. Mirabbaszadeh, and G. Ali Mansoori, Physica E 41, 1151 (2009).
- 25 I. Hargittai and K. W. Hedberg, J. Chem. Soc. D - Chem. Commun. 22, 1499 (1971).
- 26 G. C. McIntosh, M. Yoon, S. Berber, and D. Tománek, Phys. Rev. B 70, 045401 (2004).
- 27 L. Landt, K. Klünder, J. E. Dahl, R. M. K. Carlson, T. Möller, and C. Bostedt, Phys. Rev. Lett. 103, 047402 (2009).
- 28 http://webbook.nist.gov/.
- 29 J. Filik, J. N. Harvey, N. L. Allan, P. W. May, J. E. P. Dahl, S. G. Liu, and R. M. K. Carlson, Spectrochim. Acta, Part A 64, 681 (2006).
- 30 J. Oomens, N. Polfer, O. Pirali, Y. Ueno, R. Maboudian, P. W. May, J. Filik, J. E. Dahl, S. Liu, and R. M. K. Carlson, J. Molec. Spectr. 238, 158 (2006).
- 31 T. Clark, T. M. O. Knox, M. A. McKervey, H. Mackle, and J. J. Rooney, J. Am. Chem. Soc. 101, 2404 (1979).
- 32 L. Rivas, S. Sánchez–Cortés, J. Stanicova, J. V. García-Ramos, and P. Miskovsky, Vib. Spectrosc. 20, 179 (1999).
- 33 http://www.sigmaaldrich.com/.
| IR | ||||
| mode | 1–amantadine | 2-amantadine | 1–rimantadine | 2-rimantadine |
| (CH2) | 3004-3056 | 3008-3042 | 3009-3051 | 3001-3047 |
| (CH3) | — | — | 3081+3095 | 3070+3106 |
| (CH2) | 1493 | 1500 | 1499 | 1491+1508 |
| (CC) | 806-1042 | 748-1069 | 816-1047 | 824-1052 |
| (NH2) | 1652 | 1657 | 1656 | 1657 |
| (NH2) | 853 | 851 | 842+868 | 861 |
| (NH2) | 245+281 | 212 | 233+250 | 215 |
| (CN) | 1113+1162 | 1121 | 1072+1094 | 1068+1117 |
| Raman | ||||
| (CH2) | 3005-3056 | 2006-3044 | 3002-3043 | 3001-3033 |
| (CH3) | — | — | 3081+3095 | 3070+3106 |
| (CH2) | 1479 | 1485-1517 | 1484-1522 | 1485-1517 |
| t(CH2) | 1223 | 1237 | 1212+1232 | 1226+1242 |
| (CC) | 715-998 | 748-986 | 701-991 | 762-993 |
| (NH2) | 3473+3551 | 3500+3579 | 3491+3568 | 3485+3561 |
| (NH2) | 1652 | 1657 | 1656 | 1657 |