Elementary processes governing the evolution of road networks
Abstract
Urbanisation is a fundamental phenomenon whose quantitative characterisation is still inadequate. We report here the empirical analysis of a unique data set regarding almost 200 years of evolution of the road network in a large area located north of Milan (Italy). We find that urbanisation is characterised by the homogenisation of cell shapes, and by the stability throughout time of high–centrality roads which constitute the backbone of the urban structure, confirming the importance of historical paths. We show quantitatively that the growth of the network is governed by two elementary processes: (i) ‘densification’, corresponding to an increase in the local density of roads around existing urban centres and (ii) ‘exploration’, whereby new roads trigger the spatial evolution of the urbanisation front. The empirical identification of such simple elementary mechanisms suggests the existence of general, simple properties of urbanisation and opens new directions for its modelling and quantitative description.
pacs:
89.75.Hc,89.75.-k,89.75.Fb,89.65.LmUrbanisation is a fundamental process in human history Mumford:book , and is increasingly affecting our environment McDonald:2011 and our society Dye:2008 ; Glaeser:2011 ; Barnes:2011 . The fraction of the world population living in urban areas has recently grown beyond 50% and is expected to rapidly increase in the near future UN . The challenges presented by such a rapidly urbanising world are complex and difficult to handle. They range from the increasing dependence of our society on fossil fuels Newman:1999 , to the emergence of socio-spatial inequalities UN:slum ; UN:2008 , and to the up-rise of serious environmental issues Satterthwaite:book . Controlling urbanisation has already proven to be a difficult task, and it will become even more difficult in the near future, due to the large and unprecedented magnitude of urban expansion Angel:book , and to the intrinsic complexity of this phenomenon, which generates cities that are continuously changing over time Hall:1997 in a non-homogeneous fashion Seto:2010 . Trying to understand the elementary spatial mechanisms that govern urbanisation, leaving out specific historical, geographical, social and cultural factors, is nowadays more important than ever, especially because policy makers, professionals and researchers are actively looking for new paradigms in urban planning, land management and ecology UN-Habitat:2010 ; Turner:2007 ; Ramalho:2011 . The existence of acultural and non-demographic drivers of urbanisation has been investigated using different approaches Batty:2008 , including classical studies in regional sciences Wilson:1970 , theory of complex systems Batty:fractal ; Batty:book ; Makse:1995 , urban theory Nikos:book and remote sensing Hannes:2012 . A consistent amount of literature in urban history and morphology indicates that roads are a fundamental driver in urban evolution and, at the same time, one of the long-lasting constituent elements of urban forms Marshall:book ; Southworth:book . In the last decade, complex networks theory has provided significant contributions to the quantitative characterisation of urban street patterns delta_centrality ; Xie:2007 ; Barthelemy:2011 . Several studies have shown that road networks not only play a central role in the spatial organisation of urban areas Lammer:2006 ; Cardillo:2006 , but are important for the dynamical processes occurring on them Barthelemy:2011 ; Bettencourt:2007 ; Bettencourt10 ; Balcan:2009 ; Porta:2011 and for the evolution of urban systems in general Hanson:2004 ; Xie:2009 . However, a quantitative analysis of the historical development of urbanisation in metropolitan areas is still missing, and empirical evidence of the basic mechanisms governing urbanisation dynamics is still lacking. Our paper addresses this problem, and provides a study of the evolution over two centuries of the road network in a large urban area located north of Milan (Italy).
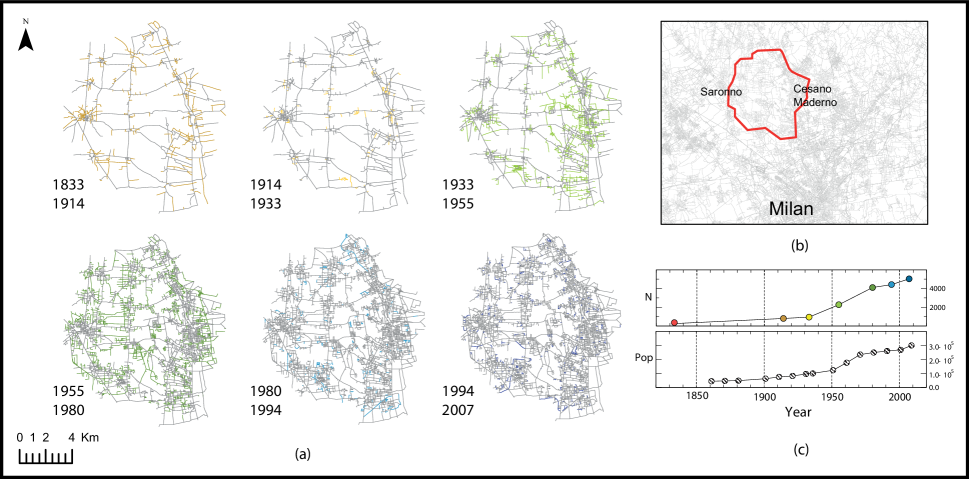
The area under study, known as Groane, covers a surface of , includes urban centres within municipalities, and has essentially evolved along two main radial paths, connecting Milan to Como and Milan to Varese, respectively. The former path was constructed by the Romans during the II century B.C., while the latter was created during the XVI century. In the last two centuries, the Groane area has faced a complex process of conurbation, changing from a polycentric region into a completely urbanised area. This conurbation process is common to many large European metropolitan regions EU:2006 . Despite local differences, it is possible to identify four distinct phases that characterize urbanization in the Groane area: i) Rural phase, (1800-1918): fundamentally pre-industrial, fully based on agricultural economy, with no major transportation infrastructures present. ii) Early-urban phase (1918-1945): between world wars period, still significantly based on agriculture economy, witnessing the first appearance of rail network, first small-scale sparse industrial colonisation, and limited expansion of rural settlements around the historical centres. iii) Urban-industrial phase (1945-1990): remarkable sprawled residential and industrial development (especially textile and mechanics) along with population growth and highway construction. iv) Metropolitan post-industrial phase (1990- 2012): decline of industrial activities, slower-paced urban sprawl, former polycentric organisation overwhelmed by the metropolitan continuum caused by the merging of expanded centres, increased long-range mobility due to the development of high speed trains and large highway systems Turri:2000 . It is important to note that this area has never been subjected to overall large-scale planning efforts, one reason being that different administrative bodies preside over different municipalities. By importing historical topographical and photogrammetrical data (for details see the Methods section) into a Geographical Information System (GIS) environment, we reconstructed the detailed road system (including minor streets) at seven different points in time, , respectively corresponding to years: . For each time, we constructed the associated primal graph Barthelemy:2011 , i.e. the graph where the nodes represent street junctions and the links correspond to road segments. The geographical information sources used to construct the primal graphs are reported in Table 1.
| Date | Source | Owner | Format |
|---|---|---|---|
| 1833 | Topographical Map of Lombardy-Venetia Kingdom | Italian Military Geographic Institute | Raster |
| 1914 | Map of Italy | Italian Military Geographic Institute | Raster |
| 1933 | Map of Italy | Italian Military Geographic Institute | Raster |
| 1955 | Aerial Photography Survey | Italian Military Geographic Institute | Raster |
| 1980 | Lombardy Regional Map | Lombardy Region | Raster |
| 1994 | Lombardy Regional Map | Lombardy Region | Raster |
| 2007 | Mosaic of Urban Municipalities Plans | Lombardy Region | Vectorial |
In Fig. 1a we display the road networks at different times, showing how the initial small separate villages have grown by the addition of new nodes and links, eventually merging together in an homogeneous pattern of streets. We denote by the graph at time , where and are respectively the set of nodes and the set of links at time . The number of nodes at time is then , while is the number of links. By definition, we have and , where and are, respectively, the set of new nodes and the set of new links added to the system in the time window . In the following we will study the structure of the graph at different times , focusing in particular on the properties of the new links. As we will show, a quantitative analysis of the temporal evolution of the system will be able to reveal in particular the existence of two simple mechanisms that drive the evolution of the road network over time.
Results
Characterising the growth of the road network.
The Groane area is basically characterised by an uninterrupted growth in the period under consideration and displays remarkable modifications of the road system. As shown in Fig. 1c, in less than two centuries, the total number of nodes has increased by a factor of twenty, from the original nodes present at (year ) to more than nodes at (year ). However, the rate of growth is not constant over time: it is slow from 1833 to 1933, fast from 1933 to 1980, and slow again from 1980 to 2007. These different growth rates are the signature of distinct phases of the urbanisation process, and are strongly related to the growth of the population. We indeed show that the number of nodes is a linear function of the number of people living in the Groane area (see Fig. 2a) or, in other words, that the average number of people per road intersection in the area remains constant over time.
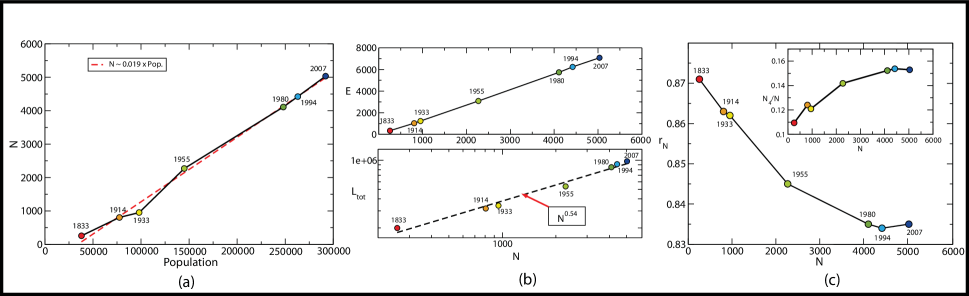
These results highlight the peculiarity of an area where the population remains almost uniformly distributed in space, and no single urban center stands out over the others. In order to remove the demographic component and focus solely on the road network evolution, we adopt the number of nodes as the natural internal clock of the system, and we study the change of the network properties as a function of . The number of links grows almost linearly with (Fig. 2b, top), showing that the average node degree is roughly constant over time, except for a slight increase from to when going from 1914 to 1980. In the bottom panel of Fig. 2b we report the total network length (where denotes a network edge, and its length) which increases over time as
| (1) |
where . Consequently, the average length of links decreases as . This result is consistent with the evolution of almost regular two-dimensional lattices with a peaked link length distribution Barthelemy:2008 ; Barthelemy:2011 . Indeed, if we consider a uniform distribution of nodes with density on a two-dimensional surface, the typical link length will be of order , which implies that the total length grows as , thus giving a value .
Additional information on the structure of the road network can be obtained by looking at the quantity Courtat:2011
| (2) |
where denotes the number of nodes of degree (notice that we do not take into account nodes having in the sum, since these are not usually considered as proper junctions). This quantity measures the relative abundance of dead ends (corresponding to ) or T-shaped intersections (), so that a small value of indicates a dominance of junctions and reveals the presence of a large amount of grid-like patterns. Conversely, the value of is closer to if the network has numerous T-shaped crossings and dead ends. The plot of versus (Fig. 2c) displays a steady decrease from at year to at year , consistent with an increase of the percentage of four-ways crossings from at year to at year . Recent studies have shown that the abundance of T-shaped crossings seems to be typical of self-organised or ‘organic’ urban networks, like those of Venice or Cairo Cardillo:2006 , while the grid-like layout is particular to cities whose shapes are the result of large-scale top-down planning efforts Courtat:2011 , like Barcelona or New York. Consequently, one would conclude that what we are observing here is the evolution from an initial self-organised system to a rationally planned urban network. However, the Groane area at was actually a fully rural, not urban-organic network, and the successive evolution up to year has never witnessed any large-scale planning whatsoever. We therefore interpret the result of Fig. 2c as the signature of an evolution from a ‘pre-urban’ condition, with the dominance of dead-ends and junctions typical of rural centres in the very early stages of growth (i.e. still constrained by the radial convergence of major roads), to an increasingly mature ‘urban’ state, in which the network expands on a relatively unconstrained land, further away from the dense radial system of original centres. At that later urban stage the dominance of the junctions grid-like pattern does not result from large-scale planning, but from a piecemeal urbanisation, made of a multitude of small-scale, plot-based, scarcely coordinated developments in time, i.e. a substantially self-organised territorial order.
Evolution of cells: towards homogenisation.
Road networks are planar graphs consisting of a series of land cells surrounded by street segments. The statistics on the area and the shape of cells can be used to distinguish regular lattices from heterogeneous patterns. In particular, it has been recently observed that for Dresden (Germany)Lammer:2006 and for a simple model of road networks Barthelemy:2008 , the cell area distribution is a power law
| (3) |
with an exponent very close to the value . This value of can be explained in terms of a lattice constructed on a set of nodes with density fluctuations Barthelemy:2011 . In Fig. 3a we report the distribution of the cell size in the Groane area at , which is indeed a power law with the same exponent . However, the exponent changes in time, as reported in the inset: it takes a value at year and converges towards as the network grows. Because a larger exponent indicates a higher homogeneity of cell areas, we are thus witnessing here a process of homogenisation of the size of cells. Accordingly, the relative dispersion of cell areas (where and are the average and the standard deviation of , respectively) decreases from at year to at year , indicating that the variance of the distribution becomes smaller as increases.
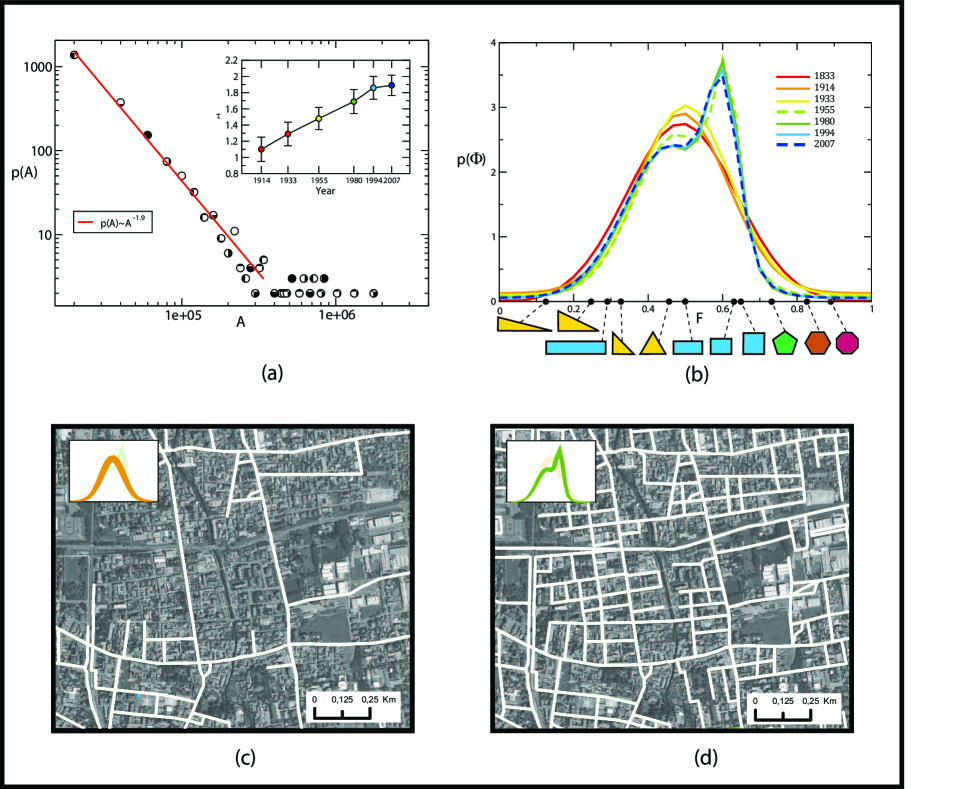
The diversity of the cell shapes can be quantitatively characterised by the so-called shape factor , defined as the ratio between the area of a cell and the area of the circle of diameter circumscribed to the cell Haggett:1969 . The value of the shape factor is in general higher for regular convex polygons, and tends to when the number of sides in the polygon increases. The distributions reported in Fig. 3b clearly reveal the existence of two different regimes: before the distributions are single-peaked and well approximated by a single Gaussian function with an average of about and a standard deviation of . Conversely, after the distributions of the shape factor display two peaks and can be fitted by the sum of two Gaussian functions. The first peak coincides roughly with the one observed before , while the second peak, centred at , signals the appearance after of an important fraction of regular shapes, such as rectangles with sides of similar lengths. In Fig. 3c-d we show the cell shapes at different times (before and after 1) which visually confirm the findings of Fig. 3. The decrease in the relative dispersion and the increase in the fraction of regular shapes suggest that the network undergoes an evolution towards homogenisation. This appears to result from a combined process that exhibits two clear patterns: i) the fragmentation of larger cells of natural land into smaller ones, then heading towards urbanisation by medium-large manufactures or services, and ii) the mostly residential urbanisation of peri-urban natural land in successive rings around the historical urban centres. In particular, this latter pattern explains the emergence of more regularly shaped cells after the Second World War. As urbanization took place increasingly further from historical main roads, residential blocks became less constrained by the triangular shape defined by those roads and, as a result, increasingly followed a regular rectangular shape. This regular shape is in fact the most efficient way of subdividing land for urbanization, reflecting the inner organization of the block into equally regular rectangular plots. This grid-like layout tends to be applied extensively when local constraints, like main roads converging into a village, do not force the development along different patterns (for example T-shaped junction dominated) Ben-Joseph:2005 .
Properties of new links: elementary processes of urbanisation.
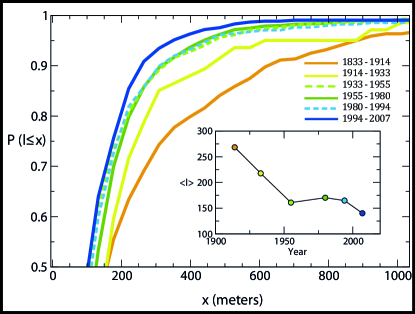
Road networks grow by the addition of new streets (links) and new junctions (nodes). We focus here on the properties of new links by looking at their length and centrality. In Fig. 4 we show the cumulative distribution of the length of new links according to the time-section in which they appeared first. The inset shows that the average length of new links steadily decreases over time, as expected from the general considerations of land fragmentation reported above. More precisely, we consider, at each time , the length value such that of new links at time are shorter than (i.e. such that ). We notice that the value decreases in the period 1833-1933 from meters down to meters, while no sensible variation is observed from 1933 to 1994, even if the network keeps growing. In the last period, i.e. from 1994 to 2007, we observe another decrease of from to meters. In addition, the relative dispersion of the length of the new links is almost constant and of order one, and the distribution does not vary too much after 1955. This phasing fits well with the historical development outlined in the introduction where during the rural and early-urban phase up to the second world war we observe the passage to an urban state that is then maintained along the core urbanisation age in the urban-industrial period until the 1980s, followed by a different post-industrial, metropolitan regime.
The nature of the growth process can be quantitatively characterised by looking at the centrality of streets. Among the various centrality indices available for spatial networks, we use here the betweenness centrality (BC) Freeman:1977 ; Crucitti:2006 ; Porta:2006 , which is one of the measures of centrality commonly adopted to quantify the importance of a node or a link in a graph. Given the graph at time , the BC of a link is defined as
| (4) |
where is the number of shortest paths from node to node , while is the number of such shortest paths which contain the link . The quantity essentially measures the number of times a link is used in the shortest paths connecting any pair of nodes in the network, and is thus a measure of the contribution of a link in the organisation of flows in the network. In order to evaluate the impact of a new link on the overall distribution of the betweenness centrality in the graph at time , we first compute the average betweenness centrality of all the links of as:
| (5) |
where is the betweenness centrality of the edge in the graph . Then, for each link , i.e. for each newly added link in the time window we consider the new graph obtained by removing the link from and we denote this graph as . We compute again the average edge betweenness centrality, this time for the graph . Finally, the impact of edge on the betweenness centrality of the network at time is defined as
| (6) |
The BC impact is thus the relative variation of the graph average betweenness due to the removal of the link . We have measured this quantity for the different times-section and we report the results in Fig. 5. Remarkably, the distribution of displays two well-separated peaks (Fig. 5d). The importance of the first peak tends to increase in time while the second peak decreases, until they mostly merge into one single peak in the last time-section (1994-2007). In order to understand the nature and the evolution of the two peaks, we focus on the geographical location of new links with different BC impact.
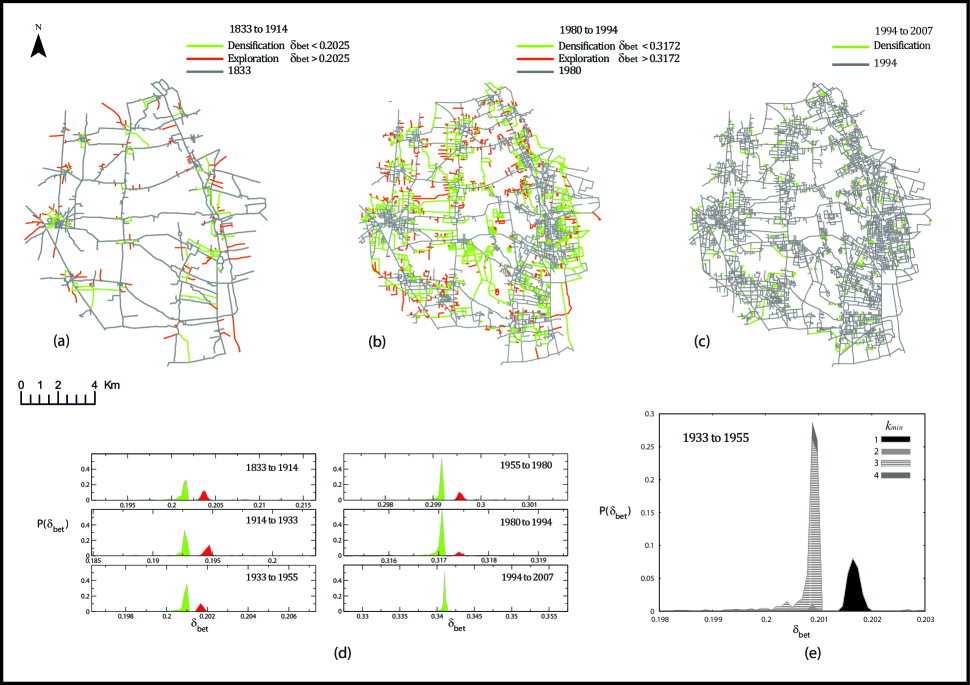
In Fig. 5a-c we report, respectively, the map of the network at year , year and year . We have coloured in green the links whose centrality impact belongs to the left peak, and in red the links whose corresponds to the right peak. The new links are divided into two classes: green links (small , left peak) tend to bridge already existing streets, while red links (large , right peak) are usually dead-ends edges branching out of existing links, generating a new crossing and splitting the original link into two road segments. In order to better characterise the two classes of edges we compute , i.e. the minimum of the degrees of both endpoints of a new link , and we then consider, for each value of , the relative abundance of new links for which is equal to , respectively. We plot the results in a gray–scale stacked chart (see Fig. 5e) for the network at year (the plots for the other networks are similar). The analysis of confirms that the links belonging to different peaks have distinct qualitative features: links in the right peak have , while links in the left peak have . The distribution of BC impact thus suggests that the evolution of the road network is essentially characterised by two distinct, concurrent processes: one of densification (green links, left peak, i.e. lower impact on centrality, ) which is responsible for the increase of the local density of the urban texture, and one of exploration (red links, right peak, higher impact on centrality, ) which corresponds to the expansion of the network towards previously non-urbanised areas. At a closer sight, these two patterns tend in many cases to appear in a temporal sequence, the former acting in preparation for the latter, i.e. exploration being the first phase of a cycle of urbanisation then completed by a second phase of densification. Obviously, since the amount of available land decreases over time, at earlier time–sections (such as in the year ) the fraction of exploration is higher, while in the ’s it becomes smaller until it almost disappears in 2007. The only remaining peak mostly corresponds to densification with new links having .
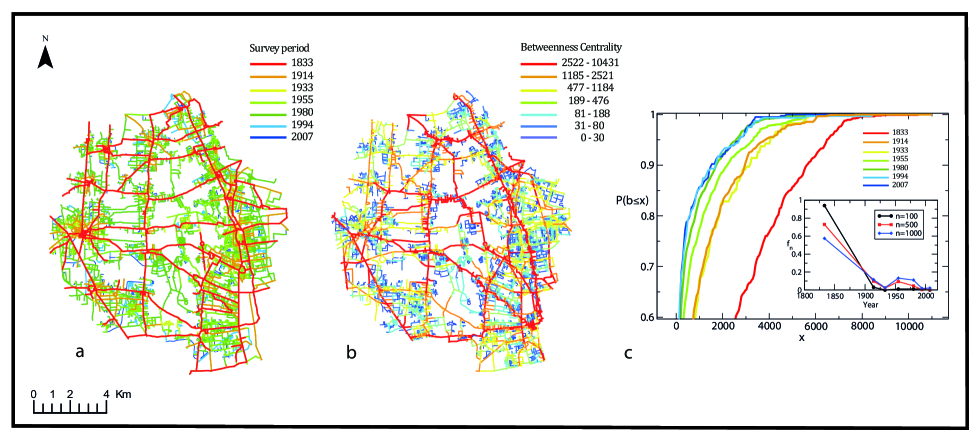
We finally focus on another aspect of the evolution of street centrality, namely the relation between the age of a street and its centrality. In Fig. 6a we display the links of the network in with a color code depending on their age, and in Fig. 6b we report their BC. A simple visual inspection shows that highly central links usually are also the oldest ones. In particular, the links constructed before have a much higher centrality than those added at later time–sections. More precisely, the seven curves in panel Fig. 6c report the cumulative distribution of the BC computed on the network in for the links added at the different times. This is defined as the probability that a link, appearing at a certain time-section, has a value of betweenness centrality smaller than or equal to in the final network in . We notice that the historical structure of the oldest roads mostly coincide with the highly central links at year . In particular, the inset of Fig. 6c indicates that more than of the most central links in 2007 (and almost of the top ) were already present in 1833. This result reveals that a ”backbone” of highly–central routes, that have framed the Groane area in the rural economy of the pre-industrial period, has been driving the development of the area across two centuries of industrialisation, urbanisation and de-industrialisation up to present days, without any major modification.
Urban morphologists have long observed that streets tend to persist in time much longer than other urban elements like buildings or land-uses Mouton:1989 . Our results confirm that at another level, that of the topology of the street network, the persistence of roads over time appears to be due to their multifaceted impact on the urban form at different scales by deeply informing factors like accessibility to space and resources, land ownership and land values, each of these involving different social actors and interests.
Discussion
In this paper we have studied the evolution, over almost two centuries, of the street network in a large large area close to Milan (Italy). Such an area is of interest for urban studies because it displays an important process of urbanisation. Urbanisation is reflected in the growth of the road network and displays different speeds at different times, with a fast increase occurring between 1933 and 1994. Our results reveal a quantitative signature of urbanisation on the evolution of the shape and size of land cells, which become more homogeneously distributed and square-shaped. Simultaneously, we observe a general trend towards a larger number of 4-way junctions, as opposed to an earlier structure of dead ends and 3-way junctions. These structural transformations appear to be the result of the interplay between two concurrent dynamics, namely densification and exploration. While exploration is typical of the earliest historical periods of urbanisation, densification predominates in the latest.
We were also able to quantitatively characterise the stability of the structure of most central streets over time. For instance, the most central streets in the network in largely coincide with the oldest ones. Central roads appear to therefore constitute a robust spatial backbone which remains stable over time, and characterises the evolution of the road system as a continuous expansion and reinforcement of pre-existing structures rather than as a sharp switch towards radically new configurations. The kind of evolution that we are witnessing in the Groane area is therefore certainly massive in overall quantitative terms, reflecting unparalleled changes in the pace and nature of economic, technological and social order during the transition from a mainly agricultural to a post-industrial age; however, it is still an organic form of evolution that builds at each step on the achievements of the previous, confirming in the long term a resilient structure that tends to persist in time all over the urbanisation process. These findings quantitatively support the hypothesis that spatial systems undergoing fine-grained forms of evolution tend to exhibit simple local dynamics of change, continuously expanding upon pre-existing structures, a morphogenetic behaviour that they appear to share with many living organisms and other natural systems Alexander:2003 .
The results of this research, including the existence of the two main dynamics of exploration and densification, together with the persistence over time of a structural backbone made of highly central streets, cannot be extended to the generality of urbanisation processes unless supported by further investigation of cases in different geographical and economic positions. An important point in our view is that this study provides quantitative results which can be confirmed (or falsified), a critical aspect in Science.
Methods
Temporal Network Data.
The area under study covers and includes urban centers within municipalities that have developed along two main radial paths, connecting Milan to Como and Milan to Varese. We sampled seven street networks primal graphs at different times, where the street junctions are represented as nodes and the roads (or streets) are the links of the networks. We used a mixed procedure of ArchMap tool extensions and python scripts operating over a geo-database. First, the street network has been drawn in vectorial format on the basis of a collection of historical areal images and historical maps imported in the ArcGIS10 platform. Sources used for each temporal steps are reported in Table . The images have been imported as a .geotif extension, and all the layers has been projected using the coordinate system Monte Mario (Rome), Italy zone and Transverse Mercator projection. The first geo-referencing (alignment of different images) has been performed on the basis of historical buildings and landmarks such as paths and roads. The redraw operation was done using an ad-hoc python script for creating the node layers representing the street junctions. The second geo-referencing operation has been performed over the street junctions using the “spatial analyst tool” with the “spatial join” utilities provided in ArchMap10. Subsequently, for all time layers, using an ad-hoc python script we produced the weighted adjacency lists that has been used for the network analysis, the weight correspond to the real length of the street. We denote by the obtained primal graph at time , where and are respectively the set of nodes and links at time . The number of nodes at time is then and the number of links is . Using common definitions, we thus have and , where and are respectively the new street junctions and the new streets added in time to the network existing at time .
References
- (1) Mumford, L., The City in History (Harcourt Brace, New York, 1961).
- (2) McDonald, R. I., Green, P., Balk, D., Fekete, B. M., Revenga, C., Todd, M., Montgomery, M., Urban growth, climate change, and freshwater availability Proc. Natl Acad. Sci. (USA), 108, 6312-6317 (2011).
- (3) Dye, C., Health and Urban Living Science 319, 766-769 (2008).
- (4) Glaeser, E., Cities, Productivity, and Quality of Life Science 333, 592-594 (2011).
- (5) Barnes, I., Duda, A., Pybus, O.G., Thomas, M.G., Ancient urbanization predicts genetic resistance to tuberculosis. Evolution 65, 842-848 (2011).
- (6) UN Population division, http://www.unpopulation.org
- (7) Newman, P., Kenworthy, J., Sustainability and Cities: Overcoming Automobile Dependence (Island, Washington, DC, 1999).
- (8) UN-Habitat The challenge of slum, Global Report on Human Settlements (Earthscan, London and Sterling, VA, 2003).
- (9) UN-Habitat State of world’s cities 2010/11, bridging the urban divide (Earthscan, London and Sterling, VA, 2008).
- (10) Hardoy, J. E., Mitlin, D., Satterthwaite, D., Environmental Problems in an Urbanizing World (Earthscan , London, 2001).
- (11) Angel,S., Sheppard, S. C., Civco. D. L., The Dynamics of Global Urban Expansion (The World Bank, Washington, DC, 2005).
- (12) Hall, P., Modelling the Post-industrial city Future 294-5, 311-322.(1997).
- (13) Seto, K. C., Sánchez-Rodríguez, R., Fragkias, M., The New Geography of Contemporary Urbanization and the Environment Annu. Rev. Environ. Resour. 35, 4.1–4.28 (2010).
- (14) UN-Habitat, Planning sustainable cities. (United Nations Human Settlements Programme, Nairobi, Kenya, 2010).
- (15) Turner, B.L., II, Lambin, E.F., Reenberg, A., The emergence of land change science for global environmental change and sustainability. Proc. Natl Acad. Sci. (USA), 104, 20666–20671 (2007).
- (16) Ramalho, C.E., Hobbs R. J., Time for a change: dynamic urban ecology Trends in Ecology & Evolution, 27, 179–188 (2012).
- (17) Batty, M., The Size, Scale, and Shape of Cities. Science 319, 769-771 (2008).
- (18) Wilson, A. G., Entropy in Urban and Regional Modelling (Pion Press, London, 1970).
- (19) Batty, M., Longley, P. A., Fractal Cities: A Geometry of Form and Function (Academic Press, San Diego, CA, 1994).
- (20) Batty, M., Cities and complexity (The MIT Press, Cambridge, MA, 2005).
- (21) Makse, H. A., Havlin, S., Stanley, H. E., Modelling urban growth patterns Nature 377, 608-612 (1995).
- (22) Salingaros, N., Principles of Urban Structure (Techne Press, Amsterdam, Holland, 2005).
- (23) Taubenböck, H., Esch, T.,Felbier, A., Wiesner,M., Roth,A., Dech, S., Monitoring urbanization in mega cities from space Remote Sensing of Environment 117, 162–176 (2012).
- (24) Marshall, S.,Streets and Patterns (Spon Press, Abingdon, Oxon UK, 2006).
- (25) Southworth, M., Ben-Joseph, E., Streets and the Shaping of Towns and Cities (Island Press, Washington DC. USA, 2003).
- (26) Haggett, P., Chorley, R.J., Network analysis in geography. (Edward Arnold, London, 1969).
- (27) Latora, V., Marchiori, M., A measure of centrality based on network efficiency. New Journal of Physics 9, 188 (2007).
- (28) Xie, F., Levinson, D., Measuring the structure of road networks. Geographical Analysis 39, 336–356 (2007).
- (29) Barthelemy, M., Spatial Networks. Physics Reports, 499, 1–101 (2011).
- (30) Lammer, S., Gehlsen, B., Helbing, D., Scaling laws in the spatial structure of urban road networks. Physica A, 363, 89–95 (2006).
- (31) Cardillo, A., Scellato, S., Latora, V., Porta, S., Structural properties of planar graphs of urban street patterns. Phys. Rev. E 73, 066107 (2006).
- (32) Bettencourt, L.M.A., Lobo, J., Helbing, D., Kuehnert, C., West, G.B., Growth, innovation, scaling, and the pace of life in cities. Proc. Natl Acad. Sci. (USA), 104, 7301–7306 (2007).
- (33) Bettencourt, L.M.A., West, G.B., A unified theory of urban living. Nature, 467, 912–913 (2010).
- (34) Balcan, D., Colizza, V., Goncalves, B., Hu, H., Ramasco, J., Vespignani, A., Multiscale mobility networks and the spatial spreading of infectious diseases. Proc. Natl Acad. Sci. (USA), 106, 21484–21489 (2009).
- (35) ”Porta, S., Latora, V.,Wang, F., Rueda, S., Strano, E., Scellato, S., Cardillo, A., Belli, E, Cardenas, F., Cormenzana, B., Latora, L. Street Centrality and Location of Economic Activities in Barcelona. Urban Studies, Nov. 10 2011, 0042098011422570 (2011).”
- (36) Hanson, S., Giuliano, G. (Eds), The geography of urban transportation. (Guilford Publications, New York, NY, 2004).
- (37) Xie, F., Levinson, D. Topological evolution of surface transportation networks. Computers, Environment and Urban Systems 33, 211–223 (2009).
- (38) European Commission, Joint Research Centre. Urban sprawl in Europe, The ignored challenge. EEA Report 10, (2006).
- (39) Turri, E., La Megalopoli Padana (Marsilio, Venezia, IT, 2000).
- (40) M. Barthelemy, A. Flammini, Modeling urban street patterns. Phys. Rev. Lett., 100, 138702 (2008).
- (41) Courtat, T., Gloaguen, C., Douady, S., Mathematics and morphogenesis of cities: A geometrical approach. Phys. Rev. E, 83, 036106 (2011).
- (42) Ben-Joseph, E., The Code of the City: Standards and the Hidden Language of Place Making (MIT Press, Cambridge, MA, 2005).
- (43) Freeman, L.C., A set of measures of centrality based on betweenness. Sociometry, 40, 35–41 (1977).
- (44) Crucitti, P., Latora, V., Porta, S., Centrality measures in spatial networks of urban streets. Phy. Rev. E, 73, 036125 (2006).
- (45) Porta, S., Crucitti, P., Latora, V., The network analysis of urban streets: a primal approach. Environment and Planning B: Planning and Design 33, 705–725 (2006).
- (46) Alexander, C., The Nature of Order: an essay on the art of building and the nature of the universe. Book 2, The Process of Creating Life (Oxford University Press, Oxford, UK, 2003).
- (47) Vernesz-Mouton, A., Built for change: neighborhood architecture in San Francisco (MIT Press, Cambridge, MA, 1989).
Acknowledgements.
MB thanks R. Morris for useful comments and the Morphocity group (P. Bonnin, P. Bordin, C.-N. Douady, S. Douady, J.-P. Frey, P. Vincent) for stimulating discussions. ES and SP are grateful to the Laboratory of Territorial Planning at DIAP, Polytechnic of Milan (S. Serini, A. Benedetti L. Terlizzi, G. Graj and Prof. P. L. Paolillo) for providing cartographic material and vectorial street layers. They also thank A. Venerandi for his help in the first phase of this study.Author contributions
All the authors have equally contributed to the design of the experiment, to the analysis and interpretation of the results and to the preparation of the manuscript.
Additional Information
Competing financial interests
The authors declare no
competing financial interests.