Radiation Pressure and Mass Ejection in -like States of GRS 1915+105
Abstract
We present a unifying scenario to address the physical origin of the diversity of X-ray lightcurves within the variability class of the microquasar GRS 1915+105. This ‘heartbeat’ state is characterized by a bright flare that recurs every seconds, but the profile and duration of the flares varies significantly from observation to observation. Based on a comprehensive, phase-resolved study of heartbeats in the Rossi X-ray Timing Explorer archive, we demonstrate that very different X-ray lightcurves do not require origins in different accretion processes. Indeed, our detailed comparison of the phase-resolved spectra of a double-peaked oscillation and a single-peaked oscillation shows that different cycles can have basically similar X-ray spectral evolution. We argue that all heartbeat oscillations can be understood as the result of a combination of a thermal-viscous radiation pressure instability, a local Eddington limit in the disk, and a sudden, radiation-pressure-driven evaporation or ejection event in the inner accretion disk. This ejection appears to be a universal, fundamental part of the state, and is largely responsible for a hard X-ray pulse seen in the lightcurve of all cycles. We suggest that the detailed shape of oscillations in the mass accretion rate through the disk is responsible for the phenomenological differences between different -type lightcurves, and we discuss how future time-dependent simulations of disk instabilities may provide new insights into the role of radiation pressure in the accretion flow.
Subject headings:
accretion, accretion disks — black hole physics — X-rays: individual (GRS 1915+105) — X-rays: binaries1. INTRODUCTION
As one of the brightest and most variable sources in the X-ray sky, the microquasar GRS 1915+105 is an excellent case study for the investigation of evolving accretion flows. Discovered in 1992 by Castro-Tirado et al., the black hole has been in outburst for over 17 years and has become famous for its superluminal jets (Mirabel & Rodríguez, 1994), its bizarre X-ray variability (Belloni et al. 2000, hereafter B00; Klein-Wolt et al. 2002; Hannikainen et al. 2005), and its disk-jet interactions (Fender & Belloni 2004; Fender, Belloni, & Gallo 2004; Neilsen & Lee 2009; Neilsen, Remillard, & Lee 2011a).
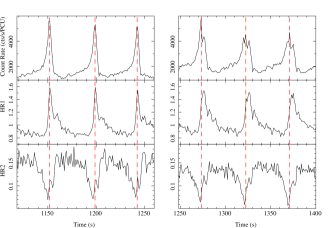
Of its many classes of X-ray variability, the best studied are the state, which produces steady optically thick jets (see, e.g. Dhawan et al. 2000; Klein-Wolt et al. 2002), the state, a wild 30-minute cycle with discrete ejection events (Mirabel et al., 1998), and the state, which is affectionately known as the ‘heartbeat’ state for the similarity of its lightcurve to an electrocardiogram (see Figure 1). The -type cycle consists of a slow rise followed by a short bright pulse, repeating with a period of roughly 50 s (Taam, Chen, & Swank 1997; B00).
After nearly two decades of X-ray monitoring of GRS 1915+105, it is clear that its remarkable diversity of X-ray states is also reflected in the states themselves. Indeed, even in their original paper on these variability classes, B00 divide the class into four sub-categories that differ in hardness and noise properties. Furthermore, some observations may exhibit characteristics of multiple states (e.g. -type variations; Neilsen, Petschek, & Lee 2011b), and various instances of a single state may even differ in their large-scale variability patterns. For example, Massaro et al. (2010, hereafter M10) recently analyzed a long BeppoSAX observation of GRS 1915+105 in the state and reported significant changes in the lightcurve shape: the number of pulses or peaks per cycle ranged from one to at least four. These pulses can be separated by 10 seconds or more, and the later peaks are typically harder (Taam et al., 1997; Paul et al., 1998).
In the hopes of uncovering direct evidence for the origin of these luminous -type pulses, we performed the first joint Chandra/RXTE phase-resolved spectral analysis of an observation of GRS 1915+105 in the state (Neilsen et al., 2011a). Using the Chandra gratings (Canizares et al., 2005), we showed for the first time that changes in the broadband X-ray spectrum drive physical changes in the accretion disk wind on time scales as short as 5 seconds, and that this wind is sufficiently massive to cause state transitions in the disk. Based on RXTE spectra, we argued that radiation pressure plays several key roles in the accretion disk, from driving the observed limit cycle via the Lightman-Eardley instability (a.k.a. radiation pressure instability; Lightman & Eardley 1974; Belloni et al. 1997; Janiuk et al. 2000) to literally pushing the inner edge of the accretion disk away from the black hole (a local Eddington limit; Fukue 2004; Heinzeller & Duschl 2007; Lin, Remillard, & Homan 2009) until the global Eddington limit is reached and the disk is evaporated or ejected at the maximum accretion rate (see also Janiuk & Czerny 2005). For this last point, we argued that the second peak in our double-peaked lightcurves could be explained as bremsstrahlung emitted when the ejected gas collides with the corona.
But what is the significance of these results when some instances of the state only have a single peak (M10)? That is, if there is no “second peak” in the lightcurve, is mass ejection still required to explain the X-ray oscillation? Are we to understand different variations of the -like cycles as driven by the same physical processes or as producing similar lightcurves by coincidence? In this paper, we begin to address the remarkable diversity within the variability classes of GRS 1915+105, with a comprehensive phase-resolved study of all the heartbeat-like states in the RXTE archive.
We describe the observations, data analysis, and phase-folding in Section 2. In Section 3, we perform a detailed comparison of the timing and spectral behavior of single- and double-peaked states. In Section 4, we interpret our results as clear evidence that a single physical scenario may produce a wide variety of lightcurves, and we consider the exact origin of the variations observed by Massaro et al. (2010).
2. OBSERVATIONS AND PHASE FOLDING
Since its launch in 1995 (Jahoda et al., 1996), RXTE has observed GRS 1915+105 roughly twice a week, for a total of over 1600 pointings as of the original writing of this paper. In this paper, we will focus exclusively on the data from the Proportional Counter Array (PCA), which covers approximately 2–60 keV. We extract 1-second normalized lightcurves from the binned data modes in three energy channels: keV, keV, and keV. The lightcurves are normalized using the PCA lightcurve of the Crab nebula. That is, for each PCU, we renormalize the mission-long Crab lightcurve to count rate values 1100, 1140, and 330 counts per second for channels and respectively. This roughly corresponds to the raw count rate of PCU2 around MJD 52000. We then apply these same normalizations to the GRS 1915+105 count rates so that the intensity scale is the same for all observations. We also produce two hardness ratios: HR1 and HR2=
In order to identify state observations, we examined 1-second lightcurves and color-color diagrams (CD) for all observations of GRS 1915+105. We selected observations with regular or quasi-regular bursts of the appropriate shape, duration, and CD by visual inspection. This task can be rather tricky since there are variations within the heartbeat state (Section 1) as well as strong resemblances between the class and some portions of the and classes; our analysis may include some cycles from these classes. However, the fact that our phase-folding method can be used for all these quasi-regular cycles is indicative of the physical robustness of our results. We show samples of the lightcurves and hardness ratios for two typical (long) observations in Figure 1 (RXTE observations 40703-01-02-00 and 60405-01-02-00 on the left and right, respectively). The oscillation is obvious in all panels. Inspection of these data and our ensemble of lightcurves reveals the same variations noted by M10, namely that the number of strong peaks in the lightcurve changes over time scales of days or longer, as do the durations of the pulses and the time delays between them. As we will see later that there is likely a continuum of lightcurve shapes, we will not devote any time here to detailed phenomenological categorizations of these profiles.
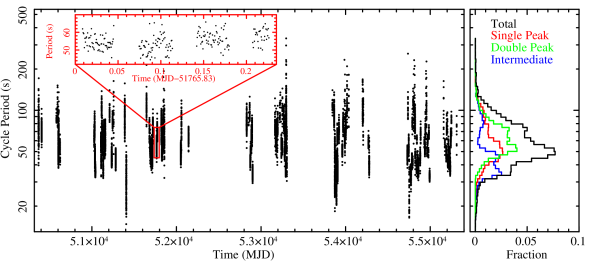
In Neilsen et al. (2011a), we showed that we can very accurately characterize the physics of this oscillation by phase-folding the individual cycles, which takes into account the variable oscillation period. In other words, we stretch or compress and then combine all the individual cycles in a given observation, and study the spectral conditions at each part of the cycle. We determine the start times of each cycle by means of an iterative cross correlation method that is described in more detail in Neilsen et al. (2011a). Briefly, we use cross-correlations to identify the main peak in the count rate for each cycle, and then define the times of peak count rate as phase With this analysis, we measure 10068 peak times in 242 observations. For reference, we plot the resulting cycle periods (i.e. the distance between successive times of ) in Figure 2. It is evident from this figure that typical periods are seconds, although some single cycles may last over 300 seconds. Within a given observation, there is a fair amount () of cycle-to-cycle scatter in the period, but the period is usually very stable around the mean (see inset, Fig. 2).
Once we have defined a phase ephemeris for all 242 observations, we create phase-folded lightcurves for each, and then we identify them as single-peaked, double-peaked, or as intermediate cases. Observations may be classified as intermediate if there is substantial noise (e.g. if the observation only includes a few cycles) or if the cycles have unusual shapes or strong period variability (like -type cycles), so that it is difficult to reliably distinguish two individual pulses from a single pulse. Of the 242 observations included here, we classify 101 as having double-peaked cycles, 77 as single-peaked, and the remaining 64 as intermediate cases. Because there is an inherent difficulty in deciding whether structure in the lightcurve is noise or a physical peak, there is an uncertainty in these numbers of about 10–15 (estimated by repeating the classification). This uncertainty has a negligible effect on the numbers presented in this section and no effect on the subsequent spectroscopy our physical interpretation.
There are some statistical differences in the period between cycles with different numbers of peaks. The right panel of Figure 2 shows that single- and double-peaked cycles have similar periods, at s and s, respectively, while intermediate cycles are generally shorter, with an overall mean of s. The uncertainties represent the sample standard deviations; the standard errors of the mean are s. At very short periods, the intermediate cycles show a bimodal period distribution, which is reminiscent of the state (B00) or the irregular bursts studied by Yadav et al. (1999). However, we will see that these intermediate cases exhibit similar spectral behavior to single- and double-peaked cycle types, so they are unlikely to represent a completely different physical phenomenon.
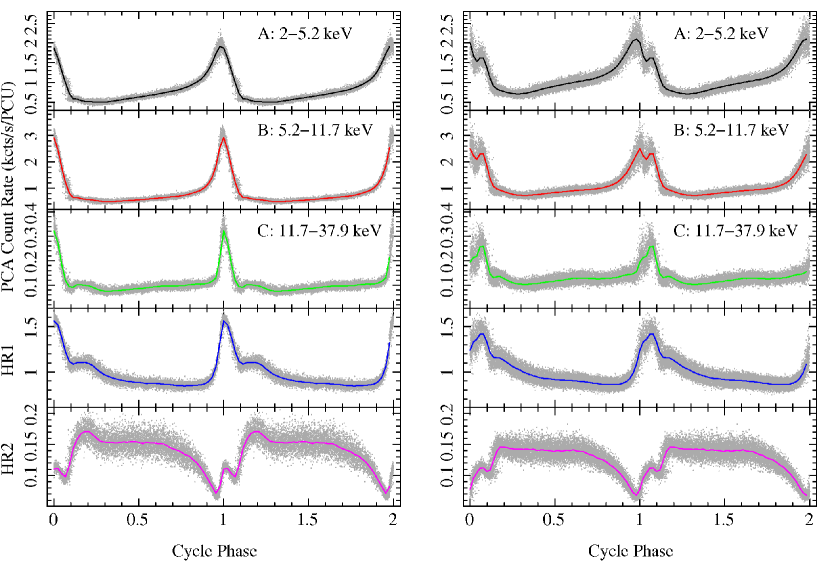
Figure 3 shows the phase-folded lightcurves for the single- and double-peaked observations illustrated in Figure 1. The average phase-folded lightcurve profiles, shown as solid lines, are superimposed on the individual cycles from these same observations shown as gray points. There are a total of 204 cycles and 265 cycles on the left and right, respectively. The scatter is limited and it is clear that within an observation the individual cycles have the same profile. On the other hand, it is also clear that heartbeats can differ substantially from one observation to the next (i.e. in terms of the number of peaks or pulses). Building on our prior study of double-peaked cycles (Neilsen et al., 2011a), we focus in this paper on a comparison between single-peaked cycles and double-peaked cycles, and the question: can these two cycle types be produced by the same mechanism? In other words, does the single pulse correspond to the first (soft) pulse of a double-peaked cycle, the second (hard) pulse, a combination of the two pulses, or is it completely different?
3. THE SINGLE PULSE
In this section, based on timing analysis and broadband spectroscopy, we develop a case that the single pulse in single-peaked cycles corresponds to the second, hard pulse in double-peaked cycles. As such, our results will indicate that the physical processes responsible for the production of this hard pulse are active in all -like cycles. In other words, these processes are fundamental to the heartbeat state.
3.1. Folded Lightcurves and Timing Analysis
The first indications that the single pulse is analogous to the hard pulse come from the lightcurves and phase-folded lightcurves in Figures 1 and 3. In these plots, HR2 rises sharply from its minimum value around , giving the appearance of a local maximum. The local maximum in HR2 coincides with the maximum value of HR1 in both single-peaked and double-peaked cycles. This phase of “maximum spectral hardness” occurs during the main pulse in single-peaked cycles, while it is very close to the second pulse when there are two peaks in the cycle.
An alternative indication of this same phenomenon is the delay between various maxima in the hardness ratios and in the hard and soft X-ray lightcurves. For example, consider that in a double-peaked cycle, HR1 peaks at the same time as the -band lightcurve, but after the band, while all three quantities are synchronized in single-peaked observations.
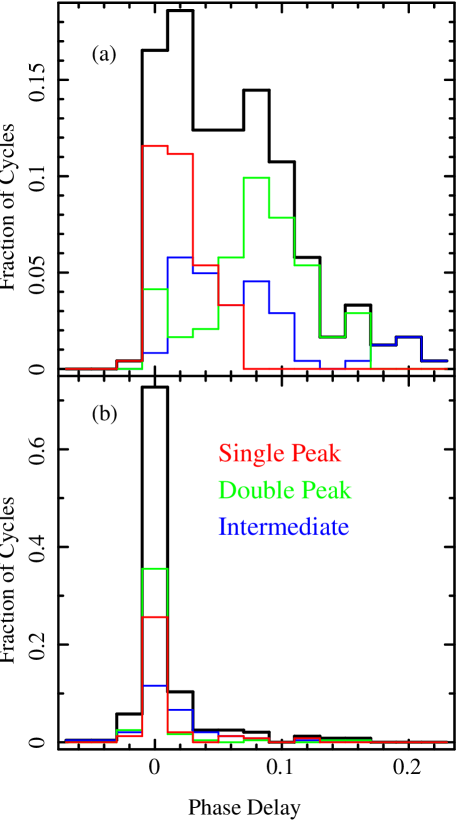
The delays between these maxima are easily quantified from the phase-folded lightcurves, and we present the phase delay distributions in Figure 4. It should come as no surprise that double-peaked oscillations exhibit a significant delay between the hard and soft X-ray pulses (top panel): , where the uncertainty is the sample standard deviation. As the average period of these oscillations is seconds, we find that the hard pulse typically follows the soft pulse by seconds. For single-peaked cycles, the delay between the peaks in the and bands is much smaller (consistent with zero): The intermediate cases show a bimodal distribution, apparently including mixed contributions from single-peaked and double-peaked cycles. As suggested above, all cycle types exhibit a very short delay between the maximum of HR1 and the hard X-ray pulse. This delay is for single-peaked cycles, for double-peaked cycles, and for intermediate cases.
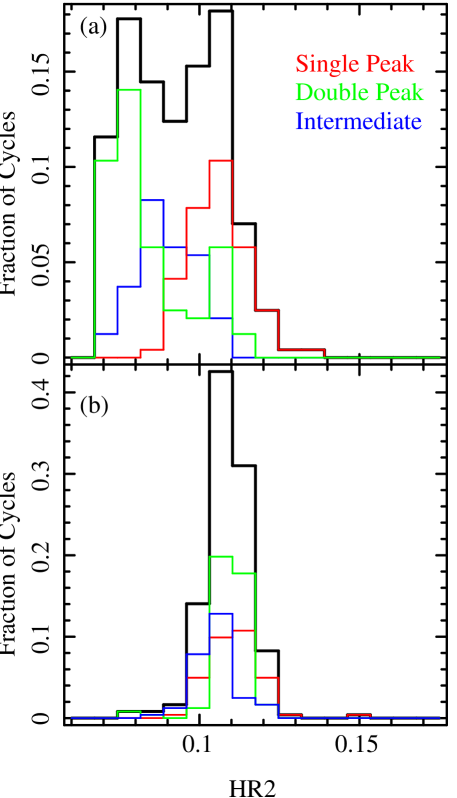
Also relevant are the values of the hardness ratios themselves. In Figure 5 we present the distribution of HR2 at when the count rate is at a maximum (top), and at the maximum of the -band lightcurve (bottom). In general, we see that at , double-peaked oscillations are softer than cycles with a single peak (intermediate cases lie in between the two). This is to be expected if the single pulse corresponds to the hard pulse of a double-peaked cycle. That is, when there are two peaks, our cross-correlation method picks out the brighter, softer first pulse for ; in the absence of the soft pulse (i.e. one pulse only), coincides with the hard pulse. The bottom panel of Figure 5 confirms this conjecture: all cycles have very similar HR2 when the -band flux is maximized. This suggests that a common light source produces a pulse of hard X-rays in every cycle.
Again, the relative timing of the X-ray flux and spectral hardness ratios indicates that the intermediate cases represent a continuum of profiles between single- and double-peaked oscillations. A completely different physical process might be less likely to produce the same timing signatures, so we conclude that at 1-second resolution, the variations in the cycle profile can be explained in the context of two main pulses, one soft and one hard, whose relative strengths, duration, and separation can vary from observation to observation. In Section 3.2, we employ phase-resolved spectra to unify these pulses in a single physical framework.
3.2. Phase-Resolved Spectroscopy
In Neilsen et al. (2011a), we showed that in a double-peaked cycle (RXTE ObsID 60405-01-02-00), the X-ray spectrum of the hard pulse was described very well as the sum of two major components: a disk blackbody and a power-law type component, possibly bremsstrahlung or Comptonized disk emission. Statistically, we could not distinguish between different Comptonization models and bremsstrahlung emission, but all models required a sudden decrease in the electron temperature associated with this component during the hard pulse.
In this section, we ask whether an observation of a single-peaked cycle can be described by the same model with similar phase dependence; we return to the physical interpretation of this model in Section 4. We perform phase-resolved spectroscopy of the single-peaked observation represented in Figures 1 and 3, RXTE ObsID 40703-01-07-00, and compare to our results on the double-peaked cycle in Neilsen et al. (2011a). We implicitly assume that these two observations are representative of single- and double-peaked heartbeats. This assumption is justified by our results in Section 3.1, which demonstrate clear similarities between different observations of a given type of cycle.
Our spectral model consists of interstellar absorption by cold gas (tbabs; Wilms, Allen, & McCray 2000), a hot disk (ezdiskbb; Zimmerman et al. 2005) convolved through a scattering kernel (simpl; Steiner et al. 2009), a Gaussian emission line at 6.4 keV, and a high-energy cutoff (highecut, with functional form for ; we set ). simpl takes a seed spectrum and scatters a fraction of the source photons into a power law, approximating the high-temperature, low optical depth regime of Comptonization. We use highecut to account for curvature in the hard X-ray spectrum, and we prefer simpl to powerlaw because it conserves photons and includes a physically-realistic rollover at low energies. Our method is precisely the same as that reported in Neilsen et al. (2011a): we extract phase-resolved spectra and responses and, applying the model described above, we fit the emission from 3–45 keV. All spectral fitting is done in ISIS (Houck & Denicola, 2000; Houck, 2002). We assume a distance and inclination of kpc and (Fender et al., 1999); we fix cm-2 (Lee et al. 2002 and references therein). Overall, the model provides an excellent description of the data, with a reduced
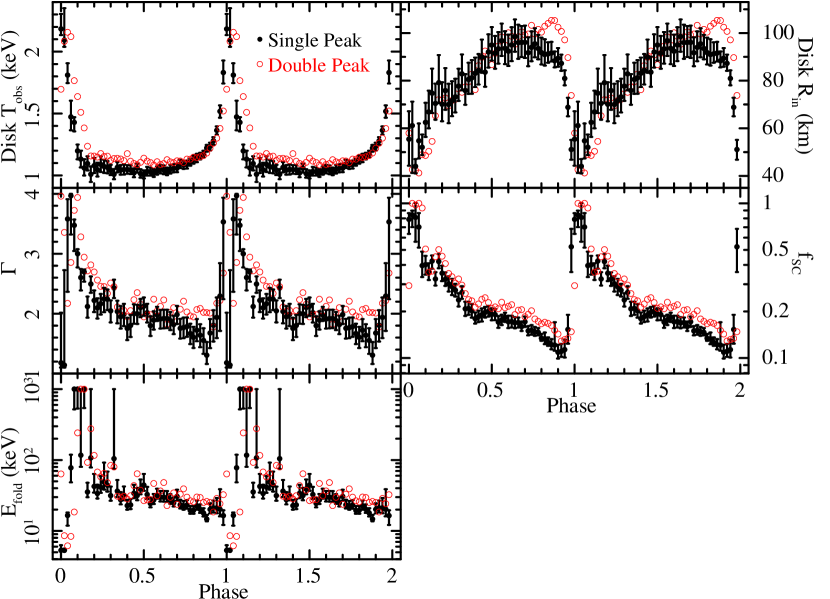
The resulting fit parameter values for our single-peaked oscillation are shown in black in Figure 6. The maximum observed temperature in the disk, is mostly constant near 1.1 keV throughout the cycle but spikes to keV at While the disk temperature hovers around 1.1 keV, the inner disk radius rises steadily from km to km, but then turns over and plummets quickly to km (we use a color-correction factor appropriate for high luminosity; J. Steiner, private communication). The simpl photon index , the scattering fraction and the high-energy cutoff all decrease steadily for most of the cycle, from roughly 4 to 1.5, 0.9 to 0.1, and 500 keV to 30 keV, respectively. Near and rise sharply, but (i.e. the electron temperature) dips to 5 keV. During this brief dip, there is also weak evidence of a coincident dip in
For comparison, we overplot our (Neilsen et al., 2011a) measured parameters for the double-peaked oscillation. Given the differences in the lightcurves (Figure 1), the similarity of the spectral fits is striking. The most important difference is a clear phase shift: a given feature in a given parameter occurs later in phase in double-peaked cycles. In terms of the parameters themselves, the double-peaked cycle has a slightly higher and flatter baseline in , and the spike is smaller; the disk radius increases for a longer interval relative to the single-peaked cycle. The double-peaked cycle also has a slightly larger photon index, scattering fraction, and electron temperature than the single-peaked oscillation.
Two points from our spectral fits deserve special consideration:
-
1.
It is remarkable that in these two very different cycles, the measured radius of the disk plummets sharply and comes to rest (albeit briefly) at the same value of km. The possibility of a “touchdown” radius is especially interesting given that 40 km is the radius where one expects the peak emission from a thin disk around a maximally-spinning 14 M⊙ black hole (McClintock et al., 2006).
-
2.
Both single-peaked and double-peaked oscillations are marked by a short interval where the scattering fraction approaches 1 and drops to keV, indicating the sudden appearance of an optically-thick population of relatively cool electrons. In double-peaked cycles, this interval corresponds to the hard pulse. In single-peaked cycles, it coincides with the main peak in the lightcurve at This connection confirms the identification of the single pulse as the hard pulse.
On the whole, it is abundantly clear that the same spectral processes are operating in both of these cycles.
4. DISCUSSION
In Section 3, our phase-resolved timing and spectral analysis demonstrated that single-peaked heartbeats should be interpreted as double-peaked cycles with a weak soft pulse, while the brief pulse of hard X-rays is truly fundamental to the cycle. In this section, we consider the origin of these pulses and the implications of their relative variations.
In our detailed phase-resolved spectral analysis of a double-peaked oscillation (Neilsen et al., 2011a), we explored two Comptonization models (simpl and nthcomp; Zdziarski et al. 1996; Życki et al. 1999) and also bremsstrahlung as descriptors of the broadband X-ray emission in the heartbeat state. While these models differ in their physical interpretations, they implied very similar behavior in the inner accretion disk, and all three models required the sudden appearance of a new population of electrons with a temperature of keV during the hard pulse. We argued that this was probably due to the sudden ejection of matter from the disk at very high luminosity (see Janiuk & Czerny 2005 for a theoretical basis).
To produce the waves in that cause the system to exhibit these changes on a cyclic basis, we invoked a global Eddington instability (Lightman & Eardley 1974; Neilsen et al. 2011a). This instability, a class of thermal-viscous instability (Taam et al. 1997; Nayakshin, Rappaport, & Melia 2000), has also been called the radiation pressure instability (RPI; Janiuk, Czerny, & Siemiginowska, 2000; Janiuk & Czerny, 2005), a term we adopt in what follows. We also found a long interval of increasing disk radius at constant temperature, which we argued was an indication of a local Eddington limit in the disk (Fukue, 2004; Heinzeller & Duschl, 2007; Lin et al., 2009). Local Eddington effects can occur in geometrically thin disks when the local vertical component of radiation pressure becomes sufficiently strong to overcome gravity, disrupting the disk interior to some critical radius. In short, when the RPI raises the local accretion rate, the disk responds via the local Eddington process: it maintains a constant temperature but increases its inner radius as it expels a ring of gas at (Fukue, 2004; Heinzeller & Duschl, 2007; Lin et al., 2009). These phenomena (mass ejection and the local Eddington process) reflect the critical importance of radiation pressure in the accretion dynamics of double-peaked heartbeat states.
Furthermore, in the single-peaked cycle we have studied here, the same two effects (i.e. mass ejection and disk evolution via a local Eddington limit) also dominate the spectral evolution. Thus we believe that a single unified model can successfully describe the various lightcurves of -like states, and we identify radiation pressure as the driver of this unified model. From the oscillating mass accretion rate (the radiation pressure instability) to the slow growth of the disk radius (the response of a luminous thin disk to the rising accretion rate) to the ejection or evaporation of the inner disk (a consequence of the sudden final influx of matter), radiation pressure mediates all major aspects of the cycle.
If a common set of accretion processes can describe the range of -like cycles seen in the RXTE archive, we must also address the question: why are some oscillations different than others? If the hard pulse is always observed in the heartbeat state, where does the soft pulse go? To answer this important question, we look to the comparison of our spectral parameters in Figure 6. The salient features of the phase evolution of the disk are the plunge of towards the black hole and the rapid heating of the inner disk. Ultimately, it is the timing of this plunge relative to the spike in the disk temperature that determines the cycle profile and the relative strengths of the two pulses.
But examining the evolution of and in light of the role of radiation pressure in the heartbeat state, we see two puzzles that merit further consideration. First, why are the changes in the disk so catastrophic? In principle, the local Eddington process is reversible, so that could also decrease slowly at roughly constant temperature (e.g. reversible changes tied to the local Eddington limit appear to operate along the flaring branch of Z-sources; Lin et al. 2009). But in the heartbeat state of GRS 1915+105, the symmetry appears to be broken: the disk expands and contracts along vastly different paths in the plane. It is unclear whether this asymmetry is related to mass ejection, a steep gradient in the accretion rate, reaching some energetic limit in the disk, or some other unknown factors, but it is clear that there is significantly more to the behavior of the disk than the local Eddington process.
This brings us to the second puzzle: what causes the local Eddington effect to stop acting on the disk? In Neilsen et al. (2011a), we found that in a double-peaked cycle, grows at roughly constant temperature until when the catastrophic changes take over to begin a new cycle in the disk. But for the single-peaked cycle shown in Figure 6, stops growing and actually decreases slightly from . This momentary plateau in signals the end of the local Eddington process, but here it occurs almost ten seconds before the catastrophic changes in the disk. In other words, the plunge of does not cause the end of the local Eddington effect (although they may coincide, as in double-peaked cycles; Neilsen et al. 2011a). Instead, the end may be controlled by changes in the accretion rate. From our fits, this puzzling phase interval shows a steady plus an increasing indicating an increasing accretion rate. So it may be that a particular range in is required to maintain the local Eddington effect. But without a clear theoretical answer to these questions, we consider a number of intriguing possibilities for the disk evolution.
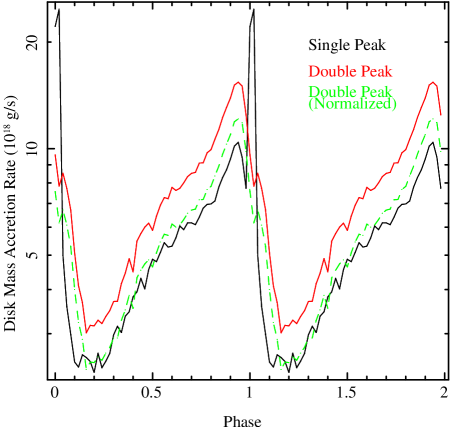
First, we can take the results of our phase-resolved spectroscopy at face value and use our disk parameters to infer the disk mass accretion rates for single- and double-peaked oscillations (Figure 7). We calculate the accretion rate using Equation 4 of Zimmerman et al. (2005). To facilitate a visual comparison, we also show the double-peaked vertically normalized to match the mean value for the single-peaked cycle (green dashed line). The accretion rate is higher on average in the double-peaked cycle ( g s-1 versus g s-1), but the wave is wider and has a smaller absolute amplitude. As an aside, this higher accretion rate implies a larger unstable region in the disk, which could explain why the cycle period is slightly larger for double-peaked cycles (e.g. Nayakshin et al. 2000). Considering the last seconds before/during the collapse of the disk, we see that is sharply peaked in the single-peaked cycle, so that for a fixed phase-averaged accretion rate (i.e. comparing the normalized accretion rates), more matter accretes earlier in double-peaked oscillations.
But this explanation is only valid to the extent that the accretion disk dominates both the mass flux and the X-ray emission. If there are outflows from very small radii111Chandra observations of GRS 1915+105 indicate the presence of winds, but these are typically driven from the outer disk (Miller et al. 2008; Neilsen & Lee 2009; Neilsen et al. 2011a, b). or if there is a second component, e.g. the corona, with a non-zero accretion rate or some difference radiative efficiency, then Figure 7 is only an approximation. We note that our accretion rates are calculated from the disk prior to Compton scattering. For this reason, the contribution of the corona could be further involved if there is significant mass transfer between it and the disk, as suggested by Janiuk & Czerny (2005) and verified by our fits here and in Neilsen et al. (2011a). Janiuk & Czerny (2005) consider several different prescriptions for mass transfer between the accretion disk and the corona (i.e. dependent on the luminosity or the accretion rate in the disk). It could be that single- and double-peaked oscillations transfer mass differently, and that this controls the evolution of the local Eddington process in the disk. As the corona has a stabilizing effect on the disk (Janiuk & Czerny, 2005), it may also be that the coronal geometry differs between different types of cycles, leading to different plunge behavior.
Figure 7 is also only accurate insofar as the disk can be approximated as having a constant radiative efficiency, optical depth, spectral hardening, and a constant/uniform accretion rate (in a given phase bin) in the inner disk. The accuracy of these approximations must be determined from simulations that calculate and fit spectra at each phase of the cycle and compare to the physical behavior of the accretion disk in the simulations. Since Nayakshin et al. (2000) and Janiuk & Czerny (2005) invoke strong variations in the disk viscosity and surface density, it may be that our approximations here are insufficient for a complete understanding of the evolution of the disk. On the other hand, it seems clear that the phase dependence of the accretion rate (whether as shown in Figure 7 or otherwise) is probably the primary factor in determining the strength and duration of the X-ray pulses, and may in some yet-to-be-determined way influence the duration of the local Eddington effect. Nayakshin et al. (2000) note that the cycle period and profile depend on the mass accretion rate in a non-linear way, and it would be very interesting to see if future simulations including a local Eddington effect and mass transfer between the disk and corona (after Janiuk & Czerny, 2005) could reproduce the peak structure of the observed cycles.
The need for future theoretical studies is also highlighted by a recent spectral study of a long BeppoSAX observation of the heartbeat state (Mineo et al., 2012). Dividing the cycles into 5 characteristic intervals, Mineo et al. (2012) followed the disk and corona during the cycle, and they observed behavior consistent with our present work and Neilsen et al. (2011a): the disk radius increases at constant temperature and the coronal electron temperature drops when the disk plunges inwards and the disk temperature spikes (i.e. in the hard pulse). However, their results suggested a decrease in the coronal optical depth during the hard pulse, which they interpreted as a condensation of the corona (in contrast to the sharp increase in the coronal optical depth reported here and in Neilsen et al. 2011a and interpreted as a result of mass ejection processes). Presently, it is unclear if this difference is due to their wider energy coverage (), our superior phase resolution (), or differences in our models, i.e. simpl versus compPS (which includes non-thermal electrons). But the similarities in our results are highly encouraging, and there is hope that new theoretical studies will allow us to converge on a complete understanding of the state in the near future.
5. CONCLUSIONS
GRS 1915+105 exhibits a fascinating array of variability in its X-ray lightcurve. It is believed that many of its variability classes are related to limit cycles of accretion, advection, and ejection, but the origin of these variability classes is only understood to the degree that we understand their diversity. This is particularly true for the state, which is similar to several other variability classes, and which displays striking variations from observation to observation, particularly with respect to the number of peaks per cycle in the X-ray lightcurve (e.g. Massaro et al. 2010; this work).
In a previous paper (Neilsen et al., 2011a), we performed a detailed, phase-resolved spectral and timing study of GRS 1915+105 in a double-peaked instance of the state. Building on our knowledge of this type of oscillation, we have presented here a comprehensive study of archival RXTE observations of the -like cycles. Broadly, our results indicate that the variation in the heartbeat state lightcurves can be explained in the context of two main pulses, one soft and one hard, whose relative strengths, duration, and separation can vary smoothly over time. This explanation appears to apply whether each cycle exhibits one pulse, two pulses, or some intermediate morphology. Furthermore, phase-resolved spectra from the RXTE PCA clearly indicate that oscillations with very different profiles exhibit remarkably similar spectral evolution. We conclude that a common set of dominant accretion processes produces the diverse lightcurves.
In this context, what is particularly remarkable about the heartbeat state is the complex interaction between the disk, its mass accretion rate, and the radiation it produces. The oscillation is a process set in motion by a high external accretion rate, in which an unstable disk periodically sends waves of mass inwards (e.g. Taam et al., 1997; Nayakshin et al., 2000; Janiuk & Czerny, 2005). Responding to the increasing influx of matter, the disk produces enough radiation to slowly expel some fraction of the inflow, driving the inner edge of the disk away from the black hole. But eventually, the disk’s ability to compensate is overwhelmed; when the accretion rate remains high, the excess matter in the inner disk plunges inwards as the temperature and viscosity spike. But even in these final moments of the cycle, radiation pressure still manages to eject some mass from the disk. These are the common, interconnected processes that lead to the -like cycles in GRS 1915+105.
But there is another process, the accretion disk wind, whose ubiquity has yet to be confirmed (see our upcoming Chandra, RXTE, Gemini, and EVLA study; Neilsen et al., in preparation). In Neilsen et al. (2011a) we showed that the bright X-ray pulses from the inflow drive a massive, ionized wind off the outer disk ( cm). This wind can drain as much as 95% of the external mass supply from the accretion flow, suggesting that the companion star is actually supplying matter at a rate well in excess of Eddington (since matter reaches the black hole at roughly the Eddington rate). Massive winds have also been seen in other black holes (e.g. King et al. 2012; Ponti et al. 2012 and references therein) and neutron stars (e.g. GX 13+1; Ueda et al. 2004). Eventually, this massive wind depletes the outer disk, creating a mass deficit. The heartbeat oscillations continue unabated until, days or weeks later, this deficit propagates inwards (Shields et al. 1986; Luketic et al. 2010; Neilsen et al. 2011a), simultaneously suppressing the thermal-viscous instability, the local Eddington effect, radiation-pressure-driven mass ejection, and the accretion disk wind itself.
We end on an exciting note, for it is finally clear that GRS 1915+105 is not alone. In a new outburst detected by Swift/BAT (Krimm et al., 2011) and followed up with frequent RXTE PCA observations, the black hole candidate IGR J17091–3624 was discovered to exhibit heartbeats and several other of GRS 1915+105’s variability classes in its X-ray lightcurve (e.g. Pahari, Yadav, & Bhattacharyya 2011; Altamirano et al. 2011). But if GRS 1915+105’s behavior is made possible by a high mass supply rate from its subgiant companion (Greiner, Cuby, & McCaughrean, 2001), is the presence of two active “GRS 1915+105”s in our Galaxy consistent with models of stellar and binary evolution? Thus, although at a much lower X-ray flux, future studies of IGR 17091–3624 will place strong constraints on the origin of accretion instabilities like those in GRS 1915+105.
References
- Altamirano et al. (2011) Altamirano, D. et al. 2011, ApJ, 742, L17+
- Belloni et al. (2000) Belloni, T., Klein-Wolt, M., Méndez, M., van der Klis, M., & van Paradijs, J. 2000, A&A, 355, 271
- Belloni et al. (1997) Belloni, T., Mendez, M., King, A. R., van der Klis, M., & van Paradijs, J. 1997, ApJ, 488, L109+
- Canizares et al. (2005) Canizares, C. R. et al. 2005, PASP, 117, 1144
- Castro-Tirado et al. (1992) Castro-Tirado, A. J., Brandt, S., & Lund, N. 1992, IAU Circ., 5590, 2
- Dhawan et al. (2000) Dhawan, V., Mirabel, I. F., & Rodríguez, L. F. 2000, ApJ, 543, 373
- Fender & Belloni (2004) Fender, R., & Belloni, T. 2004, ARA&A, 42, 317, arXiv:astro-ph/0406483
- Fender et al. (1999) Fender, R. et al. 1999, ApJ, 519, L165
- Fender et al. (2004) Fender, R. P., Belloni, T. M., & Gallo, E. 2004, MNRAS, 355, 1105
- Fukue (2004) Fukue, J. 2004, PASJ, 56, 569
- Greiner et al. (2001) Greiner, J., Cuby, J. G., & McCaughrean, M. J. 2001, Nature, 414, 522
- Hannikainen et al. (2005) Hannikainen, D. C. et al. 2005, A&A, 435, 995
- Heinzeller & Duschl (2007) Heinzeller, D., & Duschl, W. J. 2007, MNRAS, 374, 1146
- Houck (2002) Houck, J. C. 2002, in High Resolution X-ray Spectroscopy with XMM-Newton and Chandra, ed. G. Branduardi-Raymont
- Houck & Denicola (2000) Houck, J. C., & Denicola, L. A. 2000, in Astronomical Society of the Pacific Conference Series, Vol. 216, Astronomical Data Analysis Software and Systems IX, ed. N. Manset, C. Veillet, & D. Crabtree, 591–+
- Jahoda et al. (1996) Jahoda, K., Swank, J. H., Giles, A. B., Stark, M. J., Strohmayer, T., Zhang, W., & Morgan, E. H. 1996, in Society of Photo-Optical Instrumentation Engineers (SPIE) Conference Series, Vol. 2808, Society of Photo-Optical Instrumentation Engineers (SPIE) Conference Series, ed. O. H. Siegmund & M. A. Gummin, 59–70
- Janiuk & Czerny (2005) Janiuk, A., & Czerny, B. 2005, MNRAS, 356, 205
- Janiuk et al. (2000) Janiuk, A., Czerny, B., & Siemiginowska, A. 2000, ApJ, 542, L33
- King et al. (2012) King, A. L. et al. 2012, ApJ, in press, arXiv:1112.3648
- Klein-Wolt et al. (2002) Klein-Wolt, M., Fender, R. P., Pooley, G. G., Belloni, T., Migliari, S., Morgan, E. H., & van der Klis, M. 2002, MNRAS, 331, 745
- Krimm et al. (2011) Krimm, H. A. et al. 2011, The Astronomer’s Telegram, 3144, 1
- Lee et al. (2002) Lee, J. C., Reynolds, C. S., Remillard, R., Schulz, N. S., Blackman, E. G., & Fabian, A. C. 2002, ApJ, 567, 1102
- Lightman & Eardley (1974) Lightman, A. P., & Eardley, D. M. 1974, ApJ, 187, L1+
- Lin et al. (2009) Lin, D., Remillard, R. A., & Homan, J. 2009, ApJ, 696, 1257
- Luketic et al. (2010) Luketic, S., Proga, D., Kallman, T. R., Raymond, J. C., & Miller, J. M. 2010, ApJ, 719, 515
- Massaro et al. (2010) Massaro, E., Ventura, G., Massa, F., Feroci, M., Mineo, T., Cusumano, G., Casella, P., & Belloni, T. 2010, A&A, 513, A21+
- McClintock et al. (2006) McClintock, J. E., Shafee, R., Narayan, R., Remillard, R. A., Davis, S. W., & Li, L. 2006, ApJ, 652, 518
- Miller et al. (2008) Miller, J. M., Raymond, J., Reynolds, C. S., Fabian, A. C., Kallman, T. R., & Homan, J. 2008, ApJ, 680, 1359
- Mineo et al. (2012) Mineo, T. et al. 2012, A&A, 537, A18
- Mirabel et al. (1998) Mirabel, I. F., Dhawan, V., Chaty, S., Rodriguez, L. F., Marti, J., Robinson, C. R., Swank, J., & Geballe, T. 1998, A&A, 330, L9
- Mirabel & Rodríguez (1994) Mirabel, I. F., & Rodríguez, L. F. 1994, Nature, 371, 46
- Nayakshin et al. (2000) Nayakshin, S., Rappaport, S., & Melia, F. 2000, ApJ, 535, 798
- Neilsen & Lee (2009) Neilsen, J., & Lee, J. C. 2009, Nature, 458, 481
- Neilsen et al. (2011a) Neilsen, J., Remillard, R. A., & Lee, J. C. 2011a, ApJ, 737, 69, 1106.0298
- Neilsen et al. (2011b) Neilsen, J., Petschek, A. J., & Lee, J. C. 2011b, MNRAS, in press, arXiv:1112.1066
- Pahari et al. (2011) Pahari, M., Yadav, J., & Bhattacharyya, S. 2011, arXiv:1105.4694
- Paul et al. (1998) Paul, B., Agrawal, P. C., Rao, A. R., Vahia, M. N., Yadav, J. S., Seetha, S., & Kasturirangan, K. 1998, ApJ, 492, L63+
- Ponti et al. (2012) Ponti, G., Fender, R., Begelman, M., Dunn, R. J. H., Neilsen, J., & Coriat, M. 2012, MNRAS, in press, arXiv:1201.4172
- Shields et al. (1986) Shields, G. A., McKee, C. F., Lin, D. N. C., & Begelman, M. C. 1986, ApJ, 306, 90
- Steiner et al. (2009) Steiner, J. F., McClintock, J. E., Remillard, R. A., Narayan, R., & Gou, L. 2009, ApJ, 701, L83
- Taam et al. (1997) Taam, R. E., Chen, X., & Swank, J. H. 1997, ApJ, 485, L83+
- Ueda et al. (2004) Ueda, Y., Murakami, H., Yamaoka, K., Dotani, T., & Ebisawa, K. 2004, ApJ, 609, 325
- Wilms et al. (2000) Wilms, J., Allen, A., & McCray, R. 2000, ApJ, 542, 914
- Yadav et al. (1999) Yadav, J. S., Rao, A. R., Agrawal, P. C., Paul, B., Seetha, S., & Kasturirangan, K. 1999, ApJ, 517, 935
- Zdziarski et al. (1996) Zdziarski, A. A., Johnson, W. N., & Magdziarz, P. 1996, MNRAS, 283, 193
- Zimmerman et al. (2005) Zimmerman, E. R., Narayan, R., McClintock, J. E., & Miller, J. M. 2005, ApJ, 618, 832
- Życki et al. (1999) Życki, P. T., Done, C., & Smith, D. A. 1999, MNRAS, 309, 561