School of Information Science and Technology, East China Normal University, Shanghai 200241, China
Networks and genealogical trees Systems obeying scaling laws
Criticality and Continuity of Explosive Site Percolation in Random Networks
Abstract
This Letter studies the critical point as well as the discontinuity of a class of explosive site percolation in Erdös and Rényi (ER) random network. The class of the percolation is implemented by introducing a best-of-m rule. Two major results are found: i). For any specific , the critical percolation point scales with the average degree of the network while its exponent associated with is bounded by and . ii). Discontinuous percolation could occur on sparse networks if and only if approaches infinite. These results not only generalize some conclusions of ordinary percolation but also provide new insights to the network robustness.
pacs:
89.75.Hcpacs:
89.75.DaPercolation describes the connectivity of a graph by continuously occupying links or nodes. Due to its wide application in a variety of area such as epidemics, nuclear multifragmentation and network robustness etc., it has been an active subject of research for decades[1, 2, 3, 4, 5, 6]. Perhaps of the greatest importance in percolation studies is its order of phase transition and the location of critical point. In almost all cases percolation on graphs is shown to be continuous (higher than first order) while critical points for networks of various structure and dimension have been determined. In an ER random network with average degree , as a well studied case, ordinary site percolation causes a continuous phase transition at critical point [7, 8].
Recently a new kind of percolation, named explosive percolation was proposed. By introducing a proper competitive mechanism, it was first found by Achlioptas, D’Souza, and Spencer and was subsequently studied intensely by other scientists that the bond percolation in random networks could be discontinuous [9, 10, 11, 12, 13, 14, 15, 16, 17]. However, further numerical and theoretical studies demonstrated that such percolation is actually continuous in the thermodynamic limit but has unusually small critical exponent [18, 19, 20, 21]. But this is not the end of the story. For instance, a very recent study pointed out that the behavior of the explosive percolation transition depends on detailed dynamic rule [22]. When dynamic rules are designed to suppress the growth of all clusters, the explosive percolation transition could be discontinuous. Another recent study on explosive site percolation on square lattice also claimed the existence of discontinuous phase ]transition [23]. Therefore whether the explosive percolation is indeed discontinuous or continuous is still controversial.
Despite the extensive studies on discontinuity of explosive percolation, the other important property, namely the location of the critical point, has not been studied systematically. Previous studies presented the related results only for their special models, which neither provide any general conclusions nor help to understand its physical meaning in network dynamics. In this Letter, critical percolation point is the prior issue to discuss. This is partly motivated by some earlier works on network robustness under attack [24, 25]. While most of their attack strategies are based on degree information, real-world networks may suffer more diverse structure frangibility to which a practical attack strategy could be more specific. The concept of explosive percolation allows us to explore these questions in a general way and could provide new insights to network robustness. One of the aim of the Letter is to show that in addition to discontinuity or not, explosive percolation has other appealing properties worth studying. The discontinuity of the percolation and the related critical exponents are also discussed properly.
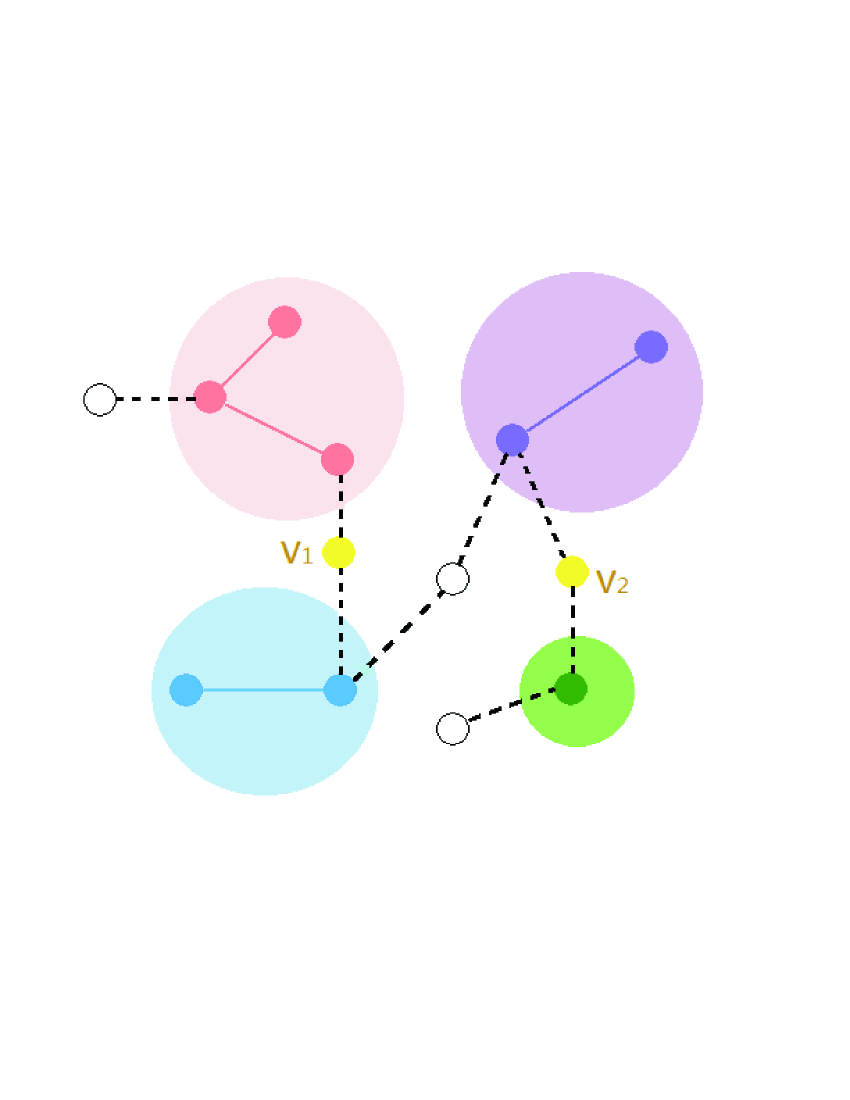
Let us begin with our explosive rule. Consider a connected ER random network with total number of nodes and average degree . At each time step , defined as the fraction of number of occupied nodes of , empty nodes are selected randomly as candidates to be occupied, but only the one which minimizes the sum of the size of the clusters that itself connects is finally chosen, as visualized in Fig 1. If there is more than such a node, we choose one of them randomly. This competitive process is the so-called best-of-m rule which has also been applied to bond percolation [16, 19]. Repeating this process, the system will eventually become percolated at a critical point , while its critical behavior depends crucially on the value of . With the increase of , the growth of the order parameter , defined as where is the the size of the largest connected cluster, is effectively suppressed, leading to gradually delayed critical points and a discontinuous-like jump in its critical dynamics (Fig. 2(a)). For the case of , the traditional continuous site percolation is recovered while for the system becomes the most explosive. In most cases, percolation concerns the critical behavior in the thermodynamics limit, so we focus on critical point in the thermodynamics limit , which is defined as .
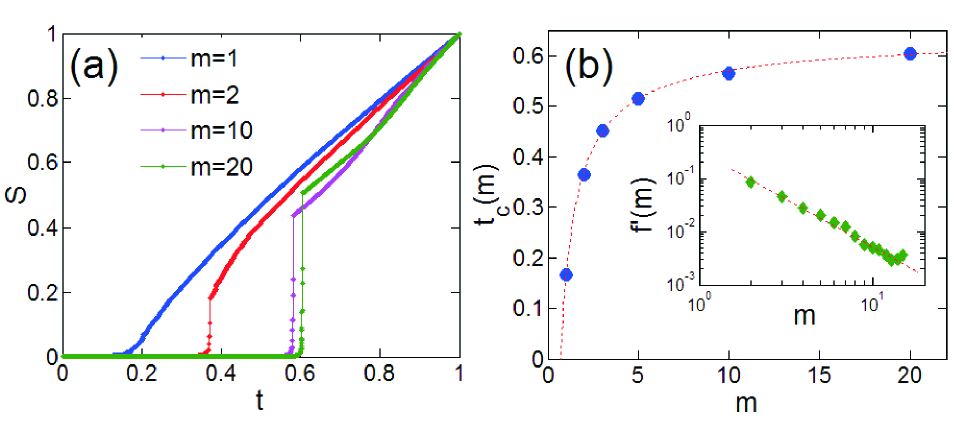
Further inspection on Fig. 2(a) reveals that the increase rate of the critical point decreases with . In fact, the increase rate vanishes so quickly that the critical point is conjectured to have a nontrivial limitation . This conjecture can be reached by contradiction. Suppose such limitation does not exist, i.e. , it is expected that just before this , the network has only unoccupied nodes and isolated occupied clusters of similar size of as global competition in explosive bond percolation.[19]. Denoting the average degree within each of the cluster, these clusters surely belong to the ensemble of subgraph of nodes and links. On the other hand in ER random network, the average number of appearance of such subgraph can be calculated as
| (1) |
Consistently we should have , leading to . However must hold because each occupied cluster is connected. Then in the thermodynamic limit it comes to the only possible solution . While for a connected random graph, the average degree is generally larger than , so for each of the isolated cluster there are about links stem from the cluster to the remaining unoccupied nodes, leading to such links totally. We thus arrive at a contradiction since the unoccupied nodes can only provide links. Note that although the proof is made for , it does not rule out the possibility of its validation for . Actually only occurs when as will be discussed later.
It is then nontrivial to find such limitation . Defining the susceptibility as , which quantifies the amplitude of the fluctuations of the size of the largest cluster, the critical point of finite network size is said to locate at which reaches its maximum. Then with a finite size scaling function , the critical point in the thermodynamic limit can be precisely determined [12]. By this method, for each and each is calculated as a preparation for finding . for a particular can be written as
| (2) |
It is valid that , which indicates that the formula of can be derived by calculating the difference of . Then further calculation of for successive from to is made and is found to follow a power-law formula (inset of Fig. 2(b)). Having known the expression of , Eq.(2) can be used to determine (Fig. 2(b)). The major error of this method results from the finite number of the fitted data points. The error can be evaluated in the following way. Consider that we have a sequence of data points of successive up to , the fit for these data points gives . Then the error is given by = . We calculate for successive and find that follows a power-law formula. In the case of Fig. 2(b), for example, the formula approximately equals . With , the error is estimated to be smaller than . Actually our calculation for each indicates that the error caused by the proposed finite size scaling method is no more than . Detailed results of are reported in the legend of Fig. 3.
To find a general correlation of critical point and the network’s structure, is plotted as a function of the average degree (Fig. 3). It gives
| (3) |
where . Rather interestingly, still scales as a power law but with a different exponent , in contrast to found in ordinary site percolation. What is more nontrivial is that a general expression of can be directly deduced from Eq.(3). Since for all , is bounded by two power-law functions, i.e. Eq.(3) and (the critical point of ordinary percolation), according to the argument in Ref.[26] critical point for all must scale as a power law with and its exponent depends on the specific value of .
| (4) |
Fig. 3 demonstrates the validation of Eq.(4). The exponent is found to be well approximated by an arctan function
| (5) |
Although the validation of Eq.(5) needs to be further examined since it is a conjectured result, it coincides with , and also fit the body well as shown in Fig. 3(b).
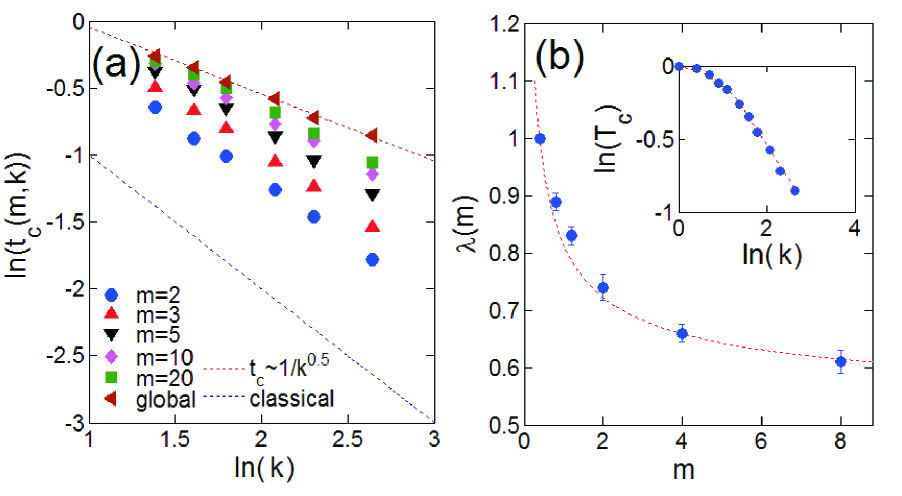
(b): Correlation of the exponent with . Blue solid point is the simulation results while red line represents Eq.(5). Inset: Full correlation of with . The prediction by Eq.(6) (red line) coincides well with the simulation (blue solid point). In both simulations, numerical calculations for is carried out up to network size of nodes and is averaged over 50 realizations.
What differs from the ordinary percolation is that the scaling (Eq.(4)) is not always valid but deviates from power law for small when , as demonstrated in the inset of Fig. 3(b) for the extreme case of (i.e. ). Actually the deviation becomes more apparent as grows. This deviation from the power law origins from two aspects: the unconnectedness of the underlying ER random graph for small and the preferential selection for isolated nodes in explosive percolation. When , for example, despite of the existence of the giant component of the underlying graph there are still about percent of nodes forming isolated small clusters. In contrast to an absolutely uniform occupation in ordinary percolation, these isolated nodes are preferentially occupied before criticality in the explosive ones but have no contribution to the emergence of the giant percolated cluster. However, in a connected graph every node helps to bring out giant cluster during the process of percolation. Therefore the constituent of of small includes many idle nodes and thus causes the deviation of power law. If grows, the degree of preferential occupation of isolated nodes increases, so the deviation becomes more apparent. To make the explanation more convincing, for small will be reconstructed according to the above explanation. In the case of , it is expected that all the underlying isolated nodes will be occupied before criticality; the whole network will not be percolated until the underlying giant component is percolated. Therefore can be written as the sum of two parts: the relative size of those isolated nodes and the relative size of the occupied nodes at criticality within the giant component of the underlying graph, as expressed in the following equation
| (6) |
where is the relative size of the giant component of the underlying graph which satisfies the well-known equation [27]. is the critical point of the percolation on the underlying giant component whose average degree is . Clearly is the relative size of the isolated nodes while represents the contribution of the occupied nodes within the underlying giant component. Since as , it is clear that the critical point occurs at for . For the prediction of depends on which is found numerically as . Therefore to obtain , we need to know , and consequently , where , and so on. Finally, we will arrive at a certain so that . Having known the validation of Eq.(3) for , the above-mentioned method allows a recursive estimation for . As shown in the inset of Fig. 3(b), the prediction coincides the simulation results well, which confirms our explanation.
Eq.(3) to Eq.(5), as the main contribution in our study, not only generalize some classical conclusions but could also give some new insights to the network robustness under attack. While most related studies designed their attack strategy based on some topology properties such as degree [24, 25], a practical attack strategy depends totally on how much the attacker knows about the network. If the attacker gets no information on network, random attack is the only option (the case of ). But if the attacker knows the network structure every detail, he/she can find the best way (not just based on degree or some other properties) to destroy the network (the case of ). Thus the practical meaning of could be a measurement of the information that the attacker has on the network. Our study indicates that it is possible to understand the network robustness to any kind of attack based on any such information. However, since assessments of these information are usually impractical, Eq.(3) shows its great significance because can be served as a warning that possible breakdown could ever occur once the attack process exceeds this point. These concepts and ideas are nontrivial in the sense that they indicate a possible general framework for the study of network robustness. Indeed from the viewpoint of information, the network robustness might be defined as a strategy-independent function, namely while previous strategy-dependent work can hardly provide such general definition due to their unquantifiable model.
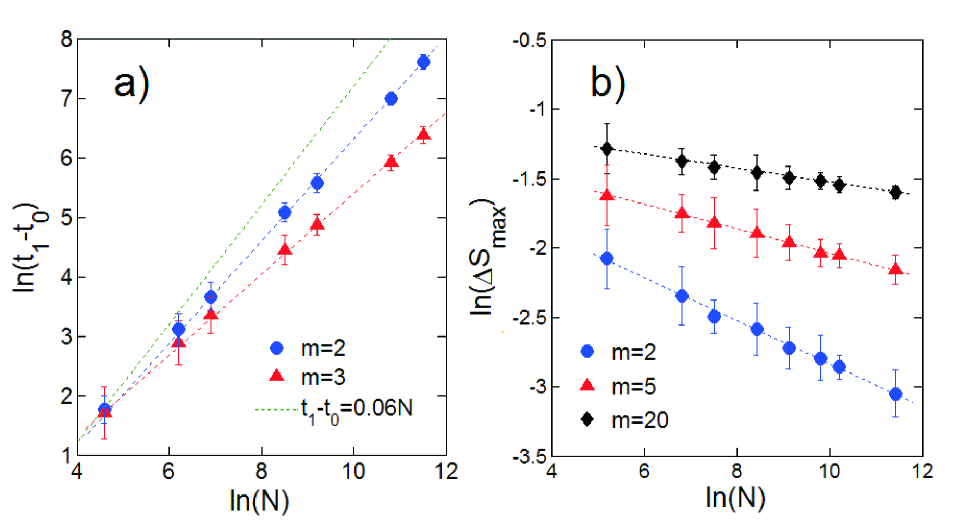
Now let us turn to the discontinuity of the explosive site percolation. The explosive nature can be established in the following way [9]. Let denotes the last step for which , and the first step for which , where and are two positive constants. If there exists a group of and so that the interval vanishes in the thermodynamic limit, the percolation is said to be explosive. In the ordinary site percolation, such and never exist, leading to always of order of . According to the above definition, percolation with zero critical point can never be explosive because the order parameter cannot have macroscopic increase until sufficient (macroscopic) number of nodes are occupied. Since Eq.(3) indicates that for any dense ER network ( when ) the critical point is zero regardless of , percolation on dense ER network must be non-explosive and continuous. Sparsity is thus a necessary condition for a percolation to show explosive nature. If is finite, for the percolation seems immediately becoming explosive with (Fig. 4(a)). However this simulation result can be deceptive and misleading, as indicated by Ref[21]. Indeed further studies on the largest jump of the order parameter indicates that the jump size decreases with as power law and vanishes when (Fig. 4(b)). Thus the site explosive percolation is still continuous in the thermodynamic limit for these cases.
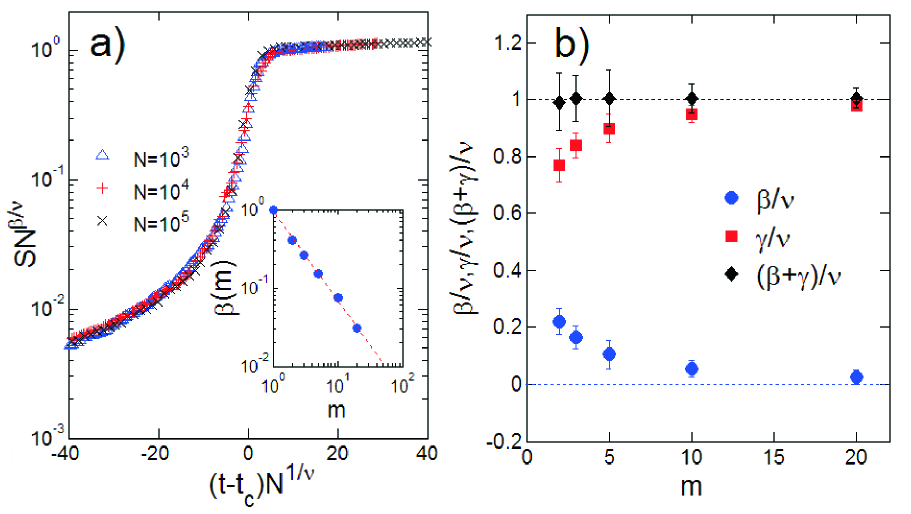
To find a general conclusion for all , finite size scaling analysis of for various is performed [2, 12]. The theory of finite size scaling tells us that the order parameter obeys the relation , where and are two critical exponents and is a universal function. If the percolation is discontinuous, this scaling relation trivially applies with . Otherwise studies of as a function of the system size yield the exponent of . The analysis finally gives the relation (Fig. 5(a)), indicating only when . The finite size scaling analysis is also applied to the susceptibility which obeys , where is another critical exponent and is the related universal function. The definition of along with the scaling behavior of and give the relationship , which can be used to check our measured value of the critical exponents [12]. As shown in Fig. 5(b), the sum is always with good approximation. Other critical exponents are also reported in Fig. 5(b). The power-law decay of indicates that explosive site percolation on ER network is continuous for any finite but could be discontinuous when approaches infinite.
In summary, the critical points of a class of explosive site percolation in ER random network are found to scale with the average degree and their exponents range from to . Heuristic discussions are made to uncover their possible implication to network robustness. Note that although these results are obtained under our specific percolation model, they could be even more general. Since the explosive percolation, as the model proposed here, controls directly the growth of the giant cluster, it is expected that when , the critical point is delayed to the greatest extent compared to any other possible site percolation (i.e. the upper bound provided by Eq. (3) may be valid for any site percolation on ER network). If this assumption is true, for any site percolation satisfying critical point on ER network, must follow Eq. (4) because such critical point is bounded by and Eq. (3). Thus Eq. (4) could be a general and model-independent result. The explosive nature, according to its definition, is deduced to occur only on sparse network. So sparsity is a necessary condition for the explosive site percolation to be discontinuous. When this condition is fulfilled, analysis on the critical exponents by finite size scaling method indicates a power-law decay of . Other critical exponents are also presented to show their consistence. These results reveal that discontinuity of the class of explosive site percolation could happen only in sparse networks and only when , while for any finite the explosive percolation is still continuous.
This work was partially supported by the National Nature Science Foundation of China under Grant Nos. 11075057, 11035009, 10979074, and the Shanghai Development Foundation for Science and Technology under contract No. 09JC1416800.
References
- [1] M.E.J. Newman, SIAM Review 45, 167 (2003).
- [2] D. Stauffer and A. Aharony, Introduction to Percolation Theory(Taylor and Francis, London, 1994).
- [3] S.N. Dorogovtsev, A.V. Goltsev, and J.F.F. Mendes, Rev. Mod. Phys. 80, 1275 (2008).
- [4] W. Bauer, Phys. Rev. C 38, 1297 (1988); A.J. Cole et al, J. Phys. G 23, 457 (1997); X. Campi et al., Eur. Phys. J. D 11 , 233 (2000); Y. G. Ma, Phys. Rev. Lett. 83, 3617 (1999).
- [5] R. Cohen, K. Erez, D.l ben-Avraham, and S. Havlin, Phys. Rev. Lett. 85, 4626 (2000).
- [6] D. S. Callaway, M. E. J. Newman, S. H. Strogatz, and D. J. Watts, Phys. Rev. Lett. 85, 5468 (2000).
- [7] D.Q. Li, G.L. Li, K. Kosmidis, H. E. Stanley, A. Bunde and S. Havlin, Europhys. Lett. 93, 68004 (2011).
- [8] R. Cohen and S. Havlin, Complex Networks Structure, Robustness and Function(Cambridge University Press, New York, 2010).
- [9] D. Achlioptas, R.M. D’Souza, and J. Spencer, Science 323, 1453 (2009).
- [10] R.M. Ziff, Phys. Rev. Lett. 103, 045701 (2009).
- [11] Y. S. Cho, J. S. Kim, J. Park, B. Kahng, and D. Kim , Phys. Rev. Lett. 103, 135702 (2009).
- [12] F. Radicchi and S. Fortunato, Phys. Rev. Lett. 103, 168701 (2009).
- [13] E.J. Friedman and A.S. Landsberg, Phys. Rev. Lett. 103, 255701 (2009).
- [14] R.M. D’Souza and M. Mitzenmacher, Phys. Rev. Lett. 104, 195702 (2010).
- [15] N.A.M. Araújo and H.J. Herrmann, Phys. Rev. Lett. 105, 035701 (2010).
- [16] N. A. M. Araújo, José S. Andrade, Jr., Robert M. Ziff, and Hans J. Herrmann, Phys. Rev. Lett. 106, 095703 (2011).
- [17] W. Chen and R.M. D’Souza, Phys. Rev. Lett. 106, 115701 (2011).
- [18] R.A. da Costa, S. N. Dorogovtsev, A. V. Goltsev, and J. F. F. Mendes, Phys. Rev. Lett. 105, 255701 (2010).
- [19] J. Nagler, A. Levina, and M. Timme, Nature Phys. 7, 265 (2011).
- [20] P. Grassberger, C. Christensen, G. Bizhani, S.-W. Son, and M. Paczuski, Phys. Rev. Lett. 106, 225701 (2011).
- [21] O. Riordan, and L. Warnke, Science 333, 322 (2011).
- [22] Y. S. Cho and B. Kahng, Phys. Rev. Lett. 107, 275703 (2011).
- [23] W. Choi, S.H. Yook, and Y. Kim, Phys. Rev. E 84, 020102(R) (2011).
- [24] R. Albert, H. Jeong, and A.L. Barabási, Nature 406, 378 (2000).
- [25] R. Cohen, K. Erez, D. ben-Avraham, and S. Havlin, Phys. Rev. Lett. 86, 3682 (2001).
- [26] D. D. Han, J. H. Qian, and Y. G. Ma, Europhys. Lett. 94, 28006 (2011).
- [27] B.Bollobás, RANDOM GRAPHS, 2nd ed.(Cambridge University Press, 2011).