Topic Diffusion and Emergence of Virality in Social Networks
Abstract
We propose a stochastic model for the diffusion of topics entering a social network modeled by a Watts-Strogatz graph. Our model sets into play an implicit competition between these topics as they vie for the attention of users in the network. The dynamics of our model are based on notions taken from real-world OSNs like Twitter where users either adopt an exogenous topic or copy topics from their neighbors leading to endogenous propagation. When instantiated correctly, the model achieves a viral regime where a few topics garner unusually good response from the network, closely mimicking the behavior of real-world OSNs. Our main contribution is our description of how clusters of proximate users that have spoken on the topic merge to form a large giant component making a topic go viral. This demonstrates that it is not weak ties but actually strong ties that play a major part in virality. We further validate our model and our hypotheses about its behavior by comparing our simulation results with the results of a measurement study conducted on real data taken from Twitter.
Keywords: Social networks, information diffusion, virality
1 Introduction
Online Social Networks are ubiquitous, as is the realization that our times are being reshaped by them. On the more successful of these platforms, vast user bases distributed around the world are in continuous conversation, transacting information, thoughts and ideas–we use the term topic in this paper–in a variety of formats. Sometimes these transactions lead an otherwise obscure notion to global fame. This possibility of a rags-to-riches story in the world of memes is the wellspring of much of the excitement surrounding OSNs, an excitement captured in the coinage “going viral”. Understanding the processes which make certain topics go viral while others do not is crucial, and could have wideranging economic, social and political consequences. In this paper we present and study a model of topic diffusion on social networks, along with a model-driven study of a real data set, in order to shed some light on these processes. Our main insight is that virality on social networks is not helped by long range links. Virality, in fact, occurs when several close knit communities of users get interested in a topic to such an extent that they merge to form a very large cluster, causing the popularity of the topic to soar.
We define a stochastic model whose dynamics are inspired by real user behavior, and whose macro characteristics closely resemble those of real OSNs. This model, the first comprehensive attempt of its kind to our knowledge, could be extremely useful in generating traces of topic diffusion in OSNs for a multitude of applications like infrastructure provisioning, viral marketing, disaster management etc, but our goal in defining this model is more fundamental: We hope that studying the mechanisms that engender virality in our model will lead to a basic understanding of the phenomenon of virality in social networks.
Our model is a time-evolving stochastic model that captures some of the key features of the diffusion of topics in a social network. A stream of exogenous topics, we call this the global list, is presented to the network’s users as global list. The times of appearance of these topics is given by a Poisson point process. Each exogenous topic has a weight that decays exponentially with the passage of time, reflecting the way in which interest in topics decreases as they get older. The users also perform actions at times whose distribution follows a Poisson process independent of the time distribution of other users and of the global list. At each Poisson time the user decides to talk on a topic picked randomly from the global list or from one of the topics in the lists of its neighbors. This action creates an instance of that topic in the user’s list. This instance has a weight that also decays exponentially. The probability distribution by which the user decides which topic to speak on is determined by the weights of the topics in the global list and the weights of instances in its neighbors’ lists.
The decay in weights of older topics and older instances of topics means that the model has an inherent bias towards newer topics. Older topics retain or grow in strength in local neighborhoods only if those neighborhoods see a growth in instances being created in the neighborhood, capturing the notion that users in a social network are often peer pressured into responding to a particular topic if their connections are interested in it. Our model is, therefore, implicitly a competitive model. The competition between topics here is not explicit, but it is real in a sense that advertisers and political parties will immediately recognize: It is a competition for the limited mindspace of the user base. Our model ends up capturing this notion of a limited mindspace by ensuring that the total weight of instances resident on a node is stationary (in a probabilistic sense) i.e. it might be elastic to some extent but on average over a long period of time it is bounded.
In this study we have used a small-world network to model the social network graph. The reason for this is that we are focusing on ordinary users whose connections show small world properties and have a high degree of reciprocity. The very high impact users that are present on OSNs like Twitter–news media, celebrities–are not present in our network. We abstract their influence into the global list. In doing so we take the focus away from those topics whose wide spread is due to overwhelming promotion by high impact users and turn the lens on those topics whose virality is a consequence of the interest shown in them by the larger network of ordinary users. The small world network respects constraints on the number of connections a normal person can maintain similar to those suggested by Dunbar [8].
The fundamental contribution of this paper is the model mentioned above. We describe this in detail in Section 3. This model does not show behavior similar to a real-world OSN for all settings of its parameters but we do find a parameter regime, we call it the viral regime, for which it does. To study this regime we proceed with a very simple notion of a viral topic: A topic which sees a very large number of instances created at any point of time is deemed viral. We use the vague notion “very large” to allow us greater flexibility while conforming to a popular notion of what constitutes a viral topic. In Section 4 we describe the characteristics of a viral topic in the viral regime, particularly emphasizing the emergence of a giant component in the subgraph induced by users that have spoken on the topic. In Section 5 we discuss how the growth of the topic in several strongly-linked neighborhoods–we call them lattice clusters–leads to viral behavior when these strongly-linked neighborhoods merge, through strong links (as opposed to weak long-range links), to form a very large lattice cluster that forms the backbone for the wide spread of the topic. This narrative of ascent to virality is the main contribution of our paper.
In Section 2 we describe our simulation set-up and the measurement study whose results we use to validate our model. We discuss some important strands of the literature in Section 1.1. Finally, we conclude in Section 6 with some discussion of the implications of our work and future directions.
1.1 Related Work
There have been several studies on information diffusion through social networks, in an attempt to understand the dynamics behind such networks and explore virality. Leskovec et al. [15] show how the growth of one topic affects the growth of other topics in the blogosphere. Yang et al. [21] study the temporal evolution of topics and show how the popularity of a topic grows and fades over time. Sousa et al. [17] have studied how topics spread in Twitter. Using three topics: sports, religions and politics, they investigate the behavior of users in spreading a topic. In another important work, Khaw et al. [14] study topological characteristics of Twitter and analyze how the trending topics are used by Twitter users. Tao et al. [2] conduct a measurement study on Twitter. They observe the evolution of topic strands, the evolution of new users speaking on a topic and activity patterns of the users. Earlier, Guha et al. [11] study the diffusion of information through weblogs, raising the question of how resonance is achieved, resonance being used for an unusually good response of the network to an exogenous topic. Our model aims to address precisely this question of how the dynamics of the network drive an exogenous topic viral. Hussain et al. [16] study the evolution of a viral topic in the blogosphere and the contribution of different classes of blogs - elite, top general, top political and tail - towards making the topic go viral. Wang et al. [3] study a stochastic model to explain viral trends in Twitter, concluding that retweeting drives virality. This finding is consistent with our claims since the act of retweeting is an expression of homophily and our surmise is that homophilic clusters drive virality.
The relevance of a local density of links in spreading a contagion has been studied in the past under the header of complex propagation [7, 9]. These models show that when simultaneous existence of multiple activators is required for a node to get infected, long range links and randomness can slow down the propagation. The relevance of a clustered local community for sustenance has also been propounded by Young [22] in the context of the spread of innovation. Goldenberg et. al. [10] come to a somewhat contradictory conclusion, claiming that strong and weak ties are equally important in product adoption through word-of-mouth.
An important difference between these contagion-flavoured works and ours is that we operate in a competitive setting where the spread of a topic limits the spread of others. A similar setting is found in the competitive viral marketing [4, 6, 18], where there is competition between different products. Competitive diffusion is also studied with respect to rumor and anti-rumor [19] and good and bad campaigns [5].
2 Preliminaries
2.1 The simulation set up
Our social network is modeled by a Watts-Strogatz graph [20]. We begin with a regular lattice ring consisting of nodes. Every node has a total degree and is connected to the nearest nodes on either side of it. We call these local connections, lattice edges. We then consider each lattice edge and rewire the endpoint to a random node with a specific probability, known as the rewiring probability. The new edge now is . The graph is constructed in this manner and is known to have structural properties lying between that of a regular graph and a random graph.
To ensure that the time-evolution of the system is a pure jump Markov processes (with the intention of eventually subjecting it to mean-field analysis [13]) we assume that the inter-activity time of each user follows a Poisson Distribution, as do the inter-arrival times for new topics in the global list. All these distributions are independent of each other. The inter-activity times of all users have the same mean, a significant simplification.
We need very high precision floating point numbers to generate activity times of nodes. For this, we generated random bit strings of length 100. Each random bit was obtained using the rand() function in C. These bit strings are used to generate high precision random numbers between and .
We ran all our simulations on Intel(R) Xeon(R) CPU X5550 machine with a 4 GB RAM and a 2.67 GHz Quad-core processor. We simulated at three different network sizes (1000,10000 and 100000 nodes) for time-window of 1000 units. This simulation completed in approximately 9 seconds on average for networks of size 1000, in approximately 100 seconds for size 10000 and in about 19 minutes for size 100000.
2.2 Measurement study
The data set used in the measurement study in this paper is a part of the data we have engineered for an ongoing measurement project being carried out by our group. We describe the data set and the methodology only in outline here since the engineering aspects of preparing such a data set are complex and require a long treatment. 111In fact a paper describing our methodology in full detail has recently been accepted for presentation at a conference. We withold a citation because of the double blind constraint but will be happy to share these details with the PC chair in confidence if the need arises.
The data set we engineered is a part of the ‘tweet7’ data set which was crawled by Yang et al. [21]. We use the first three month’s (11 June, 2009 to 31 August, 2009) tweets from this data set. The ‘tweet7’ data set contains information only about the tweets by each user, not the social relationships between the users. Therefore, to build the social graph of these users, we merged ‘tweet7’ data set with another data set crawled by Kwak et al. [14]. They crawled the information on the followers of almost all Twitter users during the same period as that of ‘tweet7’ data. The combined data set contains 196,985,580 tweets and 9,801,062 users.
We used OpenCalais [1], a text analysis engine, to identify the topics from the remaining 90% of tweets. Using hashtags and OpenCalais, we are able to extract nearly 6.2M topics in 52M tweets. From this set of topics, after a laborious multi-stage manual process whose details we omit here, we picked out a few topics to compare their evolution with those of the topics in the simulations. Since our study focuses on topics that go viral due to the larger network of common users we mainly targeted topics that are being talked about by such users and not those being initiated and discussed by users with very high numbers of follows. For each such topic, we define a subgraph, consisting of only the nodes that have talked on this topic anytime during it’s evolution. We put a directional edge on this subgraph from node to only if talked on this topic after had talked on it and there was an edge from to in the actual Twitter graph.
3 A stochastic model
The model is hinged on the concepts of novelty and competition. Novelty implies preference for newer topics over older ones. And competition adds the element of uncertainty to the dominance by newer topics. Since these two concepts are general in nature, our model can be applied to different scenarios. We, however, focus here on the application of the model to diffusion of topics in a social network.
Network model
The social network is modeled as an undirected small-world graph each node represents a user and a link between two nodes represents a possible interaction between the two users. We consider here an undirected small world network.
The user network for microblogging sites such as Twitter resemble a scale-free degree distribution with a few users having a large number of links followed by a fat tail of users with a low degree. Here we focus primarily on users constituting the fat tail. The users ranking higher in the degree distribution behave similar to news media, exposing a large number of users to a topic. These high ranking users act like sources for the information, their participation in the social network being distinct from that of the larger masses. The question of relevance for such “celebrity” users is when to break a news and at what frequency to keep replenishing it with newer tidbits in order to maximize its spread. The answer to this question is dependent on understanding how the information spreads through the masses. We focus here on the masses which resemble a small world network and are the core group behind making a content go viral.
Microblogging sites such as Twitter have a follower-following relationship. Celebrities, public figures and news media updaters enjoy a high follower count. The nature of interaction is that of a directed link. However when we come to the masses, the nature of the links with users which are most frequently used are of a friendship nature [12]. We focus here on topics such as movies, politics, sports, amusing videos, gossip etc. which rely primarily on these friendship links to become the buzz of the town. We hence consider here an undirected small world graph.
Topic arrival and propagation processes
When topics come into being, they are included in a global list. These topics could be ones spoken on by the news media, tweets by celebrities, events occurring in the real world etc. The inter-arrival times of the topics follow a Poisson point process with a mean of . The presence of a topic in the global list only announces its availability. When a user picks the topic from the global list, we term it adoption. Only when a topic gets adopted, does it enter the social network. The nodes could also copy a topic from their neighbors. When a neighbor speaks on a topic, it creates an instance of the topic in its local list.
The probabilities of adoption and copying depend on weights that we assign to the topics in the global list and the instances in the local lists. These weights decay exponentially with time. We define the weight parameters later in this section, noting here that we consider a linear model where the weights of instances put together is just the sum of the individual weights of the instances at that time. In a microblogging network like Twitter, where the users quickly browse their timeline and retweet or reply to tweets, multiple instances do not act in order to convince the user to speak on a topic. The multiplicity rather acts as a repeated reminder, buzzing to draw attention. The multiple instances thus linearly add up to draw more attention of the user.
Diffusion Parameters
The model has the following parameters:
-
•
Topic interarrival time: . New topics enter the system by appearing in a global list. The times of entry are given by a Poisson point process with density .
-
•
User activity time: . Each user performs an action which involves creating a new instance of a topic that has already appeared in the system. The times of activity follow a Poisson point process with density . The activity times for all the users are independent of each other and of the times of topic arrival in the global list.
-
•
Global weight parameters: . We consider here a simple model wherein all topics in the global list are adopted with an equal weight . As the topic becomes older and people begin losing interest in it, the weight begins to decay. The weight decays exponentially with time with a decay parameter of . The weight of a topic in the global list decays with time. For a topic that appeared at time , the weight at time is where is a global weight parameter.
-
•
Local weight parameters: . The weight of an instance of a topic that has been spoken of by a user decays with time. For a topic instance created at time by a user, the weight of the instance at time is where is a global weight parameter.
When a node is scheduled to perform an activity, it can either adopt a topic from the global list or copy any of the instances created by any of its neighbors with appropriate weights. As the instances of a particular topic in the neighborhood of a node go up, the copy weight of the topic also goes up. Since a node has only these two options when scheduled for activity, we normalize these weights to obtain probabilities. The normalization factor is the sum of the adoption and copy weights of all topics for a particular node at a particular time .
Probability of instance creation
In order to simplify the simulation process we observe that our model is Markov Process with stationary properties in which the sum of weights in the global list and in each of the local lists converges to a stationary value. For the normalization constant we denote this value . Assuming we have achieved the steady state at time , we determine the value of by summing over the adoption and copy weights of all topics in the global list and all instances in the local lists of the neighbor of a node scheduled to talk at time . Using a mean-field approximation we calculate
| (1) |
at steady state.
We now use a mean-field approach to estimate the probability of a user creating an instance of a particular topic at time . Consider a topic that appeared in the global list at time . Let represent the probability that a node talks about topic at time . This probability is the sum of the adoption probability for the topic and the copy probability of the topic in the neighborhood of the node. The probability of copying from a neighbor is the just the probability that the neighbor talked on the topic at some time in the past, multiplied by the copy probability of that instance at present time. This when integrated over all times and summed over all neighbors gives the required probability .
| (2) |
where is the present time and is the time an instance was created by a neighbor. We omit the steps involved in solving this recursive equation due to paucity of space, presenting only the final answer:
| (3) |
where and . At this point it appears that the model has essentially been solved and there is nothing more to say. But, fortunately or unfortunately, this is not the case. The picture is complicated by the fact that the model displays three different regimes with markedly different behaviors.
Three regimes of topic diffusion
Searching through the parameter space we found three different behavior regimes for our model. We term these sub-viral, viral and super-viral. The rest of the paper will be concerned with the viral regime because it is the only one whose behavior resembles the real world. But it is instructive to look at the other two as well.
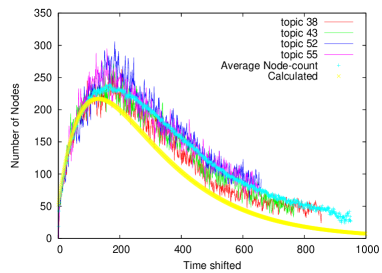
In the sub-viral regime, all topics evolve in a similar fashion. There is no apparent dominance of any topic over others. The fluctuations in the peak heights are small enough to fall within the spectrum of stochastic variances. The network in the sub-viral regime witnesses no virality. It is in this regime and this regime alone that the probability value calculate in (3) makes sense (see Figure 1). The calculated value from (3) and the evolution curves of various topics (time-shifted to appear to originate at 0 for the plot) show marked similarity. The efficacy of mean-field analysis in characterizing the evolution in this regime indicates that long-range interactions play no part here.
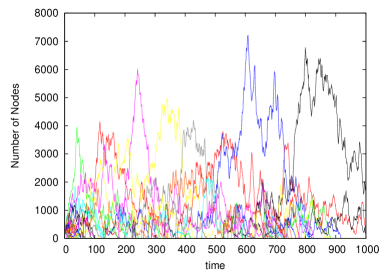
In the viral regime the mean-field analysis breaks down completely. This regime is characterized by a marked diversity in the peak heights for various topics. Figure 2 shows the evolution of topics in this regime. The fluctuations in the peak heights are much larger than mere stochastic variances as seen in the sub-viral regime. The marked distinction in peak heights for some topics allows us to adjudge these topics viral. We do not put forth any concrete threshold beyond which a topic may be called viral and below which non-viral. Any unusually high peaked topic which can be seen to clearly overpower other topics during its lifetime is taken to be viral and we study such topics for viral characteristics. Thus, the viral regime witnesses a self-attained virality as a result of dynamics through aptly tuned parameters.
Moving further in the same direction in the parameter space, we observe the end of the viral regime, marked by increasing similarity in the peak heights for evolution of various topics. Although the evolution pattern resembles the sub-viral regime, the peak heights are much higher. The dynamics behind the pattern in this regime is different from those of the sub-viral regime, making us classify it as a regime of its own which we call the super-viral regime, and completely ignore for the rest of this paper since it does not show real world-like behavior. We now turn our focus to the regime of interest, the viral regime, beginning by reporting its characteristics and going on to explain what makes certain topics go viral.
4 Characteristics of the viral
regime
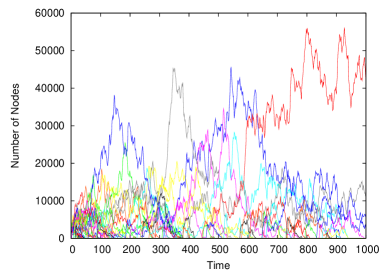
The viral regime has a definite diversity in the peaks achieved by various topics during their evolution. Some topics clearly shoot up much higher than the average peak of other topics. Such topics which have an unusually large number of nodes talking about them simultaneously, are termed viral. Figure 3 shows an example evolution of topics in the viral regime for a networks of size 100000.
In this section we present some statistical and topological studies performed on simulation traces of our model when parametrized in the viral regime. As expected, topic spread, lifetime and peaks all follow power law distributions. We also study the effect of the number of topic adopters on the spread of topics and find it to be negligible, which is what we wanted to achieve. On the topological front we find that viral topics have one large connected component while non-viral topics tend to be highly disconnected. We also present some topological findings that lay the groundwork for our theories regarding the emergence of virality (presented in Section 5.) In this and the subsequent section we say that a node speaks on topic at time is the most recently created instance in the local list of the node at time is an instance of topic .
4.1 Statistical observations
Figure 4 shows the rank ordered plot on a log-log scale for the topics in viral regime, with the topic having the highest peak during its evolution ranked first. The distribution follows a power law with very few topics achieving a high peak during their evolution followed by a fat tail of topics with low peaks.
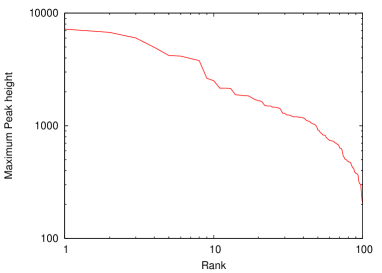
Figure 5 shows the rank ordered distribution for the lifetimes of various topics in the network. A topic is said to survive if there is even a single node in the network speaking on it. The distribution follows a power law. A few topics live in the network for a long duration compared to a fat tail of topics which die out sooner.
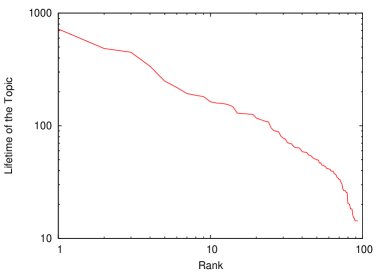
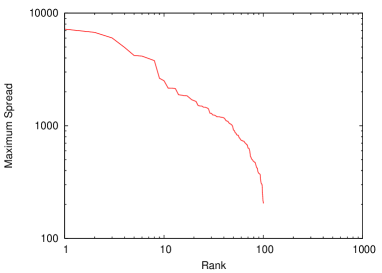
Figure 6 shows the rank ordered distribution for the maximum spread of a topic. The maximum spread depicts the number of nodes which speak about the topic at some point of time or the other during the evolution of the topic. The power law indicates that very few topics succeed to reach a high spread while many topics die out after reaching only a small number of nodes.
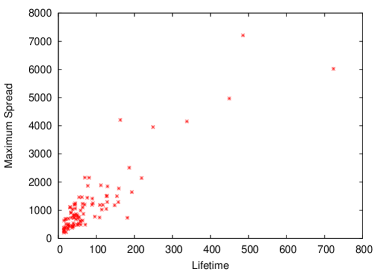
The lifetime vs maximum spread is shown in Figure 7. It supports the deduction that topics which live longer in the network are also able to reach out to a larger section of the network.
4.2 The role of adopters
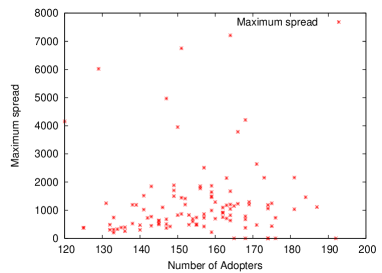
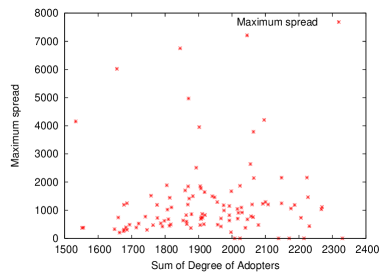
The role of number of adopters has been crucial in the study of contagion over the years. The occurrence of high peaks in the evolution of some topics in the viral regime raises the question of whether these topics enjoy a higher number of adopters. In our model, adopters of the topic are the nodes which adopt the topic from the global list. Since these are the nodes which bring the topic into the network, one might be tempted to conclude that the number of adopters for viral topics is higher than that for the non-viral ones. Figure 8 shows the distribution of the maximum spreads achieved by topics along with the number of adopters of the topic. There is no specific trend in the distribution which can lead us to believe that the topics enjoying higher number of adopters also reach out to a larger fraction of the network during their evolution. Since variances in the degree of the adopters could significantly affect their reach and hence prove crucial, we incorporate them before correlating with the spread. Figure 9 shows the distribution of the maximum spread of the topics with the sum of the degrees of the nodes which adopted these topics. We again see no particular correlation and can thus safely conclude that a higher number of adopters is not the reason for the peaks observed in the topic evolutions in the viral regime of our model. This demonstrates that our model does indeed eschew the effect of high impact users. The topics that go viral in our setting are the ones that the network itself promotes.
4.3 Topological characteristics
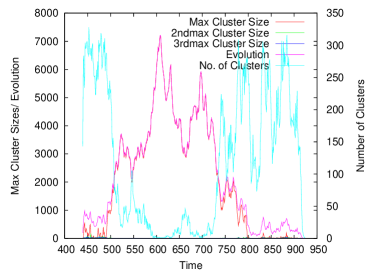
To study how the graph topology affects the evolution of the topic, we look at the evolution of clusters of nodes speaking on a particular topic simultaneously. Figures 10 and 11 show the evolution of the cluster sizes along with the evolution of the topic for a viral and a non-viral topic.
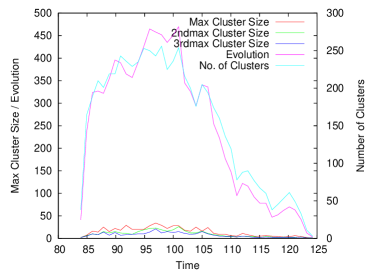
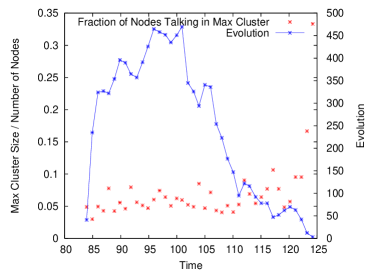
A non-viral topic is characterized by many small clusters disconnected throughout the lifetime of the topic. The number of clusters increase when there is a peak in the evolution of the topic indicating that the surplus nodes speaking on the topic belong to clusters different from the existent ones. On the contrary, for a viral topic, we see a significant dip in the number of clusters when the topic peaks in its evolution. This is because of the formation of a giant cluster which encompasses a large fraction of the nodes speaking on the topic. The evolution sees similar sized clusters when the topic is young and the formation of a giant cluster when the topic peaks. Figures 12 and 13 show the evolution of the fraction of nodes lying within the largest cluster. The non-viral sees a very small fraction inside the largest cluster while the viral sees a large fraction when it peaks in its evolution indicating that it is a giant component.
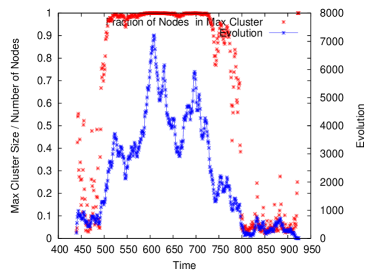
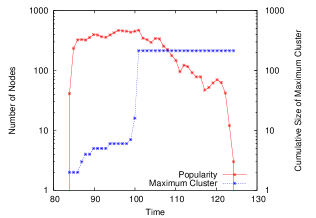
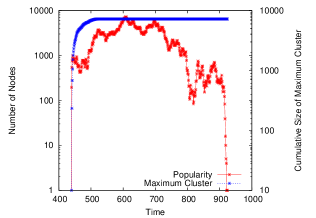
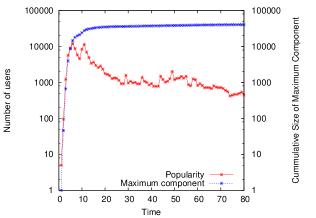
While the nodes speaking on the viral topic during its peak belong to a giant component, it is of interest to investigate whether the nodes have spoken before on the topic or not. In other words, we look at how the number of unique nodes speaking on the topic in the largest cluster evolve with time. We term this as the cumulative size of the largest cluster. In Figure 14 we see that for a non-viral topic, the cumulative size grows and saturates at a low value some time during the evolution of the topic. For a viral topic, however, we see a sharp increase in the cumulative cluster size as the topic shoots up. The following times observe a saturation in the cumulative cluster size while the topic sustains a high peak. This is representative of the way a viral topic grows. The rise of the topic is marked by more and more new nodes speaking on the topic while the sustenance is marked by subsequent discussion among the nodes that have already talked on the topic. This behavior is also observed in real topics taken from the Twitter data set.
|
|
| (a)Simulation: Non-Viral | (b)Simulation: Viral |
|
|
| (c) Real topic: Non-Viral | (d) Real topic: Viral |
| (NICK CANNON) | (IRANELECTION) |
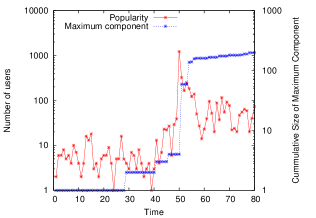
For a similar investigation on the real Twitter data set, we look for the maximum strongly connected component and compare them with the evolution of the topics. The graphs obtained from the real data bear a strong resemblance with the ones obtained from the simulations. The non-viral topic of NICK CANNON sees the cumulative component size saturating somewhere during its evolution while the one for the viral topic IRANELECTION saturates as soon as the topic attains its peak. The topic is then sustained by discussion among these users over the next several days.
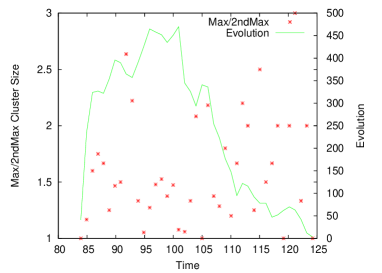
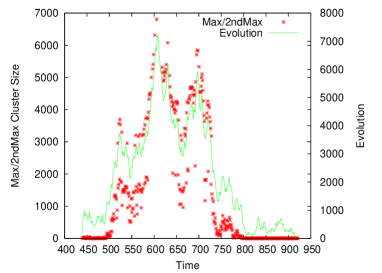
Having established the significance of a giant component in the evolution of a viral topic, we represent its formation by plotting the ratio of the size of the largest cluster to that of the second largest cluster in Figures 15 and 16. For a non-viral topic, the ratio does not fall into any particular pattern and retains low values throughout the evolution of the topic, thus depicting the lack of formation of a giant component for a non-viral topic. For the viral topic, the ratios not only have a higher value but also peak in sync with the peak in the topic evolution, clearly indicating the formation of the giant component during the peak and sustenance of a viral topic.
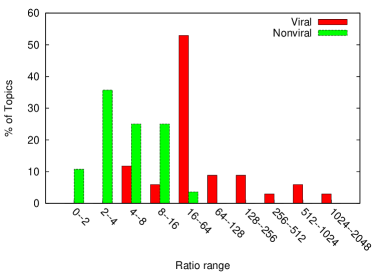
To establish this difference in the giant component formation between viral and non-viral topics in a comprehensive fashion, we present the following histogram. We consider the ratio of the largest to the second largest cluster size and find its median for all topics during their lifetime. In Figure 17, we plot a histogram for the different ranges of the median obtained. In the lower ranges of the ratio, the non-viral topics dominate over the viral ones. Since a low ratio implies the lack of a giant component, this is an indication of all non-viral topics lacking such a component. The higher ranges for the ratio see taller bars for the viral topic, thereby showing the presence of a giant component in majority of the viral topics.
It may be argued that it is not surprising that if a large number of users are speaking on a topic the high clustering coefficient of a Watts-Strogatz graph will make a giant component out of them. However, the topology of the Watts-Strogatz graph is not the hero (or villain) of this piece. In fact, we find that even when the long range (rewired) links of the Watts Strogatz graph are snapped, the largest cluster of a viral topic constitutes a significant fraction of the evolution when it takes it high peaks (see Figure 18). This insight drives the argument for the emergence of virality that we present in the next section.
5 The emergence of virality
We now present our narrative of the emergence of virality. In what follows we use the term local community. This means those users who are joined by lattice edges i.e. those edges of the Watts-Strogatz graph that did not get rewired to a random node. These local communities play a critical role in our theory. There are three crucial hypotheses making up our narrative.
-
Hypothesis 1. Users speaking on a topic expose their local communities to the topic. The topic grows as it spreads to more communities, and not just more users in the same community.
-
Hypothesis 2. The merging of several local communities talking on a viral topic leads to the topic attaining its peaks.
-
Hypothesis 3. When a topic goes viral, a node speaking on the topic has many of its strong ties speaking on the topic as well. Subsequent discussions on this topic stay largely within the conglomerate of local communities initially formed.
The crucial part of the story is that it is local communities that support a topic during its early life. When a number of local communities gain, and sustain, interest in the topic these communities begin to merge. To understand this take the following example: if the community of musicians is excited about a topic and the community of sports enthusiasts is talking about a topic, if the topic sustains then sooner or later the musicians who follow sports will talk about it, causing the communities to merge. The crucial part of this merger is encapsulated in Hypothesis 3: It does not take place through weak long-range links, it happens along strong local links. This merger of several local communities takes the topic viral. And once it has gone viral, it is this merged conglomerate of local communities that continues to discuss the topic (it does not spread significantly outside them) till it slowly yields to newer topics.
Before we present the evidence in support of our hypotheses we formalize the notion of local community. We define a lattice cluster of size centered around node in a Watts-Strogatz graph with mean degree as the set of all nodes that can be reached from in hops or more where the hops are taken along lattice edges only. The notion of a lattice cluster springs from the resemblance of levels in a Watts-Strogatz graph with local communities in a social network. The connectedness of a level resembles the strong ties within a community sharing homophily. A common subject of interest holds the nodes in a level together. When a topic enters a community, it immediately gets passed on within the community by virtue of the users sharing a common interest. This real phenomenon manifests itself in the dynamics too. An adoption is quickly followed by successive copies along the lattice neighbors owing to their connectedness. The growth along the lattice is hence of essence to the evolution of the topic, since this spread is rapid and sustainable.
Hypothesis 1. Gain and sustain local support
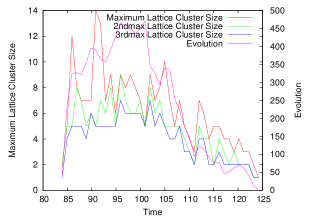
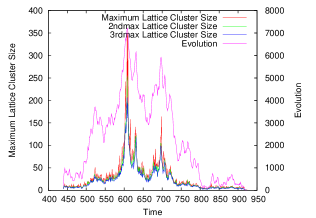
Figure 18 shows the evolution of a topic along with the evolutions of the three largest ranking lattice clusters. One can see the early life of the topic being characterized by many lattice clusters of small sizes. Had the topic grown by virtue of local communities buzzing with the topic and the neighbouring communities then catching it on from them, one would have seen a large sized lattice cluster followed by smaller ones early in the evolution of the topic. But, the comparable sizes of the three top ranking lattice clusters, is indicative of a spread to adjoining lattice clusters without saturation of the initiating one.
|
|
|---|---|
| (a) Non-viral topic | (b) Viral topic |
|
|
|---|---|
| (a)Non-viral(CARY GRANT) | (b) Viral topic (FRIENDFEED) |
Hypothesis 2. Merging localities lead to virality
When two such strings along the lattice collide, the nodes in the levels around the point of collision begin to fill in quickly. We say two lattice clusters have merged when the levels between them have at least one node speaking on the topic. The strings then coalesce to form one big lattice cluster. In the next few time steps, this burst of weight of the topic begins to spread to levels on either side of the point of collision on the lattice. As the lattice cluster begins to fill in, more and more nodes within the cluster begin to hear about the topic and speak on it. This phenomenon leads to the topic peaking sharply in its evolution, suppressing other topics. When the burst of weight has spread as far as it could, the lattice cluster saturates in size. The massive weight of the topic within this lattice cluster and the connectedness of the cluster enable nodes to still continue copying the topic from each other, speaking intermittently on the topic and enabling it to sustain its peak for a finite duration.
Figure 18 shows the difference in the sizes of the lattice clusters for a viral and a non-viral topic. Further, for a viral topic, the size of the lattice cluster shoots up when the topic peaks in its evolution, showing a clear correlation between the two. The evolution has a peak while the largest lattice cluster has a peak , showing that all nodes speaking on the topic at that time are not in one giant lattice cluster. There are several lattice clusters of varying sizes extant at the same time. However, the merging of a few clusters to form a giant component is in sync with the peak in the evolution of the topic.
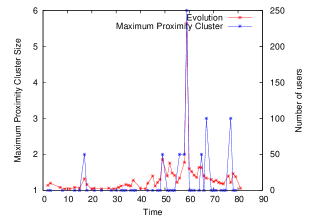
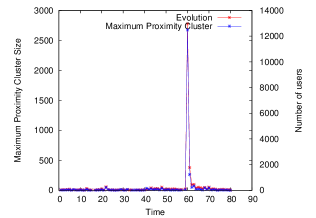
To get a feel for lattice-clusters in real Twitter data, we defined a notion of proximity. Two nodes and , in the topic subgraph, have a proximity value associated with them, which is measured as:
where denotes the set of nodes in the neighborhood of . Thus, more the fraction of common neighbors, more the value of proximity between a pair of nodes. We put a threshold on the proximity value and consider only the nodes with as being lattice neighbours of each other.
Using the notion of proximity, we define a proximity cluster () at time as a connected component in the topic subgraph, talking on the topic, which contains a node , only if at least a such that . In Figure 19, we plot graphs for a viral and a non-viral topic from the real data, showing how the maximum proximity cluster size varies with the evolution of the topic. The plot shows a clear correlation between the evolution of the largest lattice cluster and the evolution of the topic. A peak in the topic evolution is synchronously accompanied by a peak in the size of the largest lattice cluster, thus validating our hypothesis.
To elucidate the phenomenon of merging in real data, we look at the evolution of conductance of the topic subgraph. We use the following definition of conductance. The conductance of a subset of nodes of graph is defined as the ratio of the edges going out from to all the edges originating from .
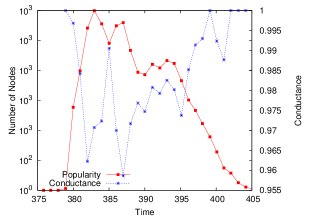
|
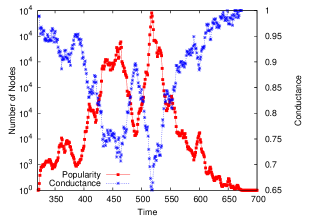
|
| (a) Simulation: Non-viral | (b) Simulation: Viral |
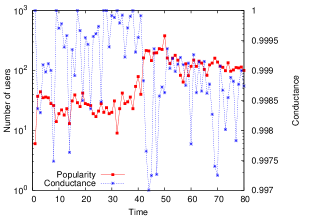
|
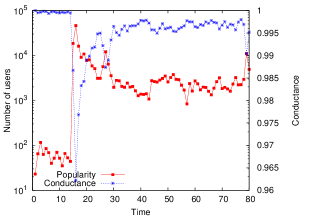
|
| (c) Real: Non-viral | (d) Real: Viral |
| (CAMBRIDGE) | (MICHAEL JACKSON) |
Figure 20 shows the conductance graphs for simulation and real data for a viral and a non-viral topic. The general pattern in the evolution of conductance is similar in the real and simulated curves. With the merging of lattice clusters and with more and more nodes within the cluster speaking on the topic, we would expect the number of edges within the cluster to increase and the number of outgoing edges to decrease. Consequently we would expect the conductance value to dip when the clusters merge. Figure 20 shows the conductance value dipping when the topic peaks, thereby suggesting merging of clusters. If we look at the magnitudes of conductance values, we find that for the viral case, the values drop to as low as (simulations) and (real-data), indicating the formation of strongly connected components at the peak of topic evolution. On the other hand for the non-viral cases, we have much higher values.
Hypothesis 3. Virality is sustained in the merged cluster.
For a particular topic we observed the value of the local weight of that topic in the neighborhood of each node at each time that the node speaks on that topic. i.e. if a node at time spoke on topic and the weight of topic in the neighborhood of was , say, then we noted this as one occurrence of the value and plotted a histogram of the frequency of different weight values.
|
|
|---|---|
| (a) Non-viral topic | (b) Viral topic |
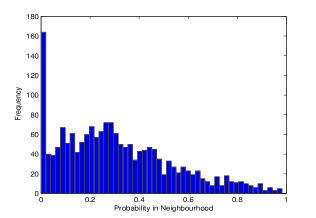
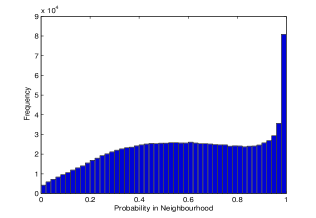
In Figure 21 we show the histograms thus obtained for a viral topic and a non-viral topic from the viral regime on a network of size 10000. Firstly, we observe the difference in the peak heights of the histograms for a viral and a non-viral topic. This is a result of a viral topic being spoken about many number of times as compared to a non-viral topic. For a non-viral topic, the local weights that are achieved maximum number of times hover around 0.2 to 0.4. Beyond 0.5, the peaks begin to dip. Since achieving a high local weight is equivalent to more number of neighbors of the node talking on the topic in quick succession, the dip shows that such scenarios for a non-viral topic are rare. For a viral topic, however, we observe a different pattern with the histograms peaking as we move closer to . This shows that for a viral topic, the scenarios where a node has most of its neighbors talking on the topic at quick successions are huge in number. In fact, it is this scenario of multiple neighbors talking simultaneously on the topic which makes the neighboring nodes adopt the topic with greater probability driving it viral. The peak in the local weight for the topic leads to it being chosen with greater probability which acts as a feedback making the topic go further viral and also sustain the virality.
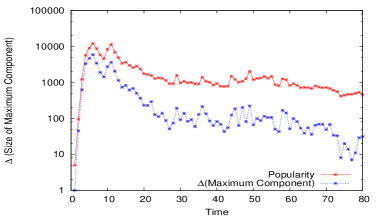
The real data shows a related phenomenon. In Figure 22 we see that once the topic “IRANELECTION” has reached its peak (of the order of ), the change in the number of users is bounded in the order of a few hundred a day, often falling to much lower values. Hence virality, if sustained, is generally sustained by largely the same user base that caused it to occur in the first place, thereby making us feel that it is at the point of its emergence that a viral topic garners most of the support it is ever going to get.
Discussion
The phenomenon of lattice cluster merging exhibits how a topic which is popular in a small group of users sharing homophily need not take over the entire network. If we consider the hops of as being a gradual shift in the subject binding these users closely to each other, the spread of the topic even when it is young shows the need for a few people in different related genres to speak on the topic simultaneously. These people influence more users to talk and the lattice cluster spreads. When the lattice clusters from two different genres collide, the intermediary users are encouraged to copy the topic owing to homophily on either side. Both these genres attack the intermediary nodes which then begin to spread the buzz. The copying then sees both the distinct genres filling up as more and more hardcore users of the genre copy the topic. The quick filling in shows why most of the users do not seem to hear about the topic at all and then hear a lot about it suddenly and from everywhere, everywhere being a sign of the different genres that the node is a part of.
6 Implications and future directions
Much has been said in the last two decades about “six degrees of separation” and “small worlds” and it is true that the world is more closely linked today than it has ever been. But our results show that virality is not a function of the social network’s ability to bring faraway things closer. It is, in fact, achieved when many smaller homophilic groups discover an interest in a certain topic. The overlapping of this interest over a large number of such groups leads to virality. This is, in some sense, an organic narrative of growing popularity, a narrative that those marketing executives who spend time poring over the early sales data of The Girl With the Dragon Tattoo perhaps understand intrinsically. For those of a less commercial bent, those who want to change the world, also there is a lesson in our findings. That lesson is if enough people act locally in a large enough number of localities, there is a global impact. And a sobering thought is that no matter how intensely one community feels about some topic, unless other communities also develop that interest, the topic will die in small disconnected clusters.
The main focus of this work has been on modeling the processes of diffusion although we have adduced results from a small measurement study to back up our claim that our model is a real model and that the artifacts we find in it have echoes in the real world. One prominent research direction to follow is a large-scale model-driven measurement study. Another direction that remains is to generalize the model by allowing users to act at different times, perhaps act in correlated times rather than independent time, to repose different levels of trust in different neighbors, to view different classes of topics with different levels of interest. In the current work we sacrificed this rich diversity of the topic diffusion setting in order to define a model that was easier to handle while being sufficiently general as to describe a coarser level of behavior, but if a more nuanced view is taken then a richer model emerges. In such a case further measurement could also help to instantiate different parameter classes.
References
- [1] OpenCalais. http://www.opencalais.com/, 2011. [Online; accessed 28 Oct-2011].
- [2] F. Abel, Q. Gao, G. J. Houben, and K. Tao. Analyzing temporal dynamics in twitter profiles for personalized recommendations in the social web. In Proceeding of the 3rd international conference on Web Science, WebSci ’11, 2011.
- [3] S. Asur, B. A. Huberman, G. Szabo, and C. Wang. Trends in Social Media : Persistence and Decay. In Proceedings of the 5th International AAAI Conference on Weblogs and Social Media, ICWSM ’11, 2011.
- [4] S. Bharathi, D. Kempe, and M. Salek. Competitive influence maximization in social networks. In Proceedings of the 3rd international conference on Internet and network economics, WINE ’07, pages 306–311, San Diego, CA, USA, 2007. Springer-Verlag.
- [5] C. Budak, D. Agrawal, and A. El Abbadi. Limiting the spread of misinformation in social networks. In Proceedings of the 20th international conference on World wide web, WWW ’11, pages 665–674, Hyderabad, India, 2011. ACM.
- [6] T. Carnes, C. Nagarajan, S. M. Wild, and A. van Zuylen. Maximizing influence in a competitive social network: a follower’s perspective. In Proceedings of the 9th international conference on Electronic commerce, ICEC ’07, pages 351–360, Minneapolis, MN, USA, 2007. ACM.
- [7] D. Centola, V. Eguiluz, and M. Macy. Cascade dynamics of complex propagation. Physica A: Statistical Mechanics and its Applications, 374(1):449–456, 2007.
- [8] R. I. M. Dunbar. Neocortex size as a constraint on group size in primates. J. Human Evol., 22(6):469–493, 1992.
- [9] Y. Gandica, I. Bonalde, and J. L. Cabrera. Complex propagation on directed small world networks. Physica A: Statistical Mechanics and its Applications, 389(19):4172–4176, 2010.
- [10] J. Goldenberg, B. Libai, and E. Muller. Talk of the network: A complex systems look at the underlying process of word-of-mouth. Marketing Letters, 12(3):211–223, 2001.
- [11] D. Gruhl, R. Guha, D. Liben-Nowell, and A. Tomkins. Information diffusion through blogspace. In Proceedings of the 13th international conference on World Wide Web, WWW ’04, pages 491–501, New York, NY, USA, 2004. ACM.
- [12] B. Huberman, D. Romero, and F. Wu. Social networks that matter: Twitter under the microscope. First Monday, 14(1):8, 2009.
- [13] T. G. Kurtz. Solutions of ordinary differential equations as limits of pure Markov processes. Journal of Applied Probability, 7:49–58, 1970.
- [14] H. Kwak, C. Lee, H. Park, and S. Moon. What is twitter, a social network or a news media? In Proceedings of the 19th international conference on World wide web, WWW ’10, pages 591–600, New York, NY, USA, 2010. ACM.
- [15] J. Leskovec, L. Backstrom, and J. Kleinberg. Meme-tracking and the dynamics of the news cycle. In Proceedings of the 15th ACM SIGKDD international conference on Knowledge discovery and data mining, KDD ’09, pages 497–506. ACM, 2009.
- [16] K. Nahon, J. Hemsley, S. Walker, and M. Hussain. Blogs: spinning a web of virality. In Proceedings of the 2011 iConference, iConference ’11, pages 348–355, Seattle, Washington, 2011. ACM.
- [17] D. Sousa, L. Sarmento, and E. Mendes Rodrigues. Characterization of the twitter @replies network: are user ties social or topical? In Proceedings of the 2nd international workshop on Search and mining user-generated contents, SMUC ’10, pages 63–70, Toronto, ON, Canada, 2010. ACM.
- [18] M. Tomochi, H. Murata, and M. Kono. A consumer-based model of competitive diffusion: the multiplicative effects of global and local network externalities. Journal of Evolutionary Economics, 15(3):273–295, 08 2005.
- [19] R. M. Tripathy, A. Bagchi, and S. Mehta. A study of rumor control strategies on social networks. In Proceedings of the 19th ACM international conference on Information and knowledge management, CIKM ’10, pages 1817–1820, Toronto, ON, Canada, 2010. ACM.
- [20] D. J. Watts and S. H. Strogatz. Collective dynamics of ‘small-world’ networks. Nature, 393:440–442, 1998.
- [21] J. Yang and J. Leskovec. Patterns of temporal variation in online media. In Proceedings of the 4th ACM international conference on Web search and data mining, WSDM ’11, pages 177–186, Hong Kong, China, 2011. ACM.
- [22] H. P. Young. The dynamics of social innovation. Proc. Nat. Acad. Sci., to appear. doi: 10.1073/pnas.1100973108.