Constraining the optical emission from the double pulsar system J0737-3039
Abstract
We present the first optical observations of the unique system J07373039 (composed of two pulsars, hereafter PSR-A and PSR-B). Ultra-deep optical observations, performed with the High Resolution Camera of the Advanced Camera for Surveys on board the Hubble Space Telescope could not detect any optical emission from the system down to and . The estimated optical flux limits are used to constrain the three-component (two thermal and one non-thermal) model recently proposed to reproduce the XMM-Newton X-ray spectrum. They suggest the presence of a break at low energies in the non-thermal power law component of PSR-A and are compatible with the expected black-body emission from the PSR-B surface. The corresponding efficiency of the optical emission from PSR-A’s magnetosphere would be comparable to that of other Myr-old pulsars, thus suggesting that this parameter may not dramatically evolve over a time-scale of a few Myr.
1 INTRODUCTION
The binary system J07373039 is the first and (up to now) the only double-pulsar system ever detected (Burgay et al. 2003; Lyne et al. 2004). It is composed of PSR J07373039A (hereafter PSR-A) and PSR J07373039B (PSR-B), with spin periods of ms and s, respectively, orbiting each other with a hr period along a mildly eccentric () orbit.
Radio observations are providing the timing data for exploiting this formidable system to test General Relativity (Kramer et al. 2006, Kramer & Stairs 2008). Moreover, they led to the discovery of a wealth of unprecedented phenomena, like a short ( s) eclipse of the radio signal from PSR-A (modulated at full or half period of PSR-B) when it passes at the superior conjunction (McLaughlin et al. 2004) and a strong modulation of the flux density from PSR-B along the orbit (Lyne et al. 2004). The secular variations of these peculiar effects have been used to put constraints on the geometry of the system and on its evolution due to General Relativity (Burgay et al. 2005; Breton et al. 2008, Perera et al. 2010). On the other hand, they clearly demonstrate interaction between PSR-B’s magnetosphere and the spin-down luminosity released by PSR-A in the form of a relativistic wind of particles and Poynting flux In turn, this opens the possibility of probing the usually inaccessible magnetosphere and the local environment of a neutron star (e.g. Zhang & Loeb 2004; Lyutikov & Thompson 2005; Breton et al., in preparation).
Following the original detection with Chandra (McLaughlin et al. 2004), J07373039 has been repeatedly re-observed in the X-ray band (Pellizzoni et al. 2004; Campana et al. 2004; Kargaltsev et al. 2006; Chatterjee et al. 2007; Possenti et al. 2008; Pellizzoni et al. 2008, hereafter P08). As for the timing, these observations led to the detection of X-ray pulsations from both pulsars: PSR-A shows a double-peaked profile with a pulsed fraction along the entire orbit (Chatterjee et al. 2007), whereas PSR-B displays pulsations with a complex profile for (at least) a quarter of the orbit around the ascending node (P08). As for the spectroscopy, the phased-averaged X-ray spectrum can be satisfactorily fit by two-component models (a power-law plus a black body model, or a double black body model; see P08 and Possenti et al. 2008, respectively), while the phase-resolved spectrum is most likely described in terms of magnetospheric emission from PSR-A and thermal emission from both the polar caps of PSR-A and the bulk of the PSR-B surface, irradiated by its companion (P08). If confirmed, the latter model would represent an additional manifestation of the interaction between the PSR-A’s spin-down flux and the magnetosphere of PSR-B. Moreover, the study of the cold black-body component would allow one to shed light on long-standing questions in the physics and electro-dynamics of neutron stars, like the thermal inertia time of the surface and the degree of anisotropy (and the geometry) of the emission of the spin-down luminosity.
Given the unprecedented nature of the J07373039 system and the peculiarities shown in both the radio and X-ray bands, deep observations of the pulsar system in the optical domain are needed to complete the study of its phenomenology. In particular, optical observations of pulsars are crucial for constraining the tails of both thermal and non-thermal spectra observed in the soft X-ray regime and to unveil possible deviations (see Mignani 2011 for a recent review). Indeed, spectral breaks or turn-offs are found to be quite common in the thermal/non-thermal optical–to–X-ray spectra of pulsars (e.g. Mignani et al. 2010) and are crucial both to study anisotropies in the temperature distribution on the surface of the neutron star and to track the different energy and density distribution of particles in distinct regions of the pulsar magnetosphere, where the non-thermal optical and X-ray radiation is produced.
2 OBSERVATIONS AND DATA ANALYSIS
2.1 Description of the observations
The photometric data-set used for this work consists of deep, high-resolution images obtained with the High Resolution Channel (HRC) of the Advanced Camera for Surveys (ACS) on board the Hubble Space Telescope (HST). The HRC consists of one detector with a pixel-scale of and a field of view (FOV) of . The images have been obtained on 2005 July 20-21 (Prop. ID 10411, P.I. Ferraro) in ACCUM mode with a standard multi-point dithering pattern and in two different bands: six images through the F606W filter (Å; Å; roughly corresponding to the Johnson’s band) with an exposure time s each, and eight images through the F435W filter (Å; Å; corresponding to the Johnson’s band) with an exposure time s for six of them, and sec for the remaining two. Three short exposures of 10 s each were also acquired in the F606W band. We retrieved the data from the HST science data archive, after on–the–fly re-processing by the latest version (v.6.1.0) of the ACS data reduction pipeline (calacs), which applies bias and dark subtraction, overscan and flat-field correction, and photometry calibration using the most updated calibration files.
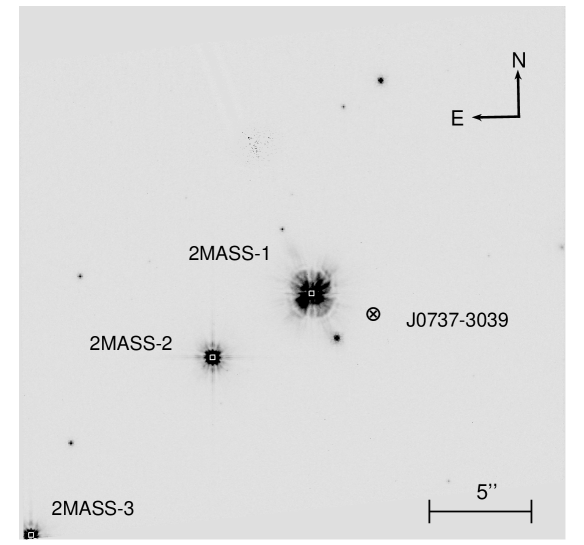
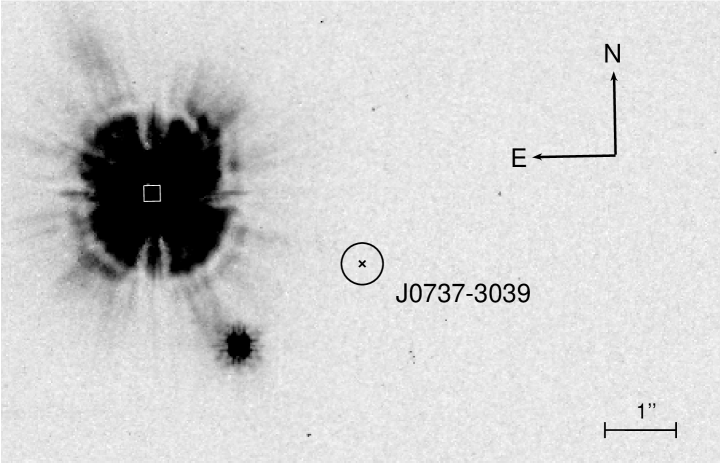
As shown in Figures 1 and 2, the pulsar system (with radio coordinates and ; Lyne et al. 2004) is located at only from a bright star ( according to the GSC2 catalogue; Lasker et al. 2008) also detected in the 2MASS survey (see Table 1). In order to prevent it to severely contaminate the pulsar region, we used the HRC coronograph to mask this object during the long exposure acquisition.
2.2 Astrometry
Partially due to the unaccounted proper motions of the reference stars, the absolute accuracy of the HST astrometry can be worse than the nominal value (). Hence, in order to precisely locate the pulsar system in the ACS/HRC frame we applied the following approach.
Since the brightest star is obscured by the coronograph in the long exposures, for the astrometric re-calibration of the HRC frame we used the three F606W short images. In particular, we used the drizzled (drz) images produced by the ACS data reduction pipeline, which are already corrected for the well known geometric distorsion affecting the HRC (Pavlovsky et al. 2005). By using the iraf tasks geomap and gregister we aligned the single images taking into account shifts and rotations and then, by using the iraf task imcombine, we combined them and applied a cosmic-ray rejection algorithm.
After a quick reduction aimed at just obtaining the instrumental coordinates of the stars, we cross-correlated our stellar list with the 2MASS point source catalogue (Skrutskie et al. 2006). Only three 2MASS stars have been identified within the FOV of our HRC observations (see Table 1 and Figs. 1 and 2), their positions (epoch 2000.0) being systematically offset with respect to the default HST astrometry by an average value of and , of the same order of magnitude as found in previous works (e.g., Ferraro et al. 2001). The image was thus registered on the 2MASS astrometric grid, which is tied to the international celestial reference frame to better than 015 (Skrutskie et al. 2006). Note that the brightest star (2MASS-1) in the FOV has a measured proper motion: mas yr-1 and mas yr-1 in the UCAC2 catalogue (Zacharias et al. 2004), and mas yr-1 and mas yr-1 in the recently released PPMXL catalogue (Roeser et al. 2010). This proper motion would only yield a small displacement (of the order of ) between the epoch of the 2MASS positions (2000.0) and that of our observations (2005.55). Taking into account the rms of the coordinate difference and the uncertainty introduced by the proper motion of star 2MASS-1, we adopt as a conservative estimate of the global position error of our astrometry. The resulting location of the pulsar system in the ACS/HRC frame is shown in Figs. 1 and 2: it turns out to be ( west and south) away from the bright star 2MASS-1. We note that the pulsar proper motion, mas yr-1 mas yr-1, only yields a negligible displacement during the 2 year difference between the epoch of the reference radio position and that of our HST observations.
2.3 Photometry
In order to search for even the faintest sources, we performed the photometric analysis on the median images, by applying to the long exposures in each filter the same procedure described above. At the end of the procedure, no object could be detected by eye at the pulsar position, neither in the F606W nor in the F435W images.
For a more reliable and deeper search of any possible counterpart, we estimated the observational detection limit, i.e. the minimum counts over the background level that the PSF peak of the faintest star should have to be successfully detected by the threshold criterium. To this end, we first determined the local background level and its standard deviation () in a region centered on the nominal pulsar system position. Indeed this is a critical task in this particular case, since the extended wings of star 2MASS-1 may affect the local background level, despite the use of the coronograph. Following a standard approach, the number of counts corresponding to was adopted as the observational detection limit. We then performed a very accurate photometric analysis around the nominal position of the pulsar by using romafot (Buonanno et al. 1983), a semi-automatic package that models even complex PSFs through an analytic function (Moffat, Gaussian, etc.) combined with a numerical residual matrix, and that allows a visual inspection of the quality of the fit. In each filter, we first determined the shape of the PSF by modeling five bright and non saturated stars in the HRC FOV, by using a Moffat function combined with the numerical residual matrix. We then used such a PSF to search for sources at more than in a region centered on the pulsar system position. No signal was found above this limit even when applying a Gaussian smoothing to the images over a pixel cell. We therefore conclude that J07373039 is undetected in our ACS/HRC images.
The magnitude of the faintest detectable object has been computed as the magnitude of a star having the adopted PSF and a number of counts at peak equal to . By adopting the Charge Transfer Efficiency correction (Maybhate et al. 2010) and the absolute flux calibration (from the updated PHOTFLAM coefficients available in the most recent synphot tables maintained at StScI) our upper limits turned out to correspond to and in the STmag photometric system.111As a sanity check, we used the empirical PSF to simulate two artificial stars of different magnitude ( and 28.3) directly in the images, at the nominal position of the pulsar system. By re-performing the entire photometric analysis on these images, we found that only the brighter star could be successfully detected and measured.
We finally transformed these magnitude limits into upper limits to the unabsorbed spectral flux. To do this, we first evaluated the extinction in the direction of the pulsar system, by using the relation of Predehl & Schmitt (1995) between the hydrogen column density and the extinction coefficient . While this relation is affected by uncertainties for close objects, due to the problems of modeling the interstellar medium at small distance from the Sun where microstructures weight more, we checked that, when using, e.g., the relation of Paresce (1984), the resulting extinction corrections are consistent within 0.01 magnitudes. Assuming cm-2 (P08)222The quoted uncertainties in translates in a 0.08 mag uncertainty in . and , we obtained a colour excess . This was used to compute the extinction coefficients appropriate for the central wavelength of the adopted filters (Fitzpatrick 1999), thus obtaining and . Using the standard relation for the STmag system (mag), we obtained the monochromatic fluxes erg cm-2 s-1 Å-1 and erg cm-2 s-1 Å-1. The corresponding quantities in units of the frequency have been obtained by considering the effective wavelength of the two pass-bands: Å and Å. Finally, according to standard unit conversions (e.g. Zombeck 2007), we derived the values of the unabsorbed spectral fluxes keV cm-2 s-1 keV-1, and keV cm-2 s-1 keV-1.
3 DISCUSSION
The derived upper limits to the optical flux in the F435W and F606W filters can be used to characterize the optical emission of the J07373039 system (§3.3), as well as to constrain the spectral model used to fit the X-ray data (§3.2), which is also briefly reported below (§3.1) for the sake of clarity (a detailed discussion of the X-ray spectra of the system is given in P08).
3.1 The X-ray spectrum
By exploiting deep XMM-Newton observations performed on October 2006, P08 could perform phased-resolved spectroscopy of J07373039 and found that a model with three components, a power law (PL) and two black-bodies (BBs), is required to fit both the phase-resolved spectra and the energy dependence of the pulsed fraction of PSR-A. According to this model, the PL (with photon index ) is responsible for most of the pulsed emission originating in the magnetosphere of PSR-A (e.g. Zhang & Cheng 1999; Zhang & Harding 2000). The hotter and fainter BB (HBB, with eV) has a m emitting radius 333The quoted radii of the BB components have been obtained by P08 under the assumption of a distance of 0.5 kpc, inferred from the dispersion measure of the two pulsars (Lyne et al. 2004) and a model for the distribution of electrons in the Galaxy (Cordes & Lazio 2002). We used this distance as a reference value. Within the uncertainties in spectral modeling and fitting, the resulting parameters are compatible with those derived from the still preliminary determinations of the annual geometric parallax of the system (0.2-1 kpc, Kramer et al 2006; kpc, Deller et al. 2009). and it is likely associated with the polar caps of PSR-A, re-heated by back-flowing particles accelerated in its magnetosphere (e.g. Cheng & Ruderman 1980; Arons 1981; Zavlin & Pavlov 1998; Zavlin 2006; Bogdanov 2006). The colder and brighter BB (CBB, with eV) is associated with an emitting radius of km and plausibly arises from the bulk of the surface of one of the two neutron stars. The most likely explanation is that it is due to thermal radiation coming from the bulk of PSR-B’s surface, after the conversion of of the spin-down luminosity of PSR-A intercepted by PSR-B at suitable orbital phases (see e.g. Zhang & Loeb 2004; Lyutikov & Thompson 2005). This is also consistent with the observed soft pulsed flux from PSR-B (P08).
3.2 Optical vs. X-rays
In order to use the derived optical flux upper limits for constraining the spectral model discussed above and getting new clues on the physics of the system, it is necessary to extrapolate the PL and BB components into the optical domain. In agreement with the evidence found in the optical spectra of a few Myr old pulsars (Mignani 2011), a contribution in the optical band from the magnetospheric emission can be expected. Since PSR-A’s spin-down energy is times higher than PSR-B’s one ( erg s-1; erg s-1; Lyne et al. 2004), we assume that the former would dominate any magnetospheric optical emission from the system, as it does in the X-rays. On the other hand, we note that the actual broad-band spectrum of PSR-A is, in principle, compatible with comptonised BB models (see e.g. Nishimura et al. 1986), which are not expected to provide a non-thermal contribution at optical wavelengths. While further X-ray observations are required to improve the photon count statistics and constrain complex multi-component phase-resolved spectral models (including comptonisation scenarios), here we conservatively take into account the possibility of a contribution of the non-thermal component even at low energies.
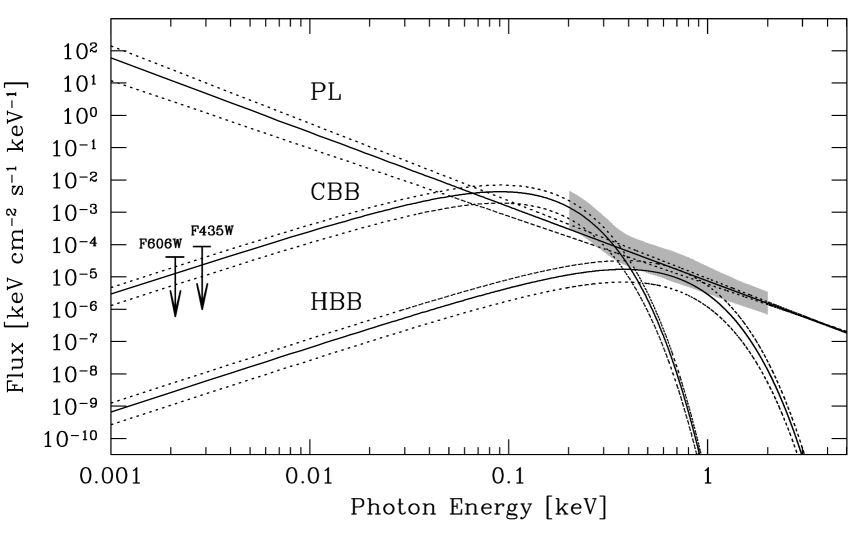
The extrapolation of the PL and BB components into the optical domain is shown in Fig. 3, together with the optical flux upper limits computed in §2.3. While the expected contribution of the HBB is at least four orders of magnitude lower than the derived optical values, the extrapolation of the CBB component only slightly undershoots the optical flux upper limits, the difference being smaller than a factor of 10 after accounting for the 90% confidence level uncertainty of the spectral parameters. Finally, the extrapolated non-thermal PL component of the X-ray spectrum overshoots the optical flux upper limits by about six orders of magnitude.
As a first consideration, our optical upper limits indicate that either the PSR-A magnetosphere does not provide a non-thermal contribution at low energies (as expected in the comptonised BB model), or a break at these wavelengths is present.444Note that if the X-ray PL component was extrapolated to optical wavelengths with the same index, it would imply an emitted power in the optical band which is a significant fraction (0.1-0.2) of the measured PSR-A’s spin-down luminosity, in striking contrast with what observed so far in the pulsar population (see §3.3). This argument further supports the presence of a spectral break between the optical and the X-ray domains. Indeed, such breaks are quite common in the optical–to–X-ray magnetospheric spectra of pulsars above a wide age range (e.g., Mignani et al. 2010) and are probably indicators of a complex particle density and velocity distribution in the neutron star magnetosphere. However, in order to be compatible with the expected optical emission from the CBB component (see Fig. 3), the expected spectral break in PSR-A’s spectrum has to be very sharp if it occurs at energies lower than keV.
In the case of a null or negligible optical contribution of the PL component, the fact that the measured upper limits are consistent with the expectations from the combined BB components represents a partial validation of the model and the adopted spectral parameters.
By neglecting the contribution of PSR-A’s polar caps (i.e., the HBB component), the comparison between the optical upper limits and the expected CBB contribution more quantitatively suggests that the PSR-A’s magnetospheric optical emission cannot exceed the surface thermal emission from PSR-B by a factor larger than . Conversely, by assuming that the PL spectral break is such to make any magnetospheric optical emission negligible with respect to the thermal one, we can derive a qualitative upper limit to the temperature of the bulk of PSR-A surface (i.e. away from the hot polar caps) to account for the possible flux excess with respect to the expected CBB contribution. For instance, in order to be compatible with the non-detection of a third BB component (cooler than the CBB) in the observed X-ray spectrum, for an emitting radius of 15 km, the bulk of PSR-A surface should be at a temperature eV. This is consistent with its spin-down age ( Myr) and a passive cooling scenario.
Spectral data in the ultraviolet would be useful to constrain the presence and energy of a break at low energy in the PL spectrum of PSR-A, as well as the temperature of the CBB component produced by PSR-B. Unfortunately, J07373039 has not been observed by GALEX (Martin et al. 2005) and the XMM-Newton Optical/UV monitor camera (Mason et al. 2001) has been used only in the band, while the relatively recent discovery of the system prevented its observation within the pulsar survey carried out by EUVE (Korpela & Bowyer 1998).
3.3 Optical emission efficiency
The F606W upper limit corresponds to an extinction-corrected optical luminosity for the pulsar system erg s-1 (where is its distance in units of 500 pc), with a uncertainty due to the error on the extinction correction computed from (see §2.3). In the limit case that PSR-A’s emission is mostly magnetospheric, and under the assumption that its contribution to is at most a factor of 5 larger than that of the PSR-B’s thermal emission (see above), we can derive the optical emission efficiency: .
Such a value of implies that the optical emission efficiency of PSR-A might still be compatible with that of most pulsars with strong magnetospheric emission (e.g., Zharikov et al. 2006), accounting for the uncertainties on the distance and for the difference in the reference spectral band555The efficiencies quoted in Zharikov et al. (2006) are computed in the B band.. This might indicate that the optical emission efficiency does not dramatically evolve with the pulsar’s spin-down age and remain relatively high for pulsars as old as Myr, like PSR-A (Lorimer et al.2007). Unfortunately, given the small number of pulsars identified in the optical domain, of which only a handful are older than 1 Myr (see Mignani 2011), it is very difficult to outline a clear evolutionary pattern. For instance, for the 3 Myr old PSR B1929+10 (Mignani et al. 2002) the optical luminosity, if entirely magnetospheric, would imply , i.e. above the upper limit derived for PSR-A. Under the same assumption, for the Myr old PSR B1133+16 (Zharikov et al. 2008) and for the 17 Myr old PSR B0950+08 (Zharikov et al. 2004) we derive and , respectively, while for the 166 Myr old PSR J01081431 (Mignani et al. 2008; 2011), whose optical identification is however unconfirmed, would be as high as .
Surprisingly enough, these values are comparable to those of much younger and brighter pulsars, like the Crab and PSR B054069. However, we warn here that, while the optical emission of young pulsars is entirely magnetospheric (e.g., Mignani et al. 2010), that of the old pulsars partially (if not entirely) arises from the neutron star surface. Thus, the above quoted values of are rather uncertain, and optical spectra would be needed to disentangle the contributions of the magnetospheric and thermal components. Indeed, in the case of PSR J01081431, whose spin-down age is comparable to that of PSR-A, the optical spectrum of its (candidate) counterpart is compatible with the Rayleigh-Jeans tail of a eV BB for a 13 km neutron star radius (Mignani et al. 2008; 2011), implying that the bulk of the optical emission arises from the neutron star surface and that the actual emission efficiency is much lower than . On the other hand, since PSR-A has a times larger spin-down energy, its magnetospheric emission is probably much stronger than that of PSR J01081431 and, possibly, it is dominant over the thermal component. Thus, the derived luminosity upper limits do not rule out that the (yet undetected) optical emission from the pulsar system could be of magnetospheric origin and almost entirely associated with PSR-A.
4 Summary and conclusions
We performed the first ever follow-up optical observations of the J07373039 system. Our deep ACS/HRC observations could not detect optical emission from the system down to limiting magnitudes of and , corresponding to upper limits to the unabsorbed spectral fluxes keV cm-2 s-1 keV-1 and keV cm-2 s-1 keV-1. In the framework of the PL+2BB model that best fits the XMM-Newton spectrum (P08), the derived flux upper limits suggest a break at low energies in the PL component, similar to what observed in other pulsars (e.g., Mignani et al. 2010), and are consistent with the BB temperature and emitting area of PSR-B. The upper limit to the optical luminosity of the pulsar system ( erg s-1) implies that the optical emission efficiency of PSR-A, which has the highest spin-down power, would be comparable to that of Myr-old pulsars, suggesting that their optical magnetospheric emission does not dramatically evolve over a time-scale of a few Myr. Deep observations in the ultraviolet with the HST and its refurbished instrument suite will probably offer higher chances of detection and, thus, of better constraining the thermal spectrum of PSR-B and the magnetospheric spectrum of PSR-A.
References
- Arons (1981) Arons, J., 1981, ApJ, 248, 1099
- Breton et al. (2008) Breton, R.P., et al., 2008, Science, 321, 104
- Bogdanov (2006) Bogdanov, S., 2006, AAS/AAPT Joint Meeting, American Astronomical Society Meeting 209, Bulletin of the American Astronomical Society, Vol. 38, p.1065
- Buonanno et al. (1983) Buonanno, R., Buscema, G., Corsi, C. E., Ferraro, I., & Iannicola, G. 1983, A&A, 126, 278
- Burgay et al. (2003) Burgay, M., et al. 2003, Nature, 426, 531
- Burgay et al. (2005) Burgay et al. 2005, ApJ, 624, L113
- Chatterjee et al. (2007) Chatterjee, S., Gaensler, B.M., Melatos, A., Brisken, W.F., Stappers, B.W., 2007, ApJ, 670, 1301
- Cheng et al. (1980) Cheng, A.F., Ruderman, M.A., 1980, ApJ, 235, 576
- Campana et al. (2004) Campana, S., Possenti, A., Burgay, M., 2004, ApJ, 613, L53
- Cordes and Lazio (2002) Cordes, J. M., & Lazio, T. J. W. 2002, arXiv:astro-ph/0207156
- Deller et al. (2009) Deller, A.T., Bailes, M., Tingay, S.J., 2009, Science, 323, 1327
- Ferraro et al. (2001) Ferraro, F.R., D’Amico N., Possenti, A., Mignani, R.P., Paltrinieri, B., 2001, ApJ, 561, 337
- Fitzpatrick (1999) Fitzpatrick, E. L. 1999, PASP, 111, 63
- Kargaltsev et al. (2006) Kargaltsev, O., Pavlov, G.G., Garmire, G.P., 2006, ApJ, 646, 1139
- Korpela et al. (1998) Korpela E. J., Bowyer S., 1998, AJ, 115, 2551
- Kramer et al. (2006) Kramer, M., et al., 2006, Science, 314, 97
- Kramer et al. (2008) Kramer, M., & Stairs, I.H., 2008, ARA&A, 46, 541
- Lasker et al. (2008) Lasker, B.M., et al., 2008, AJ, 136, 735
- Lyutikov et al. (2005) Lyutikov, M. & Thompson, C., 2005, ApJ, 634, 1223
- Lyne et al. (2004) Lyne, A. G., et al. 2004, Science, 303, 1153
- Lorimer et al. (2007) Lorimer, D. et al. 2007, MNRAS, 379, 1217
- Maybhate et al. (2010) Maybhate, A., et al. 2010, ACS Instrument Handbook, Version 10.0 (Baltimore: STScI).
- Martin et al. (2005) Martin D. C., et al., 2005, ApJ, 619, L1
- Mason et al. (2001) Mason, K.O., Breeveld, A., Much, R., et al., 2001, A&A, 365, L36
- McLaughlin et al. (2004) McLaughlin et al., 2004, ApJ, 616, L131
- Mignani (2011) Mignani, R. P. 2011, Advances in Space Research, 47, 1281
- Mignani et al. (2002) Mignani, R. P., De Luca, A., Caraveo, P. A., & Becker, W. 2002, ApJ, 580, L147
- Mignani et al. (2008) Mignani, R. P., Pavlov, G. G., & Kargaltsev, O. 2008, A&A, 488, 1027
- Mignani et al. (2010) Mignani, R.P., Sartori, A., De Luca, A., et al., 2010, A&A, 515, 110
- Mignani et al. (2011) Mignani R. P., Pavlov, G. G., Kargaltsev, O., 2011, A&A, 531, 105
- Nishimura et al. (2006) Nishimura, J., Mitsuda, K, Itoh, M., 1986, PASJ, 38, 819
- Paresce (1984) Paresce, F. 1984, AJ, 89, 1022
- Pavlovsky et a. (2005) Pavlovsky, C., et al., 2005, ”ACS Data Handbook”, Version 4.0, (Baltimore: STScI)
- Pellizzoni et al. (2004) Pellizzoni, A., De Luca, A., Mereghetti, S., Tiengo, A., Mattana, F., Caraveo, P., Tavani, M., & Bignami, G. F. 2004, ApJ, 612, L49
- Pellizzoni et al. (2008) Pellizzoni, A., Tiengo, A., De Luca, A., Esposito, P., & Mereghetti, S. 2008, ApJ, 679, 664 (P08)
- Perera et al. (2010) Perera, B.B.P., et al., 2010, ApJ, 721, 1193
- Possenti et al. (2008) Possenti, A., Rea, N., McLaughlin, M. A., Camilo, F., Kramer, M., Burgay, M., Joshi, B. C., & Lyne, A. G. 2008, ApJ, 680, 654
- Predehl & Schmitt (1995) Predehl, P., & Schmitt, J. H. M. M. 1995, A&A, 293, 889
- Roeser et al. (2010) Roeser, S., Demleitner, M., & Schilbach, E. 2010, AJ, 139, 2440
- Skrutskie et al. (2006) Skrutskie, M. F., et al. 2006, AJ, 131, 1163
- Zacharias et al. (2004) Zacharias, N., Urban, S. E., Zacharias, M. I., Wycoff, G. L., Hall, D. M., Monet, D. G., & Rafferty, T. J. 2004, AJ, 127, 3043
- Zavlin (2006) Zavlin, V.E., 2006, ApJ, 638, 951
- Zavlin et al. (1998) Zavlin, V.E., & Pavlov, G.G., 1998, A&A, 329,583
- Zhang et al. (1999) Zhang, L., & Cheng, K.S., 1999, ApJ, 526, 327
- Zhang et al. (2000) Zhang, B., & Harding, A.K., 2000, ApJ, 532, 1150
- Zhang et al. (2006) Zhang, B., & Loeb, A., 2006, ApJ, 614, L53
- Zharikov et al. (2004) Zharikov, S. V., Shibanov, Y. A., Mennickent, R. E., Komarova, V. N., Koptsevich, A. B., & Tovmassian, G. H. 2004, A&A, 417, 1017
- Zharikov et al. (2006) Zharikov, S., Shibanov, Y., & Komarova, V. 2006, Advances in Space Research, 37, 1979
- Zharikov et al. (2008) Zharikov, S. V., Shibanov, Y. A., Mennickent, R. E., & Komarova, V. N. 2008, A&A, 479, 793
- Zombeck (2007) Zombeck, M. 2007, Handbook of Space Astronomy and Astrophysics: Third Edition, by Martin Zombeck. ISBN-10 0-521-78242-2 (HB); ISBN-13 781-0-521-78242-5 (HB). Published by Cambridge University Press, Cambridge, UK, 2007
| NAME | R.A. | Dec. |
|---|---|---|
| (J2000) | (J2000) | |
| 2MASS-1 | 07 37 51.48 | -30 39 39.57 |
| 2MASS-2 | 07 37 51.85 | -30 39 43.41 |
| 2MASS-3 | 07 37 52.51 | -30 39 54.05 |