-titleHadron Collider Physics Symposium 2011 11institutetext: Max-Planck-Institut für Physik, Föhringer Ring 6, 80805 München, Germany
Hard QCD Results with Jets at the LHC
Abstract
Hard QCD results in proton-proton collisions at with jets from data recorded up to the end of 2010 by the CMS and ATLAS experiments at the LHC are reported. Inclusive jet and di-jet cross section measurements as well as observables sensitive to multi-jet activity are shown and compared to simulations based on leading log parton showers as well as NLO QCD predictions. Novel approaches to identify highly boosted massive final states by exploiting the jet substructure are tested on the dominant QCD background.
1 Introduction
The ATLAS art:ATLAS and CMS art:CMS experiments both have rich QCD programs involving high jets aiming to probe the structure of the colliding protons, to measure the strong coupling constant and to test the standard model (SM) at the shortest distance scales accessible today in the high-center-of-mass proton-proton collisions of the LHC. Furthermore deviations from the SM would indicate the presence of new physics beyond the SM. The datasets recorded up to the end of 2010 and corresponding to integrated luminosities of per experiment have been used by ATLAS and CMS to update their measurements of inclusive jet and di-jet cross sections, as well as to measure multi-jet and angular di-jet distributions. New methods based on the sub-structure of jets to detect heavily boosted massive objects ending up in single jets at the LHC have also been tested on the dominant QCD background and compared to expectations.
2 Jet reconstruction and calibration
The infrared- and collinear-safe Anti- jet clustering algorithm art:antiKt is used by both experiments in the inclusive reconstruction mode with distance parameters . Input to the jet algorithm are 4-vectors stemming either from stable particles in generator-level simulations, partons in NLO calculations, topological calorimeter clusters art:TopoCluster ; art:ATLASPerf in ATLAS or particle flow (PF) objects art:ParticleFlow ; art:ParticleFlowII in CMS in full simulations and data. Topological clusters can be calibrated prior to the jet making art:ATLASPerf in ATLAS or left at the electromagnetic (EM) scale. The PF objects use information from all CMS subsystems and are calibrated to correspond to stable particles like ’s, leptons, charged and neutral hadrons. In all cases residual jet-level corrections are needed to account for particle losses not detectable on cluster or PF object level art:CMSJES ; art:ATLAS-CONF-2011-032 with larger corrections (up to a factor of ) for EM-scale inputs and small corrections (on the level of ) for already calibrated inputs. The jet-level calibrations are Monte Carlo (MC) based correction functions in and . Jet energy scale (JES) and uncertainty are validated with in-situ methods using balance in di-jet and -jet events and the momentum projection fraction method in -jet events. The Monnte Carlo based correction factors are validated with single particle test-beam data and measurements of isolated hadrons in collision data which are then extrapolated using fragmentation predictions to the jet-level. The systematic JES uncertainty is typically for both ATLAS and CMS over a large range of pseudo-rapidities and , with the larger values at large , very low and very high .
3 Inclusive jet cross section measurements
The inclusive jet cross section is measured by ATLAS art:ATLAS-CONF-2011-047 and CMS art:PhysRevLett.107.132001 as a function of transverse jet momentum and jet rapidity . The data is corrected bin-by-bin for migration effects in due to the steeply falling spectrum in and the finite
resolution.
In CMS the corrected spectra are obtained by fitting a modified power-law function with Gaussian smearing in to the observed spectra. In ATLAS the correction factors are obtained from full detector simulations including detector inefficiencies. Typical corrections are in the range but can extend to at the edges of the phase space. The NLO perturbative QCD (pQCD) predictions on parton-level on the other hand are corrected for non-perturbative (NP) effects due to hadronisation and the underlying event activities. These corrections are obtained by comparing simulations with leading log generators (PYTHIA/HERWIG) which are run with and without these effects enabled. The corrections depend strongly on jet size. For the underlying event effects dominate and corrections are around at small . For hadronisation effects are dominant and corrections of about are obtained at low . The corrections approach unity at larger for all used values.
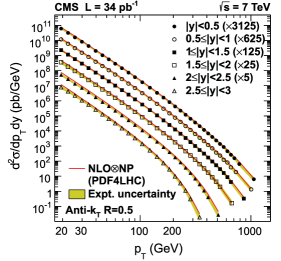
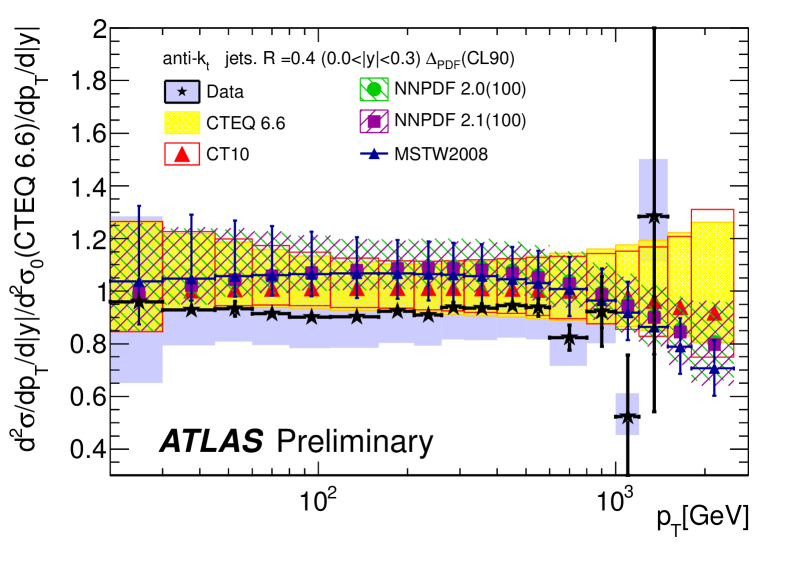
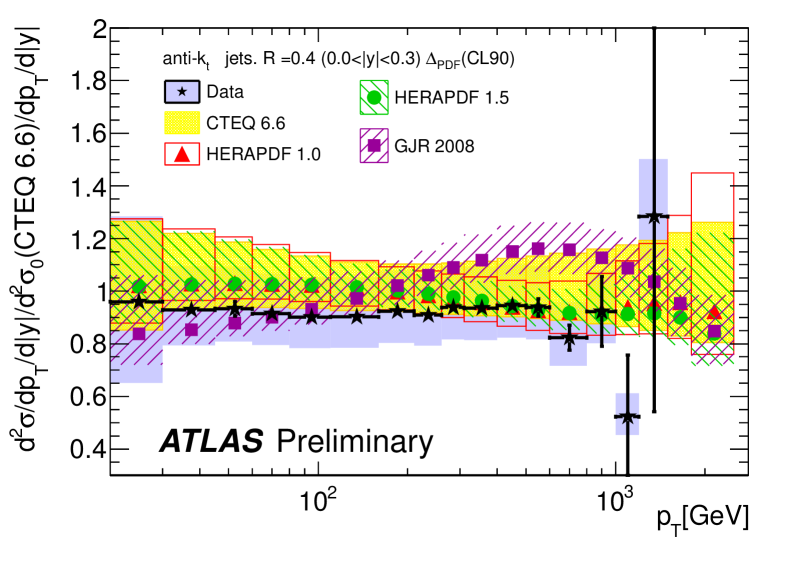
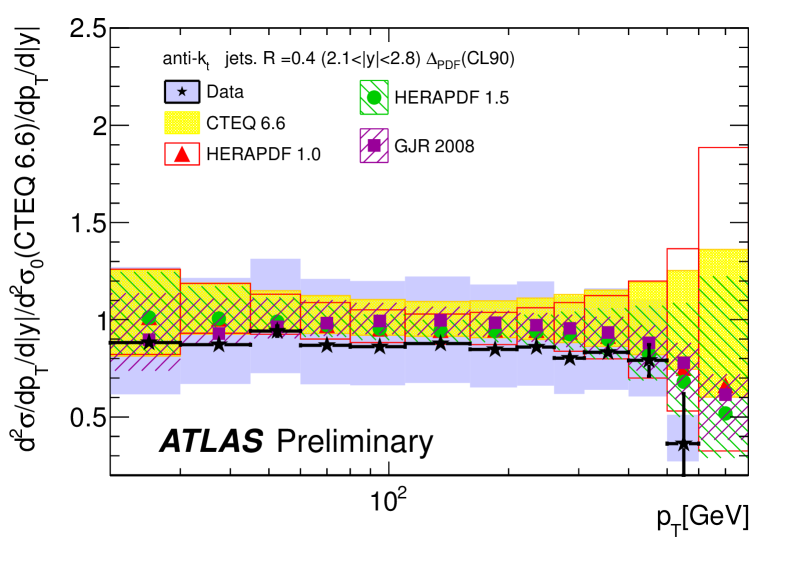
Figure 1 (left) shows the inclusive jet cross section measurement for jets with size as a function of jet transverse momentum measured by CMS. The experimental uncertainties are in the range and are dominated by the uncertainties on JES and resolution. Similar distributions for and are obtained by ATLAS, with uncertainties in the range of . Different NLO predictions are tested art:ATLAS-PHYS-PUB-2011-005 ; art:CMS-NOTE-2011-004 by comparing the ratios of data to NLO MC predictions for various PDF sets. Figure 2 shows an example from ATLAS for the rapidity region for and . CMS obtains similar comparisons for . The NLO predictions are in general systematically above the data but still compatible with the measurement within the assigned uncertainties. The deviations become larger at large and .
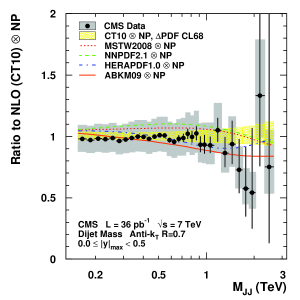
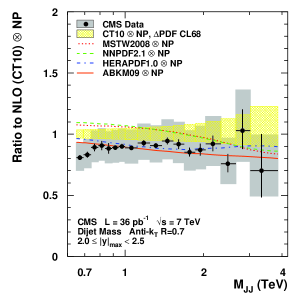
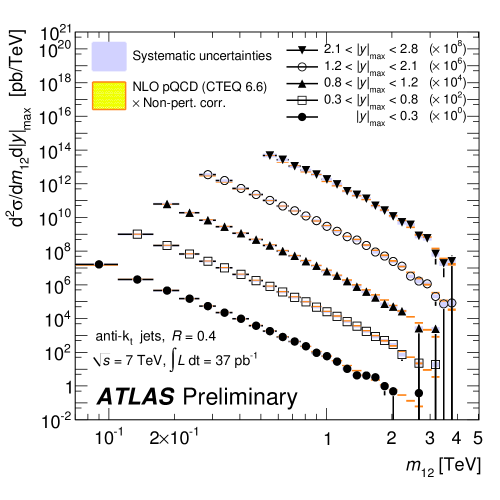
The double differential cross section in the maximum jet rapidity and di-jet mass for di-jet events as measured by ATLAS art:ATLAS-CONF-2011-047 is shown in Figure 1 (right) for . Similar results are obtained by CMS art:CMS-QCD-10-025 for . Both ATLAS and CMS use full simulations to obtain the bin-by-bin migration corrections for the distributions. Dominant experimental systematic uncertainties stem from the JES uncertainty and are in the range of for ATLAS and around at low masses and at high masses for CMS. As is the case for the inclusive jet cross section measurement a comprehensive comparison to NLO pQCD predictions has been made by both ATLAS art:ATLAS-CONF-2011-047 and CMS art:CMS-NOTE-2011-004 . Figure 3 shows the ratio of the measured double differential di-jet cross section to that predicted in CT10-based MC simulation for two rapidity bins. The agreement with HERAPDF is best, but all tested PDF sets agree within uncertainties.
4 Angular and multi-jet variables
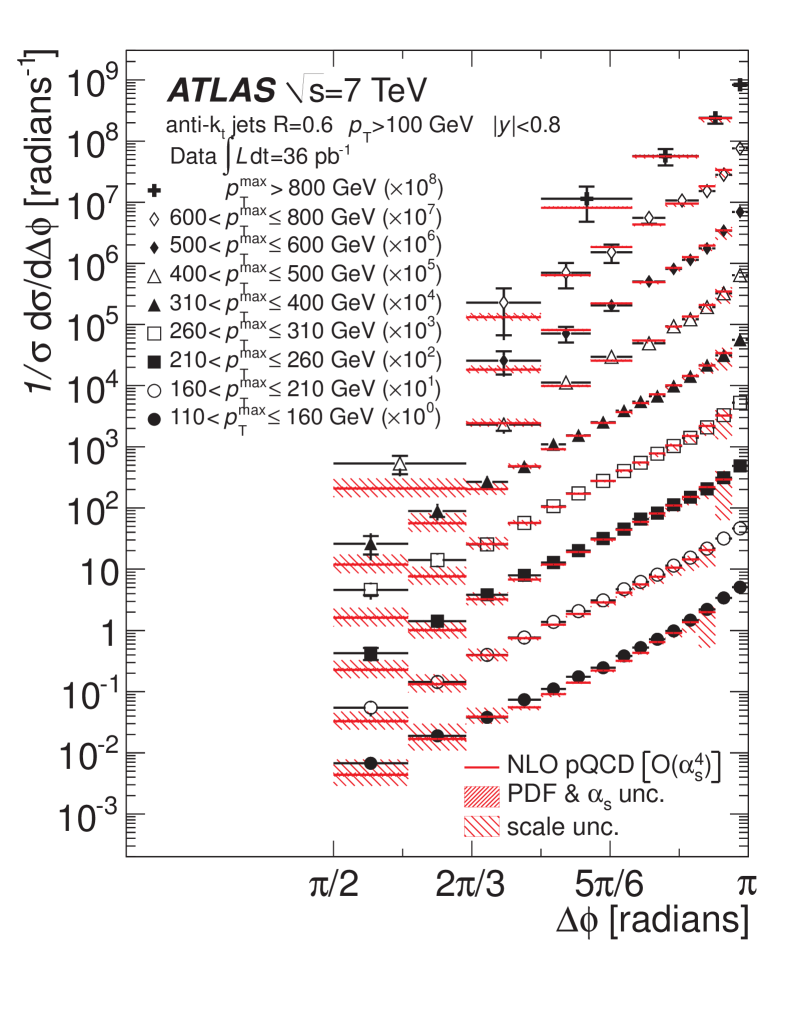
Due to their sensitivity to new physics and their ability to probe mass scales without explicitly relying on JES calibrations the angular distributions of multi-jet events are of particular interest. The azimuthal de-correlation of the two most energetic jets as measured by ATLAS art:ATLAS-DiJet-DeltaPhi is shown in the left plot of figure 4. Values close to are expected for di-jet events while smaller values indicate the presence of additional jets. NLO pQCD calculations using NLOJet++ and MSTW 2008 agree with the data for . Leading log simulations (PYTHIA, HERWIG, SHERPA agree with the data and give a good description of the perturbatively diverging point . The right side plot of figure 4 shows the distribution of , the exponential of the rapidity difference between the two leading jets in , as measured by CMS art:CMS-dijet-angular for different di-jet mass intervals. The distribution in is expected to be almost flat for QCD while new physics (such as quark compositeness) would cause excess events at small . The comparison to NLO pQCD calculations with NLOJet++ and the CTEQ 6.6
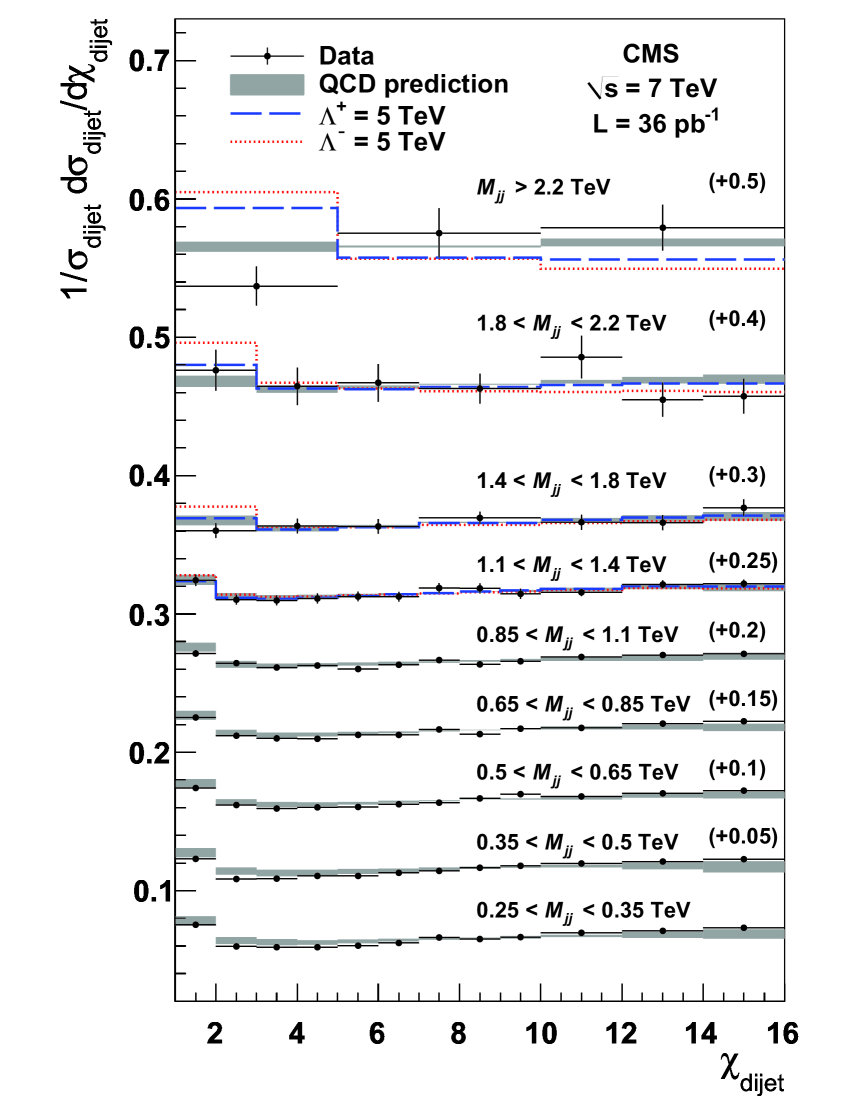
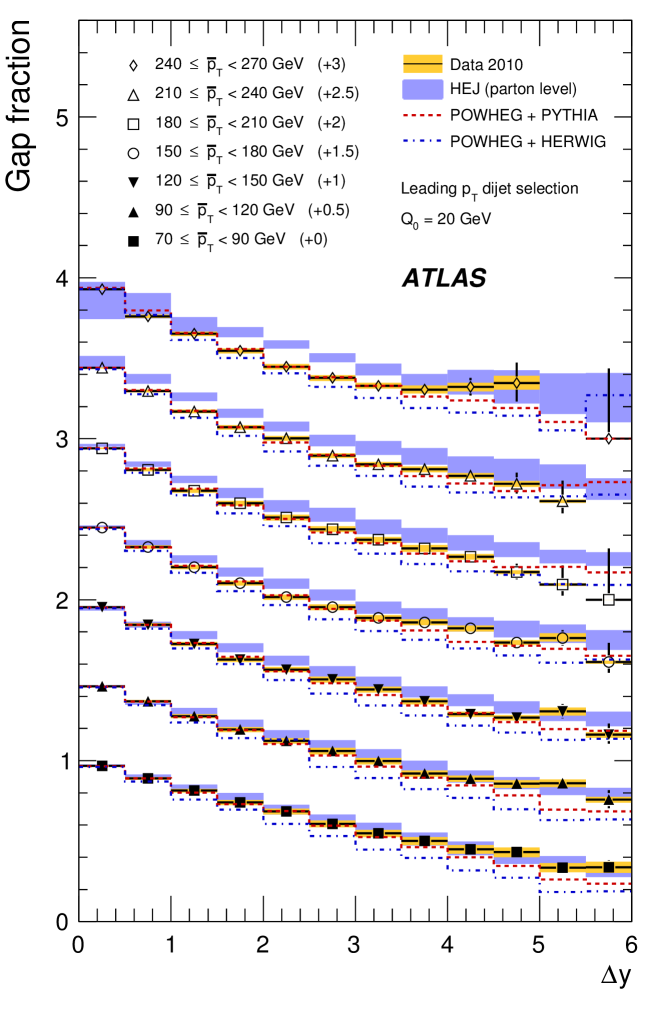
PDF-set shows good agreement with the data, and a lower limit on the contact interaction scale for left-handed quarks of () for destructive (constructive) interference has been obtained at CL. A complementary study of the rapidity gap between the two jets with either leading or the largest rapidity gap has been done by ATLAS art:ATLAS-rapidity-gap . The so-called gap-fraction is defined as the fraction of events without additional jet activity in the rapidity interval between the two jets. Any additional jet within the gap has to have a transverse momentum above a veto scale , with the default choice to stay far away from . The gap-fraction is shown in the left plot of figure 5 for the choice of leading jets in as a function of for various intervals of the average transverse momentum of the two leading jets . The comparison with HEJ calculations shows some deviations in the large regions but the agreement improves as approaches , which is expected since HEJ is designed to give a good description of QCD in the limit where all jets have similar . The best description is achieved with POWHEG interfaced to PYTHIA although deviations are observed at large . POWHEG interfaced to HERWIG tends to predict smaller gap fractions over the full phase space and the deviations increase for larger as for the POWHEG+PYTHIA case.
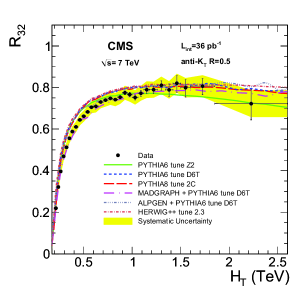
The right hand plot in figure 5 shows the cross section ratio of three-jet over two-jet events as a function of the total transverse momentum sum as measured by CMS art:CMS-R32 . Many systematic uncertainties such as those due to the JES and the jet selection efficiency largely cancel in this ratio, while the uncertainty due to the integrated luminosity vanishes entirely. Therefore provides a stringent test of QCD predictions. Events with two or more Anti- jets with with and and are selected and compared to various PYTHIA6, PYTHIA8 and HERWIG++ based tunes and to simulations using the multi-parton final state generators MADPGRAPH and ALPGEN interfaced to PYTHIA6. All predictions describe the observed ratio well in the region but, with the exception of MADPGRAPH, overshoot between at lower .
5 Jet mass and sub-structure
In the high energy regime of LHC, heavy objects with masses , can receive large Lorentz boosts such that their decay products are measured in a single jet. Several approaches are considered to explore the sub-structure of these jets with the aim to identify such heavy objects. Among them are:
- C/A filtering:
-
The clustering of large () Cambridge-Aachen (C/A) art:CambridgeAachen type jets is reversed until a large drop in jet-mass is observed. The remaining constituents are re-clustered with a smaller parameter.
- Jet pruning:
-
C/A or art:Kta ; art:Ktb jet-clustering is performed on the constituents of a large jet and in each clustering step the softer of the two clusters being combined is discarded if it’s transverse momentum is below a certain fraction of the original jet and the angular distance between the two clusters is large.
For the jet sub structure algorithms to be useful they have to be tested on QCD jets as this will be the main background. C/A Filtering is useful for the decays of heavy particles to two low mass objects and the QCD behavior has been studied in ATLAS in art:ATLAS-CONF-2011-073 . The mass drop of the leading subjet is required to be smaller than (light subjet) and the asymmetry larger than (fairly symmetric). Once a reversed clustering step with these properties is found the current jet is re-clustered with C/A and finding new subjets of which the leading are combined to give the final C/A filtered jet.
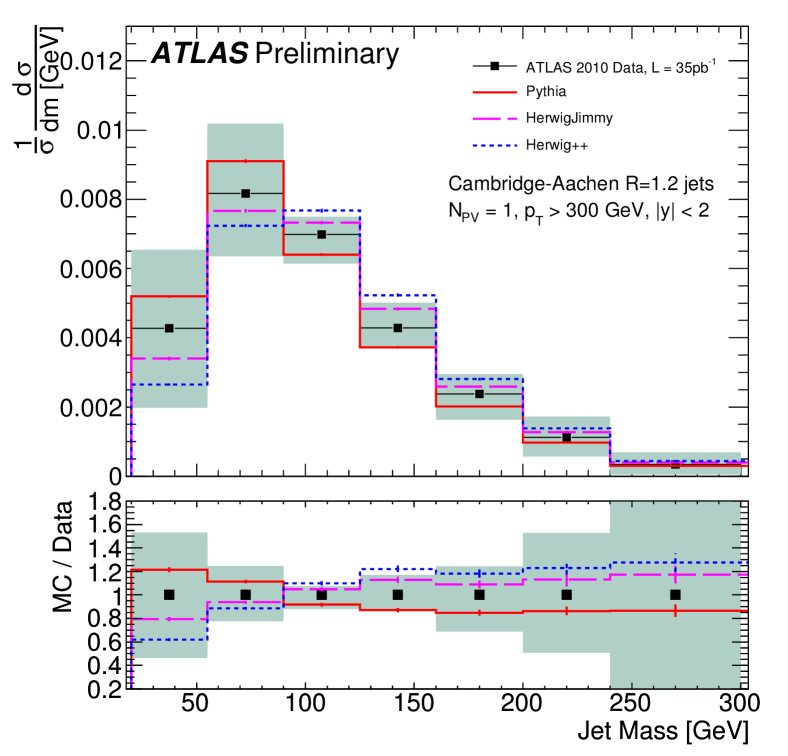
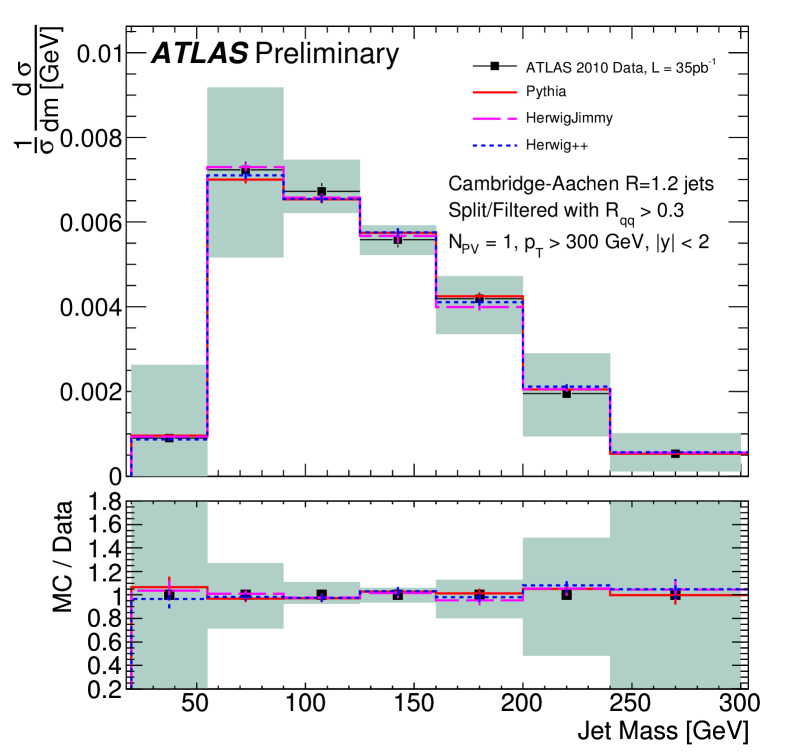
Figure 6 shows the spectrum of jet masses for C/A jets with before and after the filtering procedure in events with exactly one primary vertex (to remove pile-up) and at least one jet with and . The agreement with all three predictions is good although HERWIG++ produces jets with larger mass (before filtering) compared to data.
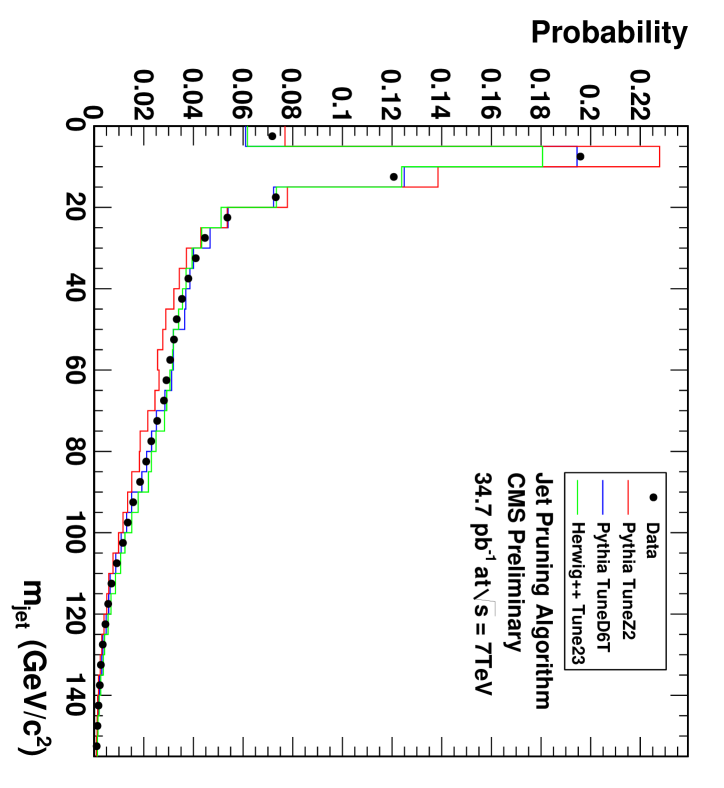
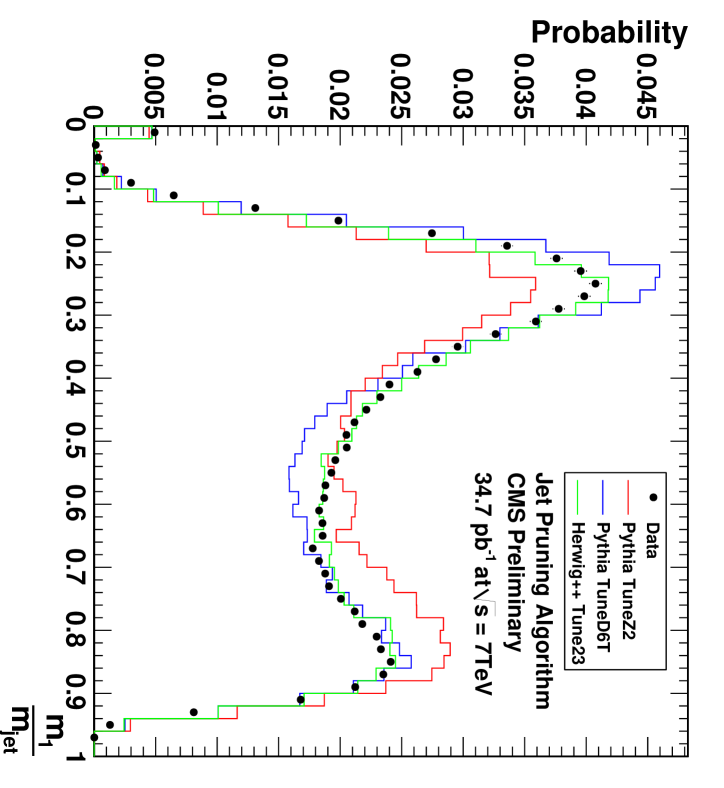
Jet pruning is useful for tagging and the QCD behavior has been tested by CMS in art:CMS-PAS-JME-10-013 . For boosted s decaying into two quarks with similar energy and mass two light subjets are expected in the pruning algorithm with the pruned jet mass close to . The mass drop of the leading subjet should be smaller than consistent with two light subjets. Figure 7 shows the pruning properties of the leading jet in events with at least two high jets with and in comparison to two different PYTHIA tunes and HERWIG++. The overall agreement of the data with simulation is good – especially with the HERWIG++ tune.
6 Conclusions
Both ATLAS and CMS have made comprehensive studies of hard QCD involving jets. Excellent agreement with NLO pQCD calculations has been found and constraints on new physics were set by the observed agreement. Novel techniques to identify massive boosted objects were successfully tested on the large QCD background expected. The challenge will be to continue the studies presented here under the increased pile-up conditions in the data taken beyond 2010.
Acknowledgments
I’d like to thank the Jet Performance and SM/QCD groups of ATLAS and CMS for providing me with the material presented here. In particular I benefited greatly from discussions with J. Butterworth, M. Campanelli, A. Davison, A. Di Ciaccio, K. Kousouris, and M. Voutilainen.
References
- (1) G. Aad et al. (ATLAS Collaboration), JINST 3, S08003 (2008)
- (2) R. Adolphi et al. (CMS Collaboration), JINST 3, S08004 (2008)
- (3) M. Cacciari, G.P. Salam, G. Soyez, JHEP 04, 063 (2008), arXiv:0802.1189
- (4) W. Lampl, S. Laplace, D. Lelas, P. Loch, H. Ma, S. Menke, S. Rajagopalan, D. Rousseau, S. Snyder, G. Unal (ATLAS Collaboration), Tech. rep., CERN, Geneva (2008), ATL-LARG-PUB-2008-002
- (5) G. Aad et al. (ATLAS Collaboration) (2009), arXiv:0901.0512
- (6) CMS Collaboartion, Tech. rep., CERN, Geneva (2009), CMS-PAS-PFT-09-001
- (7) CMS Collaboration, Tech. rep., CERN, Geneva (2010), CMS-PAS-PFT-10-001
- (8) S. Chatrchyan et al. (CMS Collaboration), JINST 6, P11002 (2011), arXiv:1107.4277
- (9) ATLAS Collaboration, Tech. rep., CERN, Geneva (2011), ATLAS-CONF-2011-032
- (10) ATLAS Collaboration, Tech. rep., CERN, Geneva (2011), ATLAS-CONF-2011-047
- (11) S. Chatrchyan et al. (CMS Collaboration), Phys. Rev. Lett. 107, 132001 (2011)
- (12) ATLAS Collaboration, Tech. rep., CERN, Geneva (2011), ATLAS-PHYS-PUB-2011-005
- (13) CMS Collaboartion, Tech. rep., CERN, Geneva (2011), CMS-NOTE-2011-004
- (14) S. Chatrchyan et al. (CMS), Phys. Lett. B700, 187 (2011), arXiv:1104.1693
- (15) G. Aad et al. (ATLAS Collaboration), Phys.Rev.Lett. 106, 172002 (2011), arXiv:1102.2696
- (16) V. Khachatryan et al. (CMS Collaboration), Phys.Rev.Lett. 106, 201804 (2011), arXiv:1102.2020
- (17) G. Aad et al. (ATLAS Collaboration), JHEP 1109, 053 (2011), arXiv:1107.1641
- (18) S. Chatrchyan et al. (CMS Collaboration), Phys.Lett. B702, 336 (2011), arXiv:1106.0647
- (19) Y.L. Dokshitzer, G. Leder, S. Moretti, B. Webber, JHEP 9708, 001 (1997), hep-ph/9707323
- (20) S. Catani, Y.L. Dokshitzer, M. Seymour, B. Webber, Nucl.Phys. B406, 187 (1993)
- (21) S.D. Ellis, D.E. Soper, Phys.Rev. D48, 3160 (1993), hep-ph/9305266
- (22) ATLAS Collaboration, Tech. rep., CERN, Geneva (2011), ATLAS-CONF-2011-073
- (23) CMS Collaboartion, Tech. rep., CERN, Geneva (2011), CMS-PAS-JME-10-013