A Radial Velocity Study of CTCV J1300-3052
Abstract
We present time-resolved spectroscopy of the eclipsing, short period cataclysmic variable CTCV J1300-3052. Using absorption features from the secondary star, we determine the radial velocity semi-amplitude of the secondary star to be = 378 6 km s-1, and its projected rotational velocity to be km s-1. Using these parameters and Monte Carlo techniques, we obtain masses of = 0.79 0.05 for the white dwarf primary and = 0.198 0.029 for the M-type secondary star. These parameters are found to be in excellent agreement with previous mass determinations found via photometric fitting techniques, supporting the accuracy and validity of photometric mass determinations in short period CVs.
keywords:
binaries: close - binaries: eclipsing - stars: dwarf novae - stars: low mass, stars: novae, cataclysmic variables - stars: evolution.1 Introduction
Cataclysmic variable stars (CVs) are a class of interacting binary system undergoing mass transfer from a Roche-lobe filling secondary to a white dwarf primary, usually via a gas stream and accretion disc. Through determinations of the masses and radii of the component stars in CVs, it is possible to test fundamental theories regarding their formation, origin and evolution (e.g. Littlefair et al., 2008; Savoury et al., 2011).
Savoury et al. (2011) carried out a photometric study of eclipsing CVs and found the masses and radii for both the white dwarf and donor star in 14 systems. These masses were found by fitting a parameterised model to the eclipse light curves. This model is based on the techniques developed by Bailey (1979), Smak (1979), Cook & Warner (1984), Wood et al. (1985), Wood et al. (1986), Horne et al. (1994), Littlefair et al. (2008) and Copperwheat et al. (2010) and relies on just four assumptions: the bright-spot lies on the ballistic trajectory from the donor star; the donor star fills its Roche lobe; the white dwarf is accurately described by a theoretical mass-radius relation; and the whole of the white dwarf is visible with an unmodified surface brightness. It is photometric mass and radii determinations such as these that are used to calibrate the - (super-hump excess-mass ratio) relations of Patterson (2005), Knigge (2006) and Knigge et al. (2011), which can then be used to derive donor mass estimates for large samples of CVs. It is therefore important to check the validity of photometric mass determinations.
For objects with periods above the period gap (the dearth of systems between 2.2 and 3.2 hours, see e.g. Kolb & Ritter 2003, Knigge 2006), the photometric fitting technique appears robust, with donor star radial velocities predicted by photometry in agreement with those found by other techniques (Watson et al., 2003; Feline, 2005; Copperwheat et al., 2010). However, for objects below the period gap, independent tests of the photometric technique are rare.Tulloch et al. (2009) found the radial velocity of the white dwarf () in SDSS J143317.78+101123.3 ( = 78.1 mins), as measured from disc emission lines, to be in excellent agreement with the photometric value predicted by Littlefair et al. (2008). The agreement is encouraging, but the motion of the inner disc does not necessarily follow the motion of the white dwarf, and so estimates from disc emission should be treated with caution (e.g. Marsh, 1988). More recently, Copperwheat et al. (2011) found the radial velocity and rotational broadening of the secondary star in OY Car ( = 90.9 mins) to be in good agreement with those predicted by photometric methods (Wood & Horne, 1990; Littlefair et al., 2008). However, such is the importance of mass determinations in CVs, additional verification across a range of orbital periods is highly desirable.
One of the systems observed by Savoury et al. (2011) was CTCV J1300-3052 (hereafter CTCV 1300). CTCV 1300 is a dwarf nova that was discovered as part of the Calán-Tololo Survey follow up (Tappert et al., 2004). It was found to be eclipsing, with an orbital period of 128.1 minutes, placing it immediately below the period gap. The average spectrum showed clear emission lines from the accretion disc and absorption lines from the donor star. It is through absorption lines such as these that we can determine the radial velocity and rotational broadening of the secondary star, which can in turn be used to derive an independent measure of the masses and radii of the component stars (e.g. Horne et al., 1993; Smith et al., 1998; Thoroughgood et al., 2001, 2004).
2 Observations
CTCV 1300 was observed using X-shooter (D’Odorico et al., 2006) in service mode mounted on UT2 (Kueyen) on the 8.2-m Very Large Telescope (VLT) on the nights beginning 9 Feb 2010 and 6 March 2010. In total, we obtained 48 spectra (24 on each night) covering 1.5 orbital cycles, and a wavelength range of 3000-24800 Å. Exposure times were 235 seconds in the UVB-arm (3000-5500 Å), 210 seconds in the VIS-arm (5500-10000 Å), and 255 seconds in the NIR-arm (10000-24800 Å), with dead times between exposures of approximately 8, 9 and 1 seconds, respectively.
The target was observed with the 1.0”x11” slit in the UVB-arm, the 1.2”x11” slit in the VIS-arm, and the 0.9”x11” slit in the NIR-arm. The resolving power was 5100 (59 km s-1) in the UVB and NIR-arms, and 6700 (45 km s-1) in the VIS-arm. Seeing conditions on both nights were fair, varying between 0.5 and 1.5 arcseconds, but with flares of up to 2.0 arcseconds.
Observations of the standard star GD153 were used to flux calibrate the data and correct for telluric absorption. The data were obtained in ‘stare’ mode rather than nodding along the slit as is normal for long slit infra-red spectroscopy. Consequently, the sky subtraction on the NIR-arm spectra is significantly worse than usual with X-shooter. We also obtained spectra of the spectral type templates GJ2066 (M2V) and GJ1156 (M5V), although these data were taken on the nights of 11 Dec 2009 and 28 Jan 2010, respectively.
3 Data Reduction & Analysis
Data reduction was carried out using the X-shooter pipeline (version 1.2.2) recipes within ESORex, the ESO reduction execution tool. The data for all three arms were reduced with similar procedures. The required calibration frames were constructed using the standard recipes provided in the pipeline. In brief, they include a map of bad pixels, a master bias (for the UVB and VIS-arms), a master dark (for the NIR-arm, as dark contribution is negligible in UVB and VIS) and a master flat. The data was first bias and dark subtracted, before an inter-order background was fitted and subtracted. Science frames were then divided by the flat field, and then the object was localised on the slit. Sky subtraction and cosmic ray removal took place, and the data then underwent an optimal extraction routine (Horne, 1986; Marsh, 1989), and order merging.
Wavelength calibration was undertaken using an arc line spectrum which was taken from the ESO archive. The wavelength calibration recipe used a physical model to generate a best-guess solution of the line positions on the calibration frame. These lines were then fitted by 2D Gaussians, and the resulting positions of these lines were adjusted via a polynomial fit to the whole CCD. From residuals to the line fitting, we estimate that this calibration is accurate to 1 km s-1 (at = 8183 Å). We corrected for flexure in the VIS arm by measuring the shift of the observed sky lines relative to their positions measured by Hanuschik (2003). The individual spectra were then moved by these shifts, which were typically between 10 and 35 km s-1. We do not attempt to correct for flexure in the UVB and NIR arms, since we do not attempt to measure radial velocities to a high degree of precision in these bands.
The time and wavelength axis of the data were corrected to the heliocentre.
4 Results
4.1 Average Spectra
The average spectra of CTCV 1300 are shown in Fig. 1. The upper panel shows the wavelength range 3200-5500 Å (from the UVB-arm), the centre panel shows 5750-10000 Å (from the VIS-arm), and the lower panel 10000-13500 Å (from the NIR-arm). Each spectrum is flux calibrated, and telluric correction has been attempted.

Throughout the spectrum we see strong, broad, double-peaked Balmer lines and several double-peaked He I lines (4471, 4922, 5015, 5875, 6678, 7065 and 10830 Å). Broad double-peaked lines such as these are typical of a high-inclination accreting binary (e.g. Horne & Marsh, 1986).
The high ionisation line He II 4686 Å appears absent in the average spectrum, but is visible in the trailed spectra (see Sections 4.2 and 4.3). Several absorption lines are present between 4000-4800 Å (see Fig. 2) which appear to trace the motion of the disc (see Section 4.2). We believe the most likely cause of these absorption lines is a veil of disc material along the line of sight, The majority of these lines appear to be Fe I, Fe II and Ca I. Similar features have been observed in the spectrum of OY Car by Horne et al. (1994) and Copperwheat et al. (2011).
The helium lines at 4922, 5015 Å appear to show strong, narrow absorption cores that dip below the continuum, as do the higher-order Balmer lines between 3600-4000 Å. The O I triplet at 7773 Å is clearly visible, and also appears to drop below the continuum. Features such as these are observed in a number of CVs (e.g Marsh, 1987; Wade & Horne, 1988; Friend et al., 1988). These absorption cores are believed to originate through self-absorption in the accretion disc.
The Ca II triplet at 8498, 8542 and 8662 Å (hereafter 8567 Å) is clearly present and originates from the disc, although there is evidence of emission from the irradiated side of the donor (see Sections 4.2 and 4.3). Similar features have been observed in the spectrum of GW Lib (van Spaandonk et al., 2010). The higher orders of the Paschen series are also visible from 8800 Å onwards, and are possibly blended with the Ca II emission.
Absorption features from the secondary star are clearly visible in the form of TiO bands around 7100 Å and 7600 Å, and weak K I absorption doublet at 7664, 7699 (hereafter 7682 Å), 11773, 12432 and 12522 Å. However, these regions are heavily affected by telluric absorption. The clearest features from the secondary star are the Na I doublets at 8183, 8194 Å (hereafter 8189 Å) and 11381, 11404 Å (hereafter 11393 Å), although the second of these is also heavily affected by telluric absorption.

4.2 Trailed Spectra
The data were phase binned into 30 bins, according to the ephemeris of Savoury et al. (2011). The UVB-arm has complete phase coverage although, due to the differing exposure times (see Section 2), one of these bins is empty in both the VIS and NIR-arms.
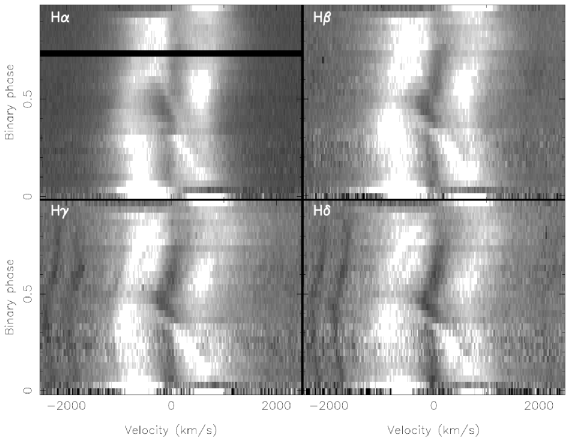
We divided the continuum by a polynomial and re-binned the spectra onto a constant velocity-interval scale centred on the rest wavelength of the lines. Fig. 3 shows the trailed spectra of the H, H, H and H lines in CTCV 1300. Each line shows two clear peaks that vary sinusoidally with phase, in addition to the characteristic s-wave between phases 0.1–0.4 from the bright spot.
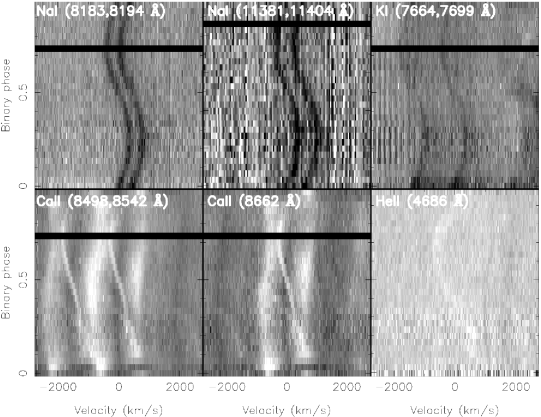
In Fig. 4 we show the trailed spectra of two Na I doublets (8189 and 11393 Å), the Ca II triplet (8567 Å), the 7682 Å K I doublet and He II (4686 Å). The phases at which the Na I and K I lines show maximum red-shift () and blue-shift () suggest they originate from the donor star. We see evidence for emission from the donor star in the Ca II lines through a component in the trail that is in phase with the Na I lines. However, this component is only visible during phases 0.25-0.75, which indicates it arises from the irradiated side of the donor. The He II line appears to follow the motion of the bright spot, as defined by the s-wave in the Balmer trails.
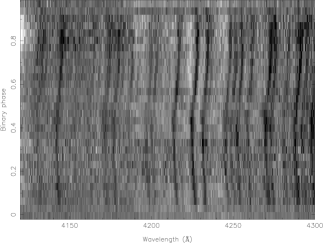
In Fig. 5 we show the trailed spectra of the absorption line forest between 4130-4300 Å. The lines all appear to move together, suggesting a common place of origin. Using the same method outlined in Section 4.4, we find the velocity of these lines to be = 116 4 km s-1, with a phase offset of = 0.072 0.006. The high velocity (compared to the expected motion of the white dwarf, 90 km s-1, see Section 4.6) and significant phase offset suggests that these lines originate in the disc.
4.3 Doppler tomography
Doppler tomography is an indirect imaging technique which can be used to determine the velocity-space distribution of the emission in cataclysmic variables. For a comprehensive review of Doppler tomography, see Marsh & Horne (1988) and Marsh (2001).
Fig. 6 shows Doppler maps for Ca II (8498, 8542 & 8662 Å), H, H and He II (4686 Å). Eclipse data (between phases 0.95 and 1.05) are removed. A systemic velocity of = -20 km s-1 was applied to shift the maps onto the km s-1 axis (see Section 4.4).
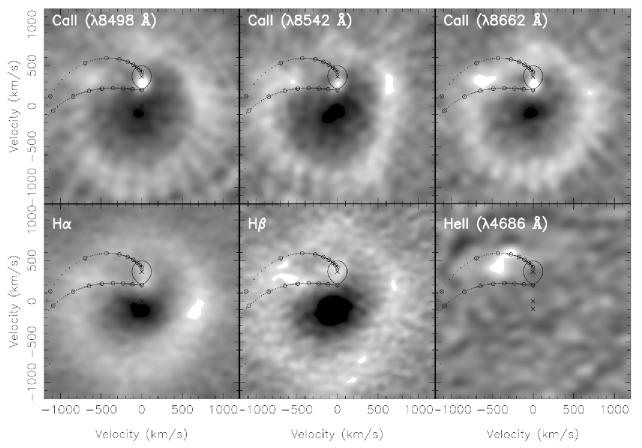
In each map we see a ring-like distribution of emission centred on the white dwarf, which is characteristic of an accretion disc. In the Ca II maps, we see an enhanced area of emission at velocities intermediate to the free-fall velocity of the gas stream (lower stream) and the velocity of the disc along the gas stream (Keplerian velocity, upper stream). This emission is attributed to the bright spot. The three Ca II maps all show clear emission from the donor star, which appears to be concentrated towards the inner hemisphere, indicating that irradiation is significant. The H map shows emission from the secondary star, a feature uncommon in short period CVs. The H map shows weak bright spot emission. The He II emission appears to show emission near both the Keplerian velocity stream and at velocities intermediate to the Keplerian velocity stream and free-fall velocity stream, although it is possible that this is an artifact arising from limited phase coverage (Marsh & Horne, 1988). If this is a genuine feature, its position relative to the Ca II emission suggests that the He II emission is caused by a mixture of gas-stream and disc material. He II bright spot emission at Keplerian disc velocities has been observed in other short period CVs (Marsh et al., 1990; Copperwheat et al., 2011).
4.4 Radial velocity of the secondary star
The secondary star in CTCV 1300 is visible through weak absorption lines. The strongest of these lines is the Na I doublet at 8189 Å. In order to determine the radial velocity, we cross-correlated the individual spectra of CTCV 1300 against an average spectra of CTCV 1300 using an iterative technique. We chose the Na I line at 8189 Å because it is much stronger and less affected by telluric absorption than the line at 11393 Å.
We subtracted fits to the continuum from the individual spectra and then corrected for the orbital motion of the secondary star with a first guess of . For each individual spectrum, we then created a template spectrum that consisted of an average of all the spectra minus the spectrum under study (Marsh, Robinson & Wood, 1994). These template spectra were then cross-correlated against the uncorrected data. The velocity shifts as a function of orbital phase were then fit with a sine function according to;
| (1) |
where V is the velocity shift, is the systemic velocity of the system, is the radial velocity of secondary star, is the orbital phase, and is the phase offset. This then yielded a new value of and to correct our spectra with. We added an intrinsic error in quadrature to each error bar to account for systematic error, and reach a reduced- of 1. This process was repeated until converged. We arrive at a value of = 379 6 km s-1, with an intrinsic error of 22 km s-1 added in quadrature to each error bar. The radial velocity curve obtained using this technique is shown in the upper panel of Fig. 7.
The value of obtained via our auto-correlation technique is not representative of the true systemic velocity, which must be determined through cross-correlation with a template star of known radial velocity. Therefore, in order to verify this result and find the true systemic velocity (), we then cross-correlated against our M-dwarf template spectra using the same wavelength range. The template spectra were artificially broadened by 46 km s-1 to account for the orbital smearing of CTCV 1300 through the 210-second VIS-arm exposures, and then by the best-fitting values for the rotational velocity of the secondary star () found in Section 4.5. An intrinsic error of 22 km s-1 was added to each error bar from the M2V cross-correlation, and 24 km s-1 to M5V data, to account for systematic errors and reach a reduced- of 1. The radial velocity curves are shown in the centre panel (M2), and bottom panel (M5) of Fig. 7. Cross-correlating against the M2 and M5 templates yield values of = 373 6 km s-1 and = 376 7 km s-1, respectively. The M2 template could not be corrected for flexure, so we only use the M5 template to derive the systemic velocity for CTCV 1300. Using the radial velocities provided by Gizis et al. (2002), we find = -20 5 km s-1. For , we prefer the value found through the auto-correlation, that is = 379 6 km s-1. This is because the average spectra of the data is a better match to the data than the M5 and M2 templates.
The radial velocity curves produced through this technique show some variation from a sine fit between phases 0.4 to 0.6, which is characteristic of irradiation suppressed absorption (e.g. Billington et al., 1996). Marsh & Horne (1988) recommend only fitting the above data between phases 0.8 to 1.2, since at these phases the effects of irradiation are at a minimum. Fitting the auto-correlation data, we obtain a value of = 378 6 km s-1, which we use hereafter. This value is consistent with the value predicted by Savoury et al. (2011), = 372.2 2.5 km s-1. Fitting the M5 and M2 templates between the same phases gives = 372 7 km s-1 and = 378 8 km s-1 respectively, which is again in excellent agreement with the auto-correlation data, and consistent with the photometric method.

4.5 Rotational velocity of the secondary star
The normalised spectra of CTCV 1300 were corrected for the orbital motion of the secondary star using the value of obtained in Section 4.4. The spectra were then averaged together in order to maximise the strength of the Na I doublet at 8189 Å. The spectral-type templates were broadened to match the smearing due to orbital motion of CTCV 1300 through the 210 second VIS-arm exposures and rotationally broadened by a range of velocities (50-200 km s-1). In principle, the orbital smearing is a function of orbital phase, and thus varies throughout the orbital cycle. We use a single value of 46 km s-1, which is the average value of the smearing across an orbital cycle. We find that changing this to the maximum and minimum possible values of orbital smearing required, that is the smearing at conjunction and quadrature, alters the final value of obtained by 3 km s-1. This uncertainty is added in quadrature to the uncertainty calculated below.
The value of was obtained via an optimal subtraction routine, which subtracts a constant times the normalised, broadened template spectrum from the normalised, orbitally corrected CV spectrum. This constant is adjusted to minimise the residual scatter between the spectra. The scatter is measured by carrying out the subtraction and then computing between the residual spectrum and a smoothed version of itself. By finding the value of rotational broadening that minimises , we can obtain a value of and the spectral type of the secondary star (Dhillon & Marsh, 1993; Marsh, Robinson & Wood, 1994). This value of should then be corrected for the intrinsic rotational velocity of the template star. Unfortunately a wide range of spectral-types were not available, and so we are unable to deduce the spectral-type of the secondary using this technique.
The value of obtained using this method was found to vary depending on the spectral-type template used and the wavelength region selected for optimal subtraction. We attempted to include as much of the continuum as possible around the Na I doublet, while trying to avoid telluric regions. We used a wavelength range of 8080-8106, 8125-8206, 8226-8245 and 8264-8285 Å, a limb-darkening coefficient of 0.5 and smoothing Gaussian of FWHM = 15 km s-1, which were found to give the lowest values of . The limb-darkening coefficient is highly uncertain, although Copperwheat et al. (2011) have shown that altering the limb-darkening coefficient has little effect on the value of obtained. We plot the values of versus for both spectral-type templates in Fig. 8. Using the M2 template, we obtain a value of = 129 3 km s-1, while the M5 template yields a value of = 125 4 km s-1. The uncertainties on these values come from the formal error estimation of . This does not attempt to include systematic errors. Because of the lack of available templates, we estimated the spectral type of the secondary star using the empirical donor sequence of Knigge et al. (2011). For a system with an orbital period of 128.07 minutes, we expect a secondary with spectral type of M4.3. We adopt a spectral type of M4.5 0.5. We interpolate between the two values of above to arrive at a final value of = 125 7 km s-1. This error takes into account both the uncertainty on finding our minimum for each template ( 3-4 km s-1 for each template), the uncertainty from averaging the orbital smearing ( 3 km s-1), and the uncertainty in spectral type (0.5 spectral types).

4.6 System Parameters
Using the values of = 378 6 km s-1 and = 125 7 km s-1 found in Sections 4.4 and 4.5 in conjunction with the orbital period and a measurement of the eclipse full width at half depth (1/2), we can calculate accurate system parameters for CTCV 1300.
The best measurement of the orbital period, , comes from Savoury et al. (2011), who determine = 0.088940717(1) days. Savoury et al. (2011) also present six light curves of CTCV 1300, from which we determine 1/2 = 0.0791(5).
We use a Monte Carlo approach similar to Horne et al. (1993), Smith et al. (1998), Thoroughgood et al. (2001) and Thoroughgood et al. (2004) to calculate the system parameters and their errors. For a given set of , , and 1/2, the remaining parameters are calculated as follows.
can be estimated because the secondary star fills its Roche Lobe. is the secondary radius, and the is the binary separation, and so we use Eggleton’s formula (Eggleton, 1983), which gives the volume equivalent radius of the Roche Lobe to an accuracy of 1 per cent, which is close to the equatorial radius of the secondary star as seen during eclipse,
| (2) |
The secondary star rotates synchronously with the orbital motion, so we can combine and , to get
| (3) |
This gives us two simultaneous equations that can be solved for and . The orbital inclination, , is fixed by and 1/2, using geometrical arguements (e.g. Bailey, 1979). We determine the inclination via a binary chop search using an accurate model of the Roche Lobe.
Using Kepler’s Third Law, we obtain
| (4) |
which using the previously calculated values of and yields the mass of the primary star, . The mass of the secondary star, and radial velocity of the primary, , is given by
| (5) |
Finally, we can calculate the radius of the secondary star using
| (6) |
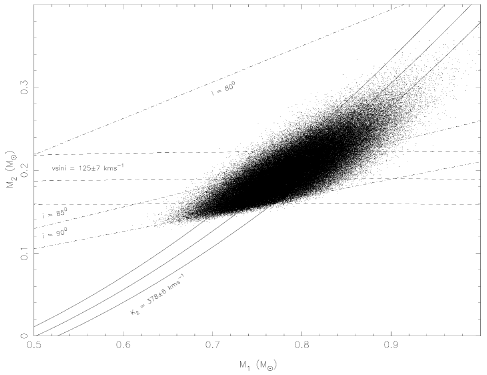
Our Monte Carlo simulation takes 250,000 values of , , and , treating each as being normally distributed about their measured values with standard deviations equal to the errors on the measurements. We then calculate the mass of each component, the inclination of the system and the radius of the secondary star as outlined above, omitting (, , ) triplets that are inconsistent with 1. Each accepted , pair is plotted in Fig. 9, and the masses and their errors are computed from the mean and standard deviation of the distribution of these pairs. We find that = 0.79 0.05 and = 0.198 0.029 . These values are found to be in good agreement with those of Savoury et al. (2011). The values of all system parameters found from the Monte Carlo simulation are listed in Table 1, along with those of Savoury et al. (2011) for direct comparison.
4.7 Distance
By finding the apparent magnitude of the secondary star from its contribution to the total light during eclipse, and by estimating the absolute magnitude, we can calculate the distance (), using the equation;
| (7) |
where is the interstellar extinction in magnitudes per kpc. We assume the extinction is zero, as this allows a direct comparison to the distance obtained by Savoury et al. (2011), who used model generated white dwarf fluxes to estimate the distance without correction for extinction. At mid-eclipse (), the apparent magnitude of the system is 17.32 0.02 around the Na I doublet, which is approximately the -band. This value is not corrected for slit losses. The secondary star is found to contribute 58 6 per cent, which gives an apparent magnitude of = 17.91 0.09. We estimate the absolute magnitude using the empirical donor sequence of Knigge et al. (2011), who assume the donor is on the main sequence and then correct for bloating effects. From this, we take , and obtain a distance of = 330 40 pc. This distance is found to be in good agreement with that of Savoury et al. (2011), who obtained a value of = 375 13 pc.
5 Discussion
The system parameters listed in Table 1 are found to be in good agreement with those of Savoury et al. (2011). Together with Copperwheat et al. (2011), this gives us confidence that photometric mass determinations such as those of Littlefair et al. (2008) and Savoury et al. (2011) are reliable across a range of orbital periods, and that the - relations of Patterson (2005), Knigge (2006) and Knigge et al. (2011) are well founded.
The uncertainties in the system parameters for CTCV 1300 determined in this paper, and in Savoury et al. (2011), are quite large in comparison to many of the other systems published in Savoury et al. (2011). The reason for the large uncertainties in CTCV 1300 in Savoury et al. (2011) is because the eclipse light curves used for model fitting suffer from heavy flickering, which causes difficulties in obtaining an accurate value for the mass ratio, . The large uncertainties in this paper arise because of the interpolation technique used to arrive at a value for . The error on ( 7 km s-1) is the dominant source of uncertainty in our final system parameters. In principle, a wider selection of spectral type templates would enable us to further constrain , and derive the spectral type.
6 Conclusions
We have used time-resolved spectroscopy to determine the system parameters for the short period dwarf nova CTCV 1300. The double-peaked nature of the Balmer and He I lines confirms the presence of an accretion disc, while careful analysis of the Na I doublet absorption lines at 8189 Å reveals the radial velocity of the secondary star to be = 378 6 km s-1 and the rotational velocity of the secondary star to be = km s-1. Using these measurements, we find = 0.79 0.05 for the white dwarf primary and = 0.198 0.029 for the M-type secondary star. The radius of the secondary star is found to be = 0.223 0.011 .
The system parameters determined through spectroscopic analysis are found to be in good agreement with those previously calculated using photometric techniques. This is significant, as our results support the validity and accuracy of the purely photometric mass determination technique in short period cataclysmic variables.
7 Acknowledgements
CDJS, VSD, TRM and CMC acknowledge the support of the Science and Technology Facilities Council (STFC). SPL acknowledges the support of an RCUK Fellowship. DS acknowledges a STFC Advanced Fellowship. This article is based upon observations carried out using the European Southern Observatory (Paranal, Chile) with X-shooter on VLT-UT2 [programme 084.D-1149]. This research has made use of NASA’s Astrophysics Data Bibliographic Services.
References
- Bailey (1979) Bailey J., 1979, MNRAS, 187, 645
- Billington et al. (1996) Billington I., Marsh T., Dhillon V., 1996, MNRAS, 278, 673
- Cook & Warner (1984) Cook C., Warner B., 1984, MNRAS, 207, 705
- Copperwheat et al. (2010) Copperwheat C., Marsh T., Dhillon V., Littlefair S., Hickman R., Gänsicke B., Southworth J., 2010, MNRAS, 402, 1824
- Copperwheat et al. (2011) Copperwheat C. et al., 2011, MNRAS, submitted
- Dhillon et al. (1991) Dhillon V., Marsh T., Jones D., 1991, MNRAS, 252, 342
- Dhillon & Marsh (1993) Dhillon V., Marsh T., 1993, in Cataclysmic Variables and Related Physics, 2nd Technion Haifa Conference. Edited by O. Regev and Giora Shaviv. Annals of the Israel Physical Society, Volume 10. Bristol: Institute of Physics Pub.; Jerusalem: Israel Physical Society; New York: American Institute of Physics, 34
- D’Odorico et al. (2006) D’Odorico S. et al., 2006, in Society of Photo-Optical Instrumentation Engineers (SPIE) Conference Series Vol. 6269 of Society of Photo-Optical Instrumentation Engineers (SPIE) Conference Series, X-shooter uv- to k-band intermediate-resolution high-efficiency spectrograph for the vlt: status report at the final design review
- Eggleton (1983) Eggleton P., 1983, ApJ, 268, 368
- Feline (2005) Feline W., 2005, PhD Thesis, Univ. Sheffield
- Friend et al. (1988) Friend, M., Martin J., Smith R., Jones D., 1988, MNRAS, 233, 451
- Gizis et al. (2002) Gizis J., Reid N., Hawley S., 2002, AJ, 123, 3356
- Hanuschik (2003) Hanuschik R., 2003, A&A, 407, 1157
- Horne (1986) Horne K., 1986, PASP, 98, 609
- Horne & Marsh (1986) Horne K., Marsh T., 1986, MNRAS, 218, 761
- Horne et al. (1993) Horne K., Welsh W., Wade R., 1993, ApJ, 410, 357
- Horne et al. (1994) Horne K., Marsh T., Cheng F., Hugeny I., Lanz T., 1994, ApJ, 426, 294
- Knigge (2006) Knigge C., 2006, MNRAS, 373, 484
- Knigge et al. (2011) Knigge C., Baraffe I., Patterson J., 2011, ApJS, 194, 28
- Littlefair et al. (2008) Littlefair S., Dhillon V., Marsh T., Gänsicke B., Southworth J., Baraffe I., Watson C., Copperwheat C., 2008, MNRAS, 388, 1582
- Marsh (1987) Marsh T., 1987, MNRAS, 228, 779
- Marsh (1988) Marsh T., 1988, MNRAS, 231, 1117
- Marsh (1989) Marsh T., 1989, PASP, 101, 1032
- Marsh & Horne (1988) Marsh T., Horne K., 1988, MNRAS, 235, 269
- Marsh (2001) Marsh T., 2001, in H. M. J. Boffin, D. Steeghs, & J. Cuypers ed., Astrotomography, Indirect Imaging Methods in Observational Astronomy Vol. 573 of Lecture Notes in Physics, Berlin Springer Verlag, Doppler tomography. pp 1–+
- Marsh et al. (1990) Marsh T., Horne K., Schlegel E., Honeycutt R., Kaitchuck R., 1990, ApJ, 637
- Marsh, Robinson & Wood (1994) Marsh T., Robinson E., Wood J., 1994, MNRAS, 266, 137
- Patterson (2005) Patterson J., 2005, PASP, 117, 1204
- Ritter & Kolb (2003) Ritter H., Kolb U., 2003, VizieR Online Data Catalog, 5113
- Savoury et al. (2011) Savoury C. et al., 2011, MNRAS, 415, 2025
- Smak (1979) Smak J., 1979, ACTA, 29, 309
- Smith et al. (1998) Smith D., Dhillon V., Marsh T., 1998, MNRAS, 296, 465
- van Spaandonk et al. (2010) van Spaandonk L., Steeghs D., Marsh T., Torres M., 2010, MNRAS, 401, 1857
- Tappert et al. (2004) Tappert C., Augusteijn T., Maza J., 2004, MNRAS, 354, 321
- Thoroughgood et al. (2001) Thoroughgood T., Dhillon V., Littlefair S., Marsh T., Smith D., 2001, MNRAS, 327, 1323
- Thoroughgood et al. (2004) Thoroughgood T., Dhillon V., Watson C., Buckley D., Steeghs D., Stevenson M., 2004, MNRAS, 353, 1135
- Tulloch et al. (2009) Tulloch S., Rodríguez-Gil P., Dhillon V., 2009, MNRAS, 397, L82
- Wade & Horne (1988) Wade R., Horne K., 1988, ApJ, 324, 411
- Watson et al. (2003) Watson C., Dhillon V., Rutten R., Scwope A., 2003, MNRAS, 219, 629
- Wood & Horne (1990) Wood J., Horne K., 1990, MNRAS, 242, 606
- Wood et al. (1985) Wood J., Irwin M., Pringle J., 1985, MNRAS, 214, 475
- Wood et al. (1986) Wood J., Horne K., Berriman G., Wade R., O’Donoghue D., Warner B., 1986, MNRAS, 219, 629