Correlation analysis of a large sample of narrow-line Seyfert 1 galaxies: linking central engine and host properties
Abstract
We present a statistical study of a large, homogeneously analyzed sample of narrow-line Seyfert 1 (NLS1) galaxies, accompanied by a comparison sample of broad-line Seyfert 1 (BLS1) galaxies. Optical emission-line and continuum properties are subjected to correlation analyses, in order to identify the main drivers of active galactic nuclei (AGN) correlation space, and of NLS1 galaxies in particular. For the first time, we have established the density of the narrow-line region as a key parameter in Eigenvector 1 space, as important as the Eddington ratio . This is important because it links the properties of the central engine with the properties of the host galaxy; i.e., the interstellar medium (ISM). We also confirm previously found correlations involving the line width of H, and the strength of the Fe II and [O III] 5007 emission lines, and we confirm the important role played by in driving the properties of NLS1 galaxies. A spatial correlation analysis shows that large-scale environments of the BLS1 and NLS1 galaxies of our sample are similar. If mergers are rare in our sample, accretion-driven winds on the one hand, or bar-driven inflows on the other hand, may account for the strong dependence of Eigenvector 1 on ISM density.
1 Introduction
Narrow-line Seyfert 1 (NLS1) galaxies as active galactic nuclei (AGN) with the narrowest Balmer lines from the broad-line region (BLR) and the strongest Fe II emission, cluster at one extreme end of AGN correlation space. It is expected that such correlations provide some of the strongest constraints on, and new insights in, the physical conditions in the centers of AGN and the prime drivers of activity, and the study of NLS1 galaxies is therefore of particular interest (see Komossa 2008 for a review).
A number of key results have arisen from principal component analyses (PCA). Applied to NLS1 and broad-line Seyfert 1 (BLS1) galaxies, the strongest correlations are among optical AGN properties, and involve the width of the H line and the strength of the [O III] line and Fe II complex. Others include the steepness of the X-ray spectrum and the asymmetry of the CIV emission line (e.g. Boroson & Green 1992, Laor et al. 1997, Brandt 1999, Marziani et al. 2001, Sulentic et al. 2000, 2002, Boroson 2002, Grupe 2004, Sulentic et al. 2007, 2008).
These multi-wavelength observations (and their interpretation or modeling) hint at smaller black hole masses in NLS1 galaxies, and as such their black holes represent an important link with the elusive intermediate mass black holes, which have been little studied so far. Accreting likely at very close to the maximum allowed values, NLS1 galaxies are important test-beds of accretion models.
Given their low black hole masses, mergers of NLS1 galaxies are prime sources of gravitational wave emission within the LISA sensitivity band (e.g., Centrella 2010).
Independent samples are of importance when assessing the robustness of correlation analyses, and to increase correlation space (Grupe et al. 1999, Véron-Cetty et al. 2001, Williams et al. 2002, Zhou et al. 2006, Grupe et al. 2010). We have studied a sample of 94 AGN, including 55 NLS1 galaxies and 39 BLS1 galaxies. Ours is a large, homogeneously analyzed sample, and we add new emission-line measurements (particularly, the density-sensitive [S II] ratio) to correlation analyses. The comparison sample of BLS1 galaxies enables us to study trends across the whole AGN population; and to distinguish between physical processes operating only within the NLS1 population, and those which are relevant for AGN as a class.
This paper is the fourth in a sequence. The first one concentrated on the differences in the narrow-line region (NLR) density of BLS1 and NLS1 galaxies (Xu et al. 2007, hereafter X07), the second demonstrated that NLS1 and BLS1 galaxies follow the same relation if “blue outliers” are removed from the sample (Komossa & Xu 2007, hereafter KX07), and the third discussed the properties of Seyfert galaxies with extreme outflows (“blue outliers”; Komossa et al. 2008, hereafter K08). In this fourth paper of the sequence, we focus on sample properties and correlation analyses. This paper is organized as follows. In Section 2 we describe the sample selection and the methods of data analysis. Section 3 reports the results obtained from the emission-line and continuum measurements. In Section 4 and 5 results from our correlation analyses and cross-correlation analysis are given, which are then discussed and interpreted in Section 6. We conclude with a summary in Section 7.
We use the terms NLS1 galaxies and BLS1 galaxies collectively for high-luminosity and low-luminosity objects, i.e., jointly for Seyfert galaxies and quasars. Throughout this paper, a cosmology with km s-1 Mpc-1, and is adopted.
2 Data analysis
2.1 The sample
Our sample consists of NLS1 galaxies from the catalog of Véron-Cetty & Véron (2003), to which we added a comparison sample of BLS1 galaxies from Boroson (2003) at , first presented by X07. All galaxies have been observed in the course of the Sloan Digital Sky Survey (SDSS) (Data Release 3; Abazajian et al. 2005) and have detectable low-ionization emission lines (in particular, [S II] 6716, 6731 is always present with S/N 5). The sample of NLS1 galaxies has similar redshift and absolute magnitude distribution as the BLS1 galaxy sample. The original sample selection, data preparation, and data analysis methods are described in detail by X07. Here, we briefly summarize the procedures in Sect. 2.2 and 2.3. For the first time, we present our measurements for the full sample in table form (Table 1). While the focus of our study is on NLS1 galaxies, having a comparison sample of BLS1 galaxies is important. Our BLS1 sample contains approximately equal numbers as the NLS1 sample. While this is the best approach for comparison purposes, we also note that in observations, NLS1 galaxies make only approximately 20% of the Seyfert 1 population.
2.2 Decomposition of starlight and nuclear continuum
All SDSS spectra were corrected for Galactic extinction, the continuum was decomposed into host galaxy and AGN components (Lu et al. 2006), and then we subtracted the starlight component, nuclear continuum and the Fe II complexes from the spectra. More precisely, the spectra were decomposed into the following four components (see X07 for details): (1) A starlight component modeled by 6 synthesized galaxy templates, which were built from the synthetic spectral library of Bruzual & Charlot (2003). The details of the algorithm were described in Lu et al. (2006). (2) A power-law continuum to represent the AGN continuum. (3) A Balmer continuum generated in the same way as Dietrich et al. (2003). (4) An Fe II template given by Véron-Cetty & Véron (2004). The final multicomponent fit including the Fe II complexes was then subtracted from the observed spectrum and the emission line properties were measured in the way described in Sect. 2.3.
2.3 Emission line fits
Emission line profiles of the galaxies were fit with Gaussians and/or Lorentzians using the IRAF package SPECFIT (Kriss 1994). Measured FWHMs were corrected for instrumental broadening. Complex emission lines, which cannot be represented by a single Gaussian profile, were decomposed into multiple components. The Balmer lines were decomposed into a narrow and a broad component representing emission from the NLR and BLR, respectively. The narrow core was fit employing a single Gaussian profile with FWHM fixed to that determined for [S II] 6716, 6731. As in previous work (e.g., Rodriguez-Ardila et al. 2000, Dietrich et al. 2005, X07, Mullaney & Ward 2008), the broad component was fit by using a combination of two Gaussian profiles, or alternatively a single Lorentzian profile (e.g., Véron-Cetty et al. 2001, Sulentic et al. 2002). For the approach employing the two-Gaussian profile fit, the final width of the broad-line emission, H, is determined as the FWHM of the sum of the two Gaussians. We do not assign a physical meaning to the two separate broad components; they merely serve as a mathematical description of the complex shapes of the broad lines. While comparable and equally reasonable results can be achieved with both single Lorentzian and two Gaussian profiles for most broad components of the Balmer lines of NLS1 galaxies, generally no acceptable fit is possible when employing the Lorentzian profiles to fit BLS1 galaxies. Among the NLS1 galaxies, line width measurements between Lorentzian and Gaussian fits typically agree within 20%, Lorentzian profiles always resulting in smaller FWHMs, as expected. We finally used the results of the multi-Gaussian fits (Table 1) for the NLS1 classification and also for further correlation analysis. This allows a direct comparison with the BLS1 control sample, and also with several previous studies (e.g. Boroson & Green 1992, Grupe et al. 1999, Vaughan et al. 2001).
Apart from the Balmer lines, [O III] shows a complex profile. The total [O III] profile, [O III]total was decomposed into two Gaussian components: a narrow core and a broad base. The narrow core of [O III] is referred to as [O III]c. Measurements of the FWHM and blueshift of [O III] (Table 1) refer to the core of [O III], unless noted otherwise. The velocity shift of [O III] was measured relative to [S II]. We use positive velocity values to refer to blueshifts, negative ones for redshifts. All other forbidden lines were well fit with single Gaussian profiles.
The strength of the Fe II emission, R4570, was measured as the ratio of the flux of the Fe II complex between the rest wavelengths 4434 and 4684 Å to that of total H emission. The strength of the [O III] emission, R5007, was measured as the flux ratio of total [O III] 5007 over total H emission. “Total” H emission refers to the sum of broad and narrow component.
2.4 A note on NLS1 classification
After re-classification based on spectral emission-line fitting, we have 39 BLS1 and 55 NLS1 galaxies in our sample. The standard classification criterion of NLS1 galaxies is according to FWHM(H) 2000 km s-1 (Goodrich 1989) which is most commonly applied. Such NLS1 galaxies usually come with weak [O III]/H and strong Fe II/H which form part of the classification criteria (Osterbrock & Pogge 1985, Goodrich 1989, Véron-Cetty et al. 2001). We note in passing that Sulentic et al. (2001) rather suggest to use FWHM(H) 4000 km s-1 as ‘dividing’ value, because they find AGN properties to change more significantly at that value. Furthermore, a few authors pointed out that NLS1 classification should incorporate a luminosity dependence of the FWHM(H) cut-off (e.g., Laor 2000, Véron-Cetty et al. 2001, Shemmer et al. 2004). Netzer & Trakhtenbrot (2007) suggest to base NLS1 classification on the Eddington ratio, and use for NLS1 galaxies. In the current study, we continue to use the classical FWHM cut-off of FWHM(H) 2000 km s-1 which is still most commonly used. Results (Table 1) are reported in dependence of FWHM(H) and , so that other cut-off values could be easily applied to our sample.
3 Emission-line and AGN properties
Results from our emission-line and continuum measurements are listed in Table 1. Relevant parameters of the continua and emission lines were used to derive some AGN parameters, including black hole masses and Eddington ratios (Figure 1). We describe below how we determined these parameters.
Assuming that the motion of the BLR clouds is virialized (e.g., Wandel et al. 1999), the black hole mass can be estimated as . The velocity of the BLR clouds can be estimated from the FWHM as , by assuming an isotropic cloud distribution. There is only few reverberation mapping results for NLS1 galaxies so far (Peterson et. al. 2000, Bentz et al. 2009). We assumed that the relation between the radius of the BLR and the optical luminosity, established from reverberation mapping for nearby Seyfert galaxies (e.g., Peterson et al. 2004; Kaspi et al. 2005) is indeed applicable to NLS1 galaxies (e.g., Komossa et al. 2006).
We estimated the black hole masses of our NLS1 and BLS1 galaxies using the – relation given by Kaspi et al. (2005). The luminosity was derived from the SDSS photometry111 The SDSS photometry calibration is more robust given that the imaging data is taken on moonless photometric nights under good seeing conditions (Hogg et al. 2001), while spectroscopy is done on those nights that are not photometric, or with seeing worse than 1.7 FWHM, or with a moderate amount of moon (e.g., Abazajian et al. 2003). Moreover, the SDSS spectrophotometric fluxes before Data Release 6 were tied to fiber magnitudes that led to an under-estimation in the spectrophotometric scale (Adelman-McCarthy et al. 2008). Magnitudes used to derive black hole masses include a contribution from host galaxies. However, most of our objects are AGN dominated and thus the contamination from host galaxies is small. We compared our fluxes derived from the SDSS photometry to the spectroscopic fluxes and found that differences of flux scale between the two calibrations can reach at maximum 35%. . The PSF and magnitudes (Galactic extinction corrected) were used to determine the continuum slope (e.g., Wu & Liu 2004) and the flux density at 5100 Å rest frame. The FWHM of the broad component from the multi-Gaussian fit of H, FWHM(H) (Table 1), was used for the black hole mass estimates reported in Table 1. An error in black hole mass is typically 0.5 dex, which arises from the use of single-epoch data (e.g., Vestergaard 2004), and uncertainties in H decomposition and in host galaxy contribution.
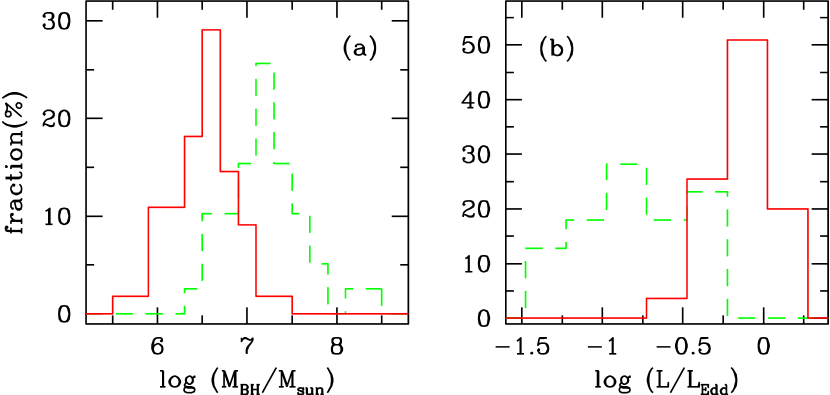
The NLS1 galaxies of our sample have, on average, smaller black hole masses than BLS1 galaxies. The estimated black hole masses of NLS1 galaxies range from to with an average value of , while BLS1 galaxies range from to with an average value of (Figure 1).
Eddington ratios, represented by , were calculated from the deduced black hole masses, according to . For bolometric luminosity correction, we assumed (Kaspi et al. 2000). As shown previously, NLS1 galaxies exhibit, on average, higher Eddington ratios than BLS1 galaxies. Eddington ratios of the NLS1 galaxies of our sample range from to with an average value of , while BLS1 galaxies range from to with an average value of .
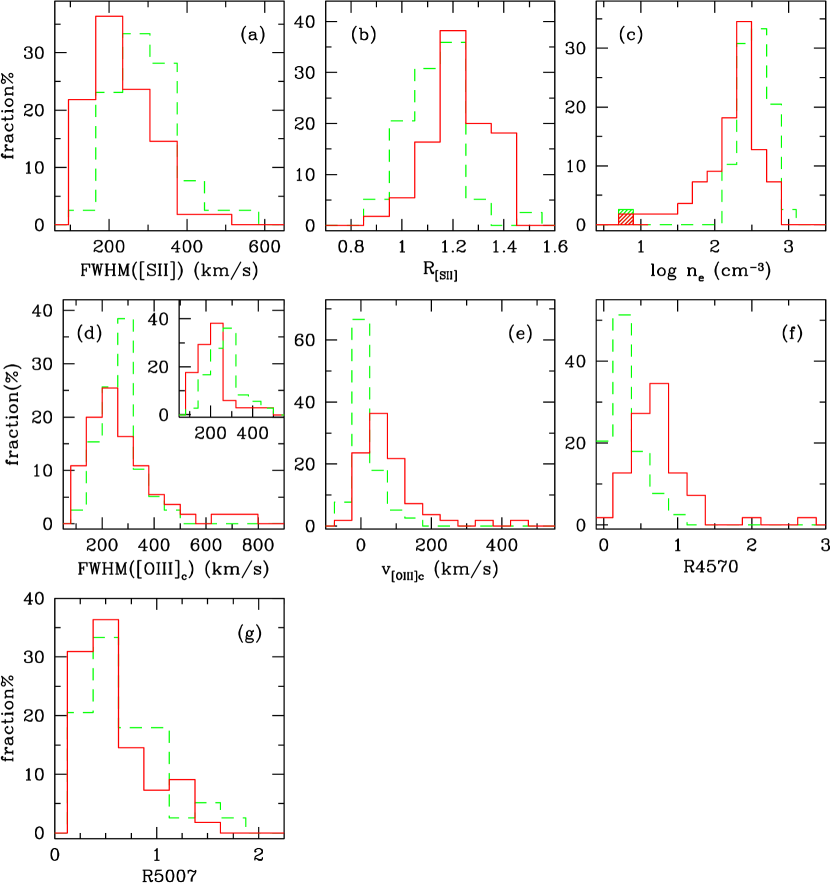
The distributions of black hole masses and Eddington ratios are shown in Figure 1a and 1b, respectively. We have also applied a Kolmogorov-Smirnov (K-S) test, in order to confirm that the two distributions for NLS1 and BLS1 galaxies are significantly different. Indeed, for both the distributions, we find a K-S probability of that the two samples are drawn from the same parent population. For comparison, we also plot histograms of other properties (Figure 2); some of these reflecting trends we reported previously. (1) The distribution of FWHM([S II]) (Figure 2a) shows narrower [S II] in NLS1 galaxies than BLS1 galaxies (KX07). (2) The distribution of [S II] intensity ratios and the NLR density (Figure 2b and 2c) demonstrate our discovery of a zone of avoidance in density, in the sense that BLS1 galaxies avoid low densities, while NLS1 galaxies show a larger scatter in density, including a significant number of objects with low densities (X07). (3) The distribution of FWHM([O III]c) reflects that NLS1 galaxies have similar [O III]c widths as BLS1 galaxies (Figure 2d). However, if we exclude galaxies with high velocity shifts (i.e., 75 km s-1), NLS1 and BLS1 galaxies show different scatter (the inset of Figure 2d) (KX07). (4) The distribution of velocity shifts of [O III] core lines (Figure 2e) reflects that NLS1 and BLS1 galaxies differ in [O III] outflow velocity, in the sense that NLS1 galaxies have higher blueshifts of [O III] core lines than BLS1 galaxies, including a number of “blue outliers” with extreme blueshifts (K08). (5) The distributions of optical Fe II and [O III] strength (Figure 2f and 2g) indicate that NLS1 galaxies have stronger Fe II emission than BLS1 galaxies, and similar [O III] emission as BLS1 galaxies (X07).
We list in Table 1 the key properties of our sample. Column (1) gives celestial coordinates in RA and DEC. Column (2) gives galaxy name. Column (3) gives the redshift. Column (4) lists the SDSS -band absolute magnitude, derived from the PSF magnitude. Column (5) lists the FWHM of the broad component of H in km s-1. Column (6) lists the ratio of total [O III] over total H emission. Column (7) lists the ratio of Fe II 4570 over total H emission. Column (8) lists the FWHM of [S II] in km s-1. Column (9) lists the FWHM of the core of [O III] in km s-1. Column (10) lists the [O III]c velocity shift (blueshift) with respect to [S II] in km s-1. Column (11) lists the [S II] intensity ratio of [S II] . Column (12) lists the NLR electron density in cm-3, estimated from the density-sensitive [S II] intensity ratio (see X07 for details). Column (13) lists the flux density at 5100 Å restframe in 10-17 erg s-1 cm-2 Å-1. Column (14) lists the of the monochromatic luminosity at 5100 Å. Column (15) lists the of the Eddington ratio. Column (16) lists the of the black hole mass. The key sample properties of NLS1 and BLS1 galaxies are summarized in Table 2.
4 Correlation analyses
We now focus on studying trends across our sample, in order to perform a comparison with previously known correlations derived for different NLS1 samples, and to identify new trends. We have performed two types of correlation analyses. First, a Spearman rank order correlation analysis was used to determine which parameters are correlated and to derive the significance of the correlations. Second, we have performed a principle component analysis (PCA; e.g. Pearson 1901, Duda et al. 2001). The PCA is a commonly applied method aimed at identifying the strongest correlations and the underlying parameters. This method allows us to link together diverse correlations into meaningful groups and reveal the physical mechanisms driving these correlations (for further discussion, and some caveats, see Boroson 2004).
4.1 Spearman rank order correlations
In a first step we computed Spearman rank order correlation coefficients between 11 of the key properties of our sample which were given in Table 1. These correlations involve emission-line widths (FWHM(H), FWHM([S II]) and FWHM([O III]c)), emission-line ratios (R5007, R4570, the ratio R[SII] defined as the intensity ratio of [S II] , and the inferred NLR density ), and the parameters , , and .
We note in passing that we have included both parameters, R[SII] and , in the correlation analysis. Even though strongly dependent on each other, their dependence is not linear, and we have therefore kept both parameters. Correlations with are slightly stronger than with R[SII].
Table 3 shows the results of our correlation analysis. We have split our sample into three groups; the NLS1 galaxies (55 objects), the BLS1 galaxies (39 objects), and the whole sample, and we have run the correlation analysis separately for each of the three, and separately report correlation coefficients in Table 3. All correlations with Spearman rank probabilities are marked in boldface. Figure 3 displays the correlation diagrams for several key parameters.
The strongest (anti-)correlation among independent parameters involves the strength of Fe II over total H emission, R4570. Among directly observed parameters, the clearest anti-correlation is between R4570 and the width of the broad component of H, FWHM(H). The trend is significant for the whole sample, with a Spearman rank order correlation coefficient of . This anti-correlation remains strong among the NLS1 and BLS1 galaxy sub-populations. In addition, we also confirm the known anti-correlation between the strengths of Fe II (R4570) and [O III] (R5007), which again is apparent in the full sample, and the two subsamples. The third strong correlation involving R4570, which persists across the BLS1 and NLS1 subsample, is the one between R4570 and (). That correlation is stronger than with luminosity (no correlation at all) or with black hole mass, suggesting that is the more fundamental parameter.
Two further correlations which involve the width of H echo the trend we have already reported previously: the correlation between FWHM(H) and density, which becomes apparent for the full sample (X07), and the correlation between and FWHM([O III]c) (K08), which is prominent in NLS1 galaxies (), but absent in BLS1 galaxies.
We have also investigated correlations among the widths of H, [S II], and [O III]. While there is no correlation between FWHM(H) and FWHM([S II]) for each subsample, such a trend becomes apparent across the full sample. The finding that a correlation between FWHM([S II]) and FWHM([O III]c) is significant among BLS1 galaxies with , but does not exist at all among the NLS1 galaxies, was already explained by K08: a subsample of NLS1 galaxies (so called blue-outliers) have a peculiarly broadened extra-component in [O III] (K08), and these few blue outliers destroy the expected correlation. If we remove from our NLS1 sample all those galaxies which show evidence for blue outliers (explicitly, objects with [O III] blueshifts exceeding km s-1), then we also find a correlation between FWHM([S II]) and FWHM([O III]c) in our NLS1 sample ().
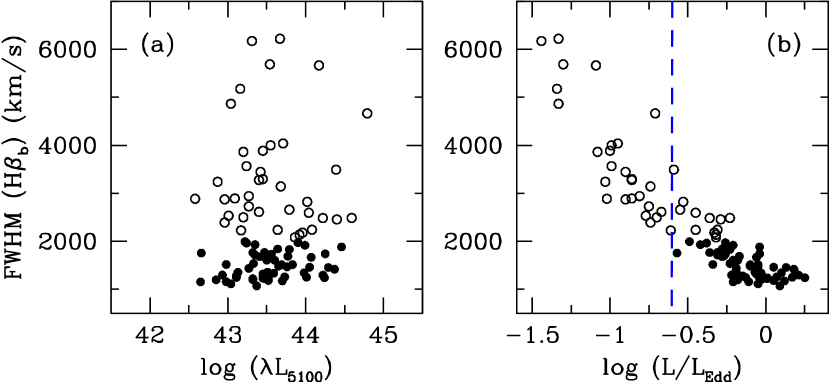
We note that the width of H does not systematically increase with continuum luminosity . This shows that NLS1 classification does not strongly depend on luminosity (Figure 4a). We also note in passing, that all of our NLS1 galaxies fulfill the criterion of Netzer & Trakhtenbrot (2007) of (Figure 4b).
We would like to recall here the well-known fact that correlation analyses depend on the parameters considered, and they may not reveal the ultimate underlying correlation or driver. Two parameters may simply correlate because both depend on a third parameter which was not considered in the analysis. However, simple correlation analysis is a useful first step in searching for trends across data sets, and is a commonly used method, and in that sense we also applied it. As next step toward the final goal of identifying the strongest correlations in our sample and finding the key physical drivers behind them, we have applied a principal component analysis.
4.2 Principal component analysis (PCA)
PCA is a mathematical technique to convert a set of observations of possibly correlated variables into a set of values of uncorrelated variables called principal components, or eigenvectors. The eigenvectors as a whole reproduce the original data space, and are orthogonal to each other. Eigenvector 1 (hereafter EV1) accounts for the largest variance of the data among the original measured variables, and Eigenvector 2 (hereafter EV2), being orthogonal to (uncorrelated with) the first, represents the second greatest variance. Eigenvalues are defined as the fraction of the variance that each eigenvector accounts for. A good account of the application of PCA in astronomy can be found in Francis & Wills (1999).
In a second step, we have run a PCA222we used the software available at http://www.classification-society.org/csna/mda-sw/ on the following input parameters: , FWHM(H), R5007, R4570, FWHM([S II]), and R[SII]. Each parameter represents independent information. Note that for the first time we involve the NLR density (reflected by the ratio R[SII]) in the PCA. The results of the PCA are summarized in Table 4 (see also Figure 5 and Figure 6).
We find that EV1 accounts for 38% of the variance in the data. EV1 is significantly (anti-)correlated with R4570, FWHM(H), R[SII], FWHM([S II]) and . When EV1 decreases, R4570 increases, outflow velocity becomes stronger and R[SII] increases, while R5007, FWHM(H) and FWHM([S II]) decrease. EV2 accounts for 18% of the variance. EV2 is mostly anti-correlated with the absolute magnitude and correlated with FWHM([S II]).
In order to understand the relationship between the physical properties of AGN and the first two prime eigenvectors, we test correlations between EV1 and EV2 and , , , and , respectively (Figure 5), using the Spearman rank correlation test (Table 5). It can be seen that EV1 of our sample strongly correlates with , in addition to and , while EV2 with and .
Figure 6 shows the distribution of the objects of our sample in the EV1-EV2 space. In order to examine the dependence of the distribution on different parameters, each parameter is divided into three bins and coded by symbol size. The size of each point refers to coding according to [O III]c blueshift, R[SII], FWHM[SII], R4570, , , respectively. It is interesting to note that some of the objects with extreme values of EV1 and EV2 can be isolated from the EV1-EV2 diagram. We find that several “blue outliers” are located at the upper left corner of the figure (Figure 6a). This regime is also dominated by objects with strong Fe II emission and high (Figure 6d and 6e). We also note that objects with high R[SII] fall at the low end of EV1 of the diagram (Figure 6b), and objects with high black hole mass are found preferentially at the high end of EV1 (Figure 6f).
5 The large-scale environment
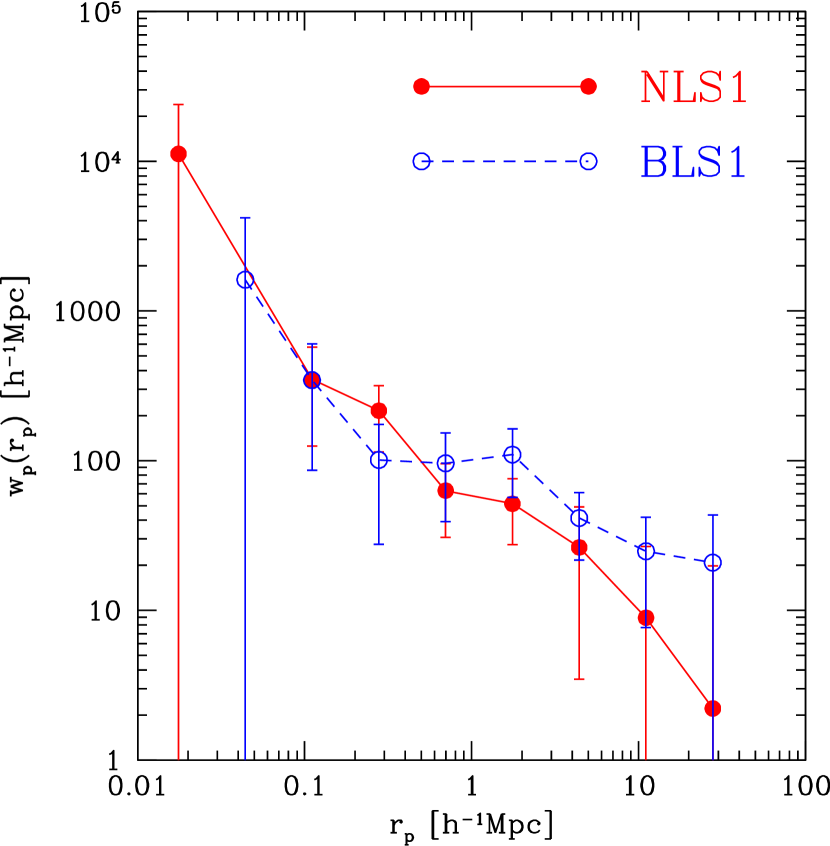
In order to probe the large-scale environment of the galaxies in our sample, and to search for possible differences in the environment of the NLS1 galaxies in comparison to the BLS1 galaxies, we have used the projected redshift-space two-point cross-correlation function (2PCCF), . We calculated the 2PCCF between the NLS1 or BLS1 galaxy samples and a reference sample of about half a million galaxies selected from the main spectroscopic sample of the SDSS final data release (DR7; Abazajian et al. 2009). A random sample was constructed so as to have the same selection effects as the reference sample. The reference and random samples were cross-correlated with the same set of galaxies (the NLS1 or BLS1 galaxy samples), and as a function of the projected separation was defined by the ratio of the two pair counts minus one. Details about our methodology for computing the correlation functions and for constructing the reference and random samples can be found in Li et al. (2006). For consistency, we restricted our reference galaxies to the same redshift range as our NLS1/BLS1 samples, i.e.,
The amplitude of 2PCCF on scales larger than a few Mpc provides a direct measure of the mass of the dark matter halos that host the galaxies through the halo mass-bias relation. As shown in Li et al. (2008), the amplitude of the correlation function on scales kpc can serve as a probe of physical processes such as mergers or galaxy-galaxy interactions. On intermediate scales, the correlation probes the so-called ’1-halo’ term where the pair counts are dominated by galaxy pairs in the same dark matter halo. Therefore, the 2PPCF is a powerful measure of “environment” in the sense that it encapsulates information about how galaxy properties depend on the overdensity of the galaxy environment over a wide range of physical scales.
In Figure 7 we compare the 2PCCFs estimated for our NLS1 and BLS1 galaxies. We do not see significant difference in between the two classes of galaxies, over all the spatial scales probed (). This indicates that, to the first order, NLS1 and BLS1 galaxies are found in similar environments.333It is well known that the clustering of galaxies strongly depends on their host properties. In order to perform a more detailed comparison, than we have done so far, a close matching of all involved samples in host galaxy properties, like luminosity, color and morphology, is required.
6 Discussion
Previous observations and their interpretation strongly indicate that NLS1 galaxies are AGN with low mass black holes typically accreting near the Eddington rate. As such, NLS1 galaxies as a class may hold important clues on black hole growth and evolution (e.g., Mathur et al. 2001), and on feeding and feedback in the course of galaxy evolution. We have therefore studied and homogeneously analyzed a large sample of NLS1 galaxies, accompanied by a comparison sample of BLS1 galaxies analyzed in the same way. This paper of the sequence has focused on correlation analyses, and PCA in particular.
6.1 PCA and Eigenvector space
PCA has previously turned out to be a powerful tool in uncovering trends and correlations among AGN samples (e.g., Boroson & Green 1992, Brandt 1999, Sulentic et al. 2000, 2002, Marziani et al. 2001, Grupe 2004, Wang et al. 2006, Sulentic et al. 2007, Zamfir et al. 2008, Mao et al. 2009, Kuraszkiewicz et al. 2009, Marziani et al. 2010; see Boroson 2004 for a critical assessment of advantages and shortcomings of this method). However, it has been also noted that PCA are specific to the samples examined, depending on the observed properties used, as well as on the ranges of the parameters (e.g., Grupe 2004). Different eigenvectors may emerge from different samples. Adding new elements to PCA is therefore of great importance to verify the reality of the correlations, and furthermore to unveil the physical properties which determine the observable characteristics of AGN.
The most popular interpretation of EV1 by far has been that EV1 is likely to be driven by the Eddington ratio (e.g., Sulentic et al. 2000, Boroson 2002, Grupe 2004). For the first time, we included the NLR density in the PCA, and have shown that EV1 of our sample is highly correlated with density, in addition to . EV2 of our sample is dominated by luminosity and therefore accretion rate (proportional to luminosity), which matches the interpretation of EV2 of Boroson (2002).
One key advantage of PCA is to discriminate between the various classes of objects according to their loci on the EV1-EV2 plane. The identification of objects that represent extremes are particularly crucial because their properties may suggest the nature of the physical parameter that governs the correlations (e.g., Boroson 2004). The similarities of the first two eigenvectors of our sample and Boroson (2002) allow a comparison of extreme objects in the EV1-EV2 diagram.
We earlier found that NLS1 galaxies have higher blueshifts of the cores of their [O III] emission lines than BLS1 galaxies, including a number of “blue outliers” with extreme outflows (K08). Several of these blue outliers are located in the high Eddington ratio and high luminosity corner of the EV1-EV2 diagram (Figure 6). Interestingly, broad absorption line (BAL) QSOs, which show high outflow velocities in their absorption-line spectra (e.g., Weymann et al. 1991), fall into a similarly extreme locus (e.g., Boroson 2002) as the blue outliers of our sample, therefore pointing to possible links between these two source classes. Possibly, they bridge a gap between NLS1 galaxies and BAL QSOs (see the discussion of, e.g., Brandt & Gallagher 2000 on general similarities between NLS1 galaxies and BAL quasars). UV spectroscopy is needed to see whether the BAL fraction is high in these extreme blue outliers.
6.2 Links between central engine and host properties
Based on the correlation analyses we carried out, the strongest correlations among the directly measured parameters of our sample are between FWHM(H), R4570 and R5007, confirming previous studies (e.g., Boroson & Green 1992, Grupe 2004). This confirmation is of interest, because few independent large NLS1-BLS1 samples exist, for which a rigorous correlation analysis has been performed. Samples had different selection effects (e.g., soft X-ray selection), and therefore new NLS1 samples which were selected differently from previous ones are important to check the persistency of trends.
More importantly, we have shown that density is as important an ingredient in correlation space as Eddington ratio. Including density is of particular interest, because the NLR density is representative of the interstellar medium (ISM) of the host galaxy, and this study therefore links the NLS1 central engine properties with the host galaxy. Host properties are otherwise not easily accessible, and have only been studied for a few samples of NLS1 galaxies, focusing on the host morphology (Crenshaw et al. 2003, Deo et al. 2006, Ohta et al. 2007). Especially, host properties of NLS1 galaxies are an independent indicator of their evolutionary stage (Mathur et al. 2011, Orban de Xivry et al. 2011).
Several factors can affect the density of the ISM of the host galaxy. Winds and outflows on the one hand (e.g., Schiano 1986, Kaiser et al. 2000), (bar-driven) inflows on the other hand (e.g., Shlosman et al. 1990, Riffel et al. 2008). We comment on each of them in turn.
Winds/outflows are seen in nearby Seyfert galaxies (e.g., Kraemer et al. 2008, Wang et al. 2010) and in NLS1 galaxies in particular (e.g., Komossa et al. 2008, Zhang et al. 2011). These can be disk-wind driven, or also be powered by radio jets (Morganti et al. 2010). The latter effect is unlikely to dominate in NLS1 galaxies. Even though a small fraction of them shows evidence for relativistic jets in radio and gamma-rays (e.g., Zhou et al. 2003, Yuan et al. 2008, Komossa et al. 2006, Abdo et al. 2009, Foschini 2011), the majority of them is less radio-loud, on average, than BLS1 galaxies (Komossa et al. 2006), and rarely shows widely extended radio emission. Eddington-driven winds are more likely (e.g., Grupe 2004), given the high values of of NLS1 galaxies. These winds may extend into the inner NLR (Proga et al. 2008), and possibly further. Galaxy merger simulations predict large-scale outflows (e.g., di Matteo et al. 2005), but the merger fraction among NLS1 galaxies is still poorly constrained (e.g., Krongold et al. 2001), and we do not find a strong excess of pairing among our sample.
On the other hand, recent studies indicate an excess of bars in NLS1 galaxies (Crenshaw et al. 2003, Ohta et al. 2007), and bar-driven instabilities might work at replenishing the NLR with (low-density) gas. Indeed, theoretical studies have shown that bars are efficient to transport large amounts of gas inward (e.g., Shlosman et al. 1990). Simulations have further shown that strong bars drive the formation of, and maintain grand-design nuclear dust spiral structures in the central kiloparsec of galaxies (e.g., Maciejewski 2004a,b). The gas loses its angular momentum to the bar via nuclear spiral shocks and is eventually concentrated in a narrow nuclear ring if it follows closely the periodic orbits in the bar (e.g., Patsis & Athanassoula 2000, Maciejewski et al. 2002). Regarding NLS1 galaxies, uninterrupted asymmetries able to drive gas inwards all the way from a few kpc down to a few tens of pc (e.g., Orban de Xivry et al. 2011) are detected. In particular, NLS1 galaxies show a higher fraction of grand-design dust spirals within and stellar nuclear rings than BLS1 galaxies (Deo et al. 2006). Bar instabilities can also drive the formation of pseudo-bulges by internal secular processes (e.g. Kormendy & Kennicutt 2004). Such secular processes in NLS1 galaxy have been inferred based on bulge-disc decompositions (Ryan et al. 2007, Mathur et al. 2011, Orban de Xivry et al. 2011).
Well-resolved host images are not yet available for the bulk of the NLS1 galaxies of our sample, for further distinguishing between the two scenarios discussed above, but could be obtained in the future with HST. Combining other host galaxy properties (structure, presence and properties of bars, stellar populations) with emission-line properties into correlation analyses will be another important future step.
7 Summary and conclusions
We have studied the correlations among the measured and derived properties of a sample of NLS1 and BLS1 galaxies on the basis of a principle component analysis. For the first time, we have involved the density of the narrow-line region (measured by the density-sensitive ratio of the two emission lines [S II] 6716,6713) in such an analysis. A nearest-neighbor analysis of the large-scale environment of NLS1 galaxies was also performed. Our main results can be summarized as follows:
-
•
We have found that, among the parameters measured in this sample, the density of the narrow-line region is a key element of Eigenvector 1 (EV1), as important as the Eddington ratio . This is of particular interest, because it links the central engine and the host properties.
-
•
Apart from this new finding, we also confirm several previously known trends, especially the strong correlations involving the line width of H, and the strength of the Fe II complex and [O III] 5007 emission. In addition to density, plays a significant role in affecting EV1 of our sample, while EV2 is related to luminosity. NLS1 and BLS1 galaxies are well separated in EV1 space, while they are not distinguished in EV2 space.
-
•
Accretion-driven winds on the one hand, or bar-driven inflows on the other hand, may play a role in explaining the links between the immediate vicinity of the supermassive black hole (SMBH) on the one hand (as traced by Eddington ratio and broad-line width, for instance), and the properties (especially density) of the host galaxy on the other hand.
-
•
Several galaxies with strong blueshifts of [O III] (“blue outliers”) lie in the high Eddington ratio and high luminosity regime in the EV1-EV2 space, possibly sharing these properties with broad absorption line QSOs, and therefore suggesting possible connections between these two source classes.
-
•
To the first order, the NLS1 and BLS1 galaxies of our sample are found to reside in similar large-scale environments. While this needs to be confirmed with larger samples, it tentatively indicates the lack of an excess of mergers among NLS1 galaxies.
Large-sample analyses of NLS1 galaxies and their remarkable properties are an important new approach in our understanding of black hole growth, accretion modes, feeding and feedback, and of aspects of galaxy – SMBH co-evolution and the role of secular evolution.
References
- Abazajian et al. (2003) Abazajian, K., et al. 2003, AJ, 126, 2081
- Abazajian et al. (2005) Abazajian, K., et al. 2005, AJ, 129, 1755
- Abazajian et al. (2009) Abazajian, K., et al. 2009, ApJS, 182, 543
- Abdo et al. (2009) Abdo, A. A., et al. 2009, ApJ, 707, L 142
- Adelman-McCarthy et al. (2008) Adelman-McCarthy, J. K., Agüeros, M. A., Allam, S. S., et al. 2008, ApJS, 175, 297
- Bentz et al. (2009) Bentz, M. C., Peterson, B. M., Netzer, H., Pogge, R. W., & Vestergaard, M. 2009, ApJ, 697, 160
- Boroson & Green (1992) Boroson, T. A., & Green, R. F. 1992, ApJS, 80, 109
- Boroson (2002) Boroson, T. A. 2002, ApJ, 565, 78
- Boroson (2003) Boroson, T. A. 2003, ApJ, 585, 647
- Boroson (2004) Boroson, T. A. 2004, ASP Conf. Ser., 311, 3
- Brandt (1999) Brandt, W. N. 1999, ASP Conf. Ser., 161, 166
- Brandt & Gallagher (2000) Brandt, W. N., & Gallagher, S. C. 2000, NewAR, 44, 461
- Bruzual & Charlot (2003) Bruzual, D., & Charlot, S. 2003, MNRAS, 344, 1000
- Centrella et al. (2010) Centrella, J., Baker, J. G., Kelly, B. J., & van Meter, J. R. 2010, Rev. Mod. Phys., 82, 3069
- Crenshaw et al. (2003) Crenshaw, D. M., Kraemer, S. B., & Gabel, J. R. 2003, AJ, 126, 1690
- Deo et al. (2006) Deo, R. P., Crenshaw, D. M., & Kraemer, S. B. 2006, AJ, 132, 321
- Dietrich et al. (2003) Dietrich, M., Hamann, F., Appenzellar, I., & Vestergaard, M. 2003, ApJ, 596, 817
- Dietrich et al. (2005) Dietrich, M., Grenshaw, D. M., & Kraemer, S. B. 2005, ApJ, 623, 700
- di Matteo, Springel, & Hernquist (2005) di Matteo, T., Springel, V., & Hernquist, L. 2005, Nature, 433, 604
- Duda et al. (2001) Duda, R. O., Hard, P. E., & Stork, D. G., 2001, “Pattern Clasification”, Wiley & Sons
- Foschini (2011) Foschini, L. 2011, arXiv:1105.0772, Proceedings of the conference “Narrow-Line Seyfert 1 Galaxies and their place in the Universe”, published online at http://pos.sissa.it/cgi-bin/reader/conf.cgi?confid=126
- Francis & Wills (1999) Francis, P. J., & Wills, B. J. 1999, ASP Conf. Series, 162, 363
- Goodrich (1989) Goodrich, R. W. 1989, ApJ, 340, 190
- Grupe et al. (1999) Grupe, D., Beuermann, K., Mannheim, K., & Thomas, H.-C. 1999, A&A, 350, 31
- Grupe (2004) Grupe, D. 2004, AJ, 127, 1799
- Grupe et al. (2010) Grupe, D., Komossa, S., Leighly, K. M., & Page, K. L. 2010, ApJS, 187, 64
- Hogg et al. (2001) Hogg, D. W., Finkbeiner, D. P., Schlegel, D. J., & Gunn, J. E. 2001, AJ, 122, 2129
- Kaiser et al. (2000) Kaiser, M. E., et al., 2000, ApJ, 528, 260
- Kaspi et al. (2000) Kaspi, S., Smith, P. S., Netzer, H., et al. 2000, ApJ, 533, 631
- Kaspi et al. (2005) Kaspi, S., Maoz, D., Netzer, H., et al. 2005, ApJ, 629, 61
- Komossa et al. (2006) Komossa, S., Voges, W., Xu, D., Mathur, S., Adorf, H.-M., Lemson, G., Duschl, W., & Grupe, D. 2006, AJ, 132, 531
- Komosssa & Xu (2007) Komossa, S., & Xu, D. 2007, ApJ, 667, L33 (KX07)
- Komossa et al. (2008) Komossa, S., Xu, D., Zhou, H., Storchi-Bergmann, T., & Binette, L. 2008, ApJ, 680, 926 (K08)
- Komosssa (2008) Komossa, S. 2008, RevMexAA (Serie de Conferencias), 32, 86
- Kormendy & Kennicutt (2004) Kormendy, J., & Kennicutt, R. C., Jr. 2004, ARA&A, 42, 603
- Kraemer, Schmitt, & Crenshaw (2008) Kraemer, S. B., Schmitt, H. R., & Crenshaw, D.M. 2008, ApJ, 679, 1128
- Kriss (1994) Kriss, G. A. 1994, ASP Conf. Ser. 61, 437
- Krongold et al. (2001) Krongold, Y., Dultzin-Hacyan, D., & Marziani, P. 2001, AJ, 121, 702
- Kuraszkiewicz et al (2000) Kuraszkiewicz, J., et al. 2009, ApJ, 692, 1180
- Laor et al. (1997) Laor, A., Fiore, F., Martin, E., et al. 1997, ApJ, 477, 93
- Laor (2000) Laor, A. 2000, NewAR, 44, 503
- Li et al. (2006) Li, C., et al. 2006, MNRAS, 373, 457
- Li et al. (2008) Li, C., et al. 2008 MNRAS, 385, 1903
- Lu et al. (2006) Lu, H., Zhou, H., Wang, T., Dong, X., & Li, C. 2006, AJ, 131, 790
- Maciejewski et al. (2002) Maciejewski, W., Teuben, P. J., Sparke, L. S., & Stone, J. M. 2002, MNRAS, 329, 502
- Maciejewski (2004a) Maciejewski, W. 2004a, MNRAS, 354, 883
- Maciejewski (2004b) Maciejewski, W. 2004b, MNRAS, 354, 892
- (48) Mao, Y.-F., Wang, J., & Wei, J. Y. 2009, RAA, 9, 529
- Mathur, Kuraszkiewicz & Czerny (2001) Mathur, S., Kuraszkiewicz, J., & Czerny, B. 2001, NewA, 6, 321
- Mathur et al. (2011) Mathur, S., et al., 2011, arXiv:1102.0537
- Marziani et al. (2001) Marziani, P., Sulentic, J. W., Zwitter, T., Dultzin-Hacyan, D., & Calvai, M. 2001, ApJ, 558, 553
- Marziani et al. (2003) Marziani, P., Zamanov, R. K., Sulentic, J. W., & Calvani, M. 2003, MNRAS, 345, 1133
- Marziani et al. (2010) Marziani, P., et al. 2010, MNRAS, 409, 1033
- Morganti et al. (2010) Morganti, R., Holt, J., Tadhunter, C., & Oosterloo, T. 2010, IAU Symp. 267, 429
- Mullaney & Ward (2008) Mullaney, J. R., & Ward, M. J. 2008, MNRAS, 385, 53
- Netzer & Trakhtenbrot (2007) Netzer, H., & Trakhtenbrot, B. 2007, ApJ, 654, 754
- Ohta et al. (2007) Ohta, K., Aoki, K., Kawaguchi, T., & Kiuchi G. 2007, ApJS, 169, 1
- Osterbrock & Pogge (1985) Osterbrock, D. E., & Pogge, R. W. 1985, ApJ, 297, 166
- Patsis & Athanassoula (2000) Patsis, P. A., & Athanassoula, E. 2000, A&A, 358, 45
- Peason (1901) Peason, K. 1901, Philosophical Magazine 2, 559
- Peterson et al. (2000) Peterson, B. M., et al. 2000, ApJ, 542, 161
- Peterson et al. (2004) Peterson, B. M., et al. 2004, ApJ, 613, 682
- Proga., Ostriker, & Kurosawa (2010) Proga., D., Ostriker, J., & Kurosawa, R. 2010, ApJ, 676, 101
- Riffel et al. (2008) Riffel, R., et al. 2008, MNRAS, 385, 1129
- Rodriguez-Ardila et al. (2000) Rodriguez-Ardila, A., Binette, L., Pastoriza, M. G., & Donzelli, C. J. 2000, ApJ, 538, 581
- Ryan et al. (2007) Ryan, C. J., De Robertis, M. M., Virani, S., Laor, A., & Dawson, P. C. 2007, ApJ, 654, 799
- Schiano (1986) Schiano A. V. R. 1986, ApJ, 302, 81
- Shlosman, Begelman & Frank (1990) Shlosman, I., Begelman, M. C., & Frank, J. 1990, Nature, 345, 679
- Shemmer et al. (2004) Shemmer, O., Netzer, H., Mailolino, R., et al. 2004, ApJ, 614, 547
- Sulentic et al. (2000) Sulentic, J.W., Zwitter, T., Marziani, P., & Dultzin-Hacyan, D. 2000, ApJ, 536, L5
- Sulentic et al. (2002) Sulentic, J. W., Marziani, P., Zamanov, R., Bachev, R., Calvani, M., & Dultzin-Hacyan, D. 2002, ApJ, 566, L71
- Sulentic et al. (2007) Sulentic, J., Bachev, R., Marziani, P., Negrete, C.A., & Dultzin, D. 2007, ApJ, 666, 757
- Sulentic et al. (2008) Sulentic, J. W., Zamfir, S., Marziani, P, & Dultzin, D. 2008, RevMexAA (Serie de Conferencias), 32, 51
- Vaughan et al. (2001) Vaughan, S., Edelson, R., Warwick, R. S., et al. 2001, MNRAS, 327, 673
- Véron-Cetty, Véron & Gonçalves (2001) Véron-Cetty, M. P., Véron, P., & Gonçalves, A. C. 2001, A&A, 372, 730
- Véron-Cetty & Véron (2003) Véron-Cetty, M. P., & Véron, P. 2003, A&A, 412, 399
- Véron-Cetty, Joly & Véron (2004) Véron-Cetty, M. P., Joly, M., & Véron, P. 2004, A&A, 417, 515
- Vestergaard (2004) Vestergaard, M. 2004, ApJ, 601, 676
- Wandel et al. (1999) Wandel, A., Peterson, B. M., & Malkan, M. A. 1999, ApJ, 526, 579
- Wang et al. (2010) Wang, J., et al. 2010, ApJ, 719, L208
- Wang et al. (2006) Wang, J., Wei, J. Y., & He, X. T. 2006, ApJ, 638, 106
- Weymann et al. (1991) Weymann, R. J., Morris, S. L., & Foltz, C. B. 1991, ApJ, 373, 23
- Williams, Mathur, & Pogge (2004) Williams, J. M., Mathur, S., & Pogge, R. W. 2004, ApJ, 610, 737
- Wu & Liu (2004) Wu, X. B., & Liu, F. K. 2004, ApJ, 614, 91
- Orban de Xivry et al. (2011) Orban de Xivry, G., et al. 2011, MNRAS, 417, 2721
- Xu et al. (2007) Xu, D., Komossa, S., Zhou, H., Wang, T., & Wei, J. 2007, ApJ, 670, 60 (X07)
- Yuan et al. (2008) Yuan, W., et al. 2008, ApJ, 685, 801
- Zamfir, Sulentic, & Marziani (2008) Zamfir, S., Sulentic, J. W., & Marziani, P. 2008, MNRAS, 387, 856
- Zhang et al. (2011) Zhang, K., Dong, X., Wang, T., & Gaskell, C. M. 2011, ApJ, 737, 71
- Zhou et al. (2003) Zhou, H., Wang, T., Dong, X., Zhou, Y., & Li, C. 2003, ApJ, 584, 147
- Zhou et al. (2006) Zhou, H., Wang, T., Yuan, W., Lu, H., Dong, X., Wang, J. & Lu, Y. 2006, ApJS, 166, 128
| coordinates (J2000) | common name | FWHM(H) | R5007 | R4570 | FWHM([S II]) | FWHM([O III]c) | R[SII] | log | log | log | |||||
|---|---|---|---|---|---|---|---|---|---|---|---|---|---|---|---|
| (1)aa columns from left to right: (1) coordinates in RA (h,m,s) and DEC (d,m,s), (2) galaxy name, (3) redshift, (4) SDSS absolute i magnitude, (5) FWHM of the broad component of H in km s-1, (6) ratio of total [O III] over total H emission, (7) ratio of Fe II 4570 over total H emission, (8) FWHM of [S II] in km s-1, (9) FWHM of the core of [O III] in km s-1, (10) velocity shift (blueshift) of the core of [O III] with respect to [S II] in km s-1. (11) intensity ratio of [S II] , (12) NLR electron density in cm-3, (13) flux density at 5100 Å restframe in erg s-1 cm-2 Å-1, (14) of the monochromatic luminosity at 5100 Å, (15) of the Eddington ratio, (16) of the black hole mass. | (2) | (3) | (4) | (5) | (6) | (7) | (8) | (9) | (10) | (11) | (12) | (13) | (14) | (15) | (16) |
| 001903.17000659.2 | SDSSJ00190+0006 | 0.073 | -20.1 | 2870 | 0.7 | 0.2 | 200 | 160 | -10 | 0.99 | 630 | 15.9 | 43.0 | -0.9 | 6.7 |
| 002305.04010743.4 | 0020-0124 | 0.166 | -21.2 | 1330 | 0.3 | 1.2 | 180 | 320 | 90 | 1.31 | 110 | 13.7 | 43.6 | -0.03 | 6.5 |
| 002752.39002615.8 | Q0025+0009 | 0.205 | -22.2 | 2180 | 0.5 | 0.6 | 340 | 310 | -20 | 1.24 | 190 | 21.4 | 44.0 | -0.3 | 7.1 |
| 003238.20010035.2 | SDSSJ00326-0100 | 0.092 | -20.8 | 1760 | 0.6 | 0.6 | 180 | 110 | 40 | 1.18 | 270 | 23.0 | 43.3 | -0.4 | 6.5 |
| 003711.00002128.0 | SDSSJ00371+0021 | 0.235 | -22.1 | 1920 | 0.6 | 0.6 | 150 | 300 | 90 | 1.38 | 40 | 17.8 | 44.0 | -0.2 | 7.0 |
| 003847.97003457.4 | SDSSJ00387+0034 | 0.081 | -21.0 | 6170 | 0.5 | 0.1 | 370 | 310 | -60 | 1.00 | 610 | 29.1 | 43.3 | -1.4 | 7.6 |
| 010939.02005950.3 | RXJ01097+0059 | 0.093 | -21.0 | 2730 | 1.3 | 0.1 | 340 | 260 | 30 | 1.03 | 530 | 20.3 | 43.3 | -0.8 | 6.9 |
| 011448.68002946.1 | SDSSJ01148-0029 | 0.034 | -19.1 | 2880 | 0.6 | 0.4 | 200 | 200 | -10 | 1.47 | – | 29.8 | 42.6 | -1.0 | 6.5 |
| 011703.58000027.4 | 2E0114-0015 | 0.046 | -20.0 | 2390 | 0.2 | 0.4 | 280 | 310 | -10 | 1.12 | 360 | 39.2 | 43.0 | -0.7 | 6.5 |
| 011929.06000839.7 | NGC450-86 | 0.090 | -20.8 | 1220 | 0.5 | 0.9 | 300 | 380 | 220 | 1.23 | 200 | 23.8 | 43.3 | -0.04 | 6.2 |
| 012159.82010224.4 | IIZw1 | 0.054 | -20.9 | 3280 | 1.1 | 0.3 | 310 | 280 | 90 | 1.06 | 470 | 79.2 | 43.4 | -0.9 | 7.1 |
| 013521.68004402.2 | RXJ01354-0043 | 0.099 | -21.0 | 1710 | 1.1 | 0.5 | 250 | 620 | 240 | 1.33 | 90 | 21.5 | 43.4 | -0.3 | 6.5 |
| 013527.85004448.0 | SDSSJ01354-0044 | 0.080 | -20.7 | 2890 | 0.2 | 0.1 | 330 | 340 | 0 | 1.12 | 360 | 17.7 | 43.1 | -0.9 | 6.8 |
| 013940.99010944.4 | SDSSJ01396-0109 | 0.194 | -21.7 | 1690 | 1.0 | 0.3 | 250 | 310 | 80 | 1.24 | 190 | 15.3 | 43.8 | -0.2 | 6.8 |
| 014644.82004043.2 | NPM1G-00.0070 | 0.083 | -20.5 | 1350 | 0.4 | 0.4 | 220 | 140 | 90 | 1.24 | 190 | 18.2 | 43.1 | -0.2 | 6.2 |
| 014951.66002536.5 | SDSSJ01498+0025 | 0.252 | -21.7 | 2080 | 0.7 | 0.6 | 180 | 170 | 20 | 1.20 | 240 | 11.6 | 43.9 | -0.3 | 7.0 |
| 015652.43001222.0 | SDSSJ01568-0012 | 0.163 | -21.4 | 1510 | 0.5 | 1.1 | 330 | 280 | 0 | 1.27 | 150 | 17.9 | 43.7 | -0.1 | 6.6 |
| 020615.99001729.2 | MARK1018 | 0.043 | -21.6 | 4040 | 0.5 | 0.02 | 340 | 390 | 0 | 1.03 | 530 | 251 | 43.7 | -0.95 | 7.5 |
| 021359.78004226.8 | RXJ02139+0042 | 0.182 | -22.8 | 5670 | 1.8 | 0.00 | 470 | 370 | 0 | 1.18 | 270 | 43.6 | 44.2 | -1.1 | 8.1 |
| 022756.28005733.1 | SDSSJ02279+0057 | 0.128 | -20.2 | 1110 | 0.6 | 0.4 | 130 | 130 | 60 | 1.23 | 200 | 6.4 | 43.0 | -0.05 | 5.9 |
| 022841.48005208.6 | SDSSJ02286+0052 | 0.186 | -21.6 | 1170 | 0.7 | 0.9 | 270 | 390 | 90 | 1.36 | 60 | 14.2 | 43.7 | 0.1 | 6.4 |
| 025646.96011349.4 | S0254+0101 | 0.177 | -22.6 | 2590 | 0.6 | 0.3 | 570 | 470 | 30 | 1.07 | 450 | 34.2 | 44.0 | -0.5 | 7.3 |
| 030124.26011023.0 | SDSSJ03014+0110 | 0.072 | -20.7 | 2940 | 0.4 | 1.0 | 250 | 360 | 110 | 1.19 | 250 | 33.5 | 43.3 | -0.8 | 6.9 |
| 030144.20011530.9 | RXJ03017+0115 | 0.075 | -21.1 | 3450 | 0.6 | 0.4 | 340 | 300 | 40 | 1.13 | 340 | 43.2 | 43.4 | -0.9 | 7.2 |
| 030417.78002827.4 | KUG0301+002 | 0.045 | -19.7 | 1200 | 0.6 | 0.1 | 220 | 110 | 20 | 1.20 | 240 | 31.6 | 42.9 | -0.2 | 5.9 |
| 030639.57000343.2 | SDSSJ03066+0003 | 0.107 | -21.8 | 1840 | 0.6 | 0.2 | 330 | 380 | -30 | 1.20 | 240 | 35.8 | 43.6 | -0.3 | 6.8 |
| 031027.83004950.8 | KUV03079-0101 | 0.080 | -22.4 | 2820 | 0.3 | 0.5 | 270 | 130 | -10 | 1.19 | 250 | 150 | 44.0 | -0.5 | 7.4 |
| 032213.90005513.5 | KUV03197+0045 | 0.185 | -23.8 | 2490 | 0.3 | 0.3 | 300 | 270 | 50 | 1.05 | 490 | 110.8 | 44.6 | -0.2 | 7.7 |
| 032337.65003555.7 | SDSSJ03236+0035 | 0.215 | -22.8 | 1740 | 0.2 | 0.5 | 190 | 270 | 110 | 1.08 | 430 | 38.2 | 44.3 | -0.04 | 7.1 |
| 032606.75011429.9 | SDSSJ03261+0114 | 0.127 | -21.3 | 1230 | 0.5 | 0.9 | 330 | 530 | 180 | 1.13 | 340 | 16.4 | 43.5 | -0.01 | 6.3 |
| 032729.88005958.5 | SDSSJ03274-0059 | 0.134 | -21.5 | 5690 | 0.8 | 0.3 | 290 | 290 | 20 | 1.04 | 510 | 18.2 | 43.5 | -1.3 | 7.7 |
| 034131.95000933.0 | SDSSJ03415-0009 | 0.223 | -21.4 | 1480 | 0.6 | 0.7 | 200 | 170 | 10 | 1.36 | 60 | 8.9 | 43.7 | -0.1 | 6.6 |
| 075245.60261735.8 | RXJ07527+2617 | 0.082 | -21.4 | 1600 | 0.3 | 0.8 | 290 | 210 | 30 | 1.06 | 470 | 55.1 | 43.6 | -0.2 | 6.6 |
| 083949.65484701.5 | NPM1G+48.0114 | 0.039 | -19.8 | 1290 | 1.2 | 0.2 | 220 | 190 | 20 | 1.19 | 250 | 50.4 | 42.9 | -0.2 | 6.0 |
| 091313.73365817.3 | RXJ09132+3658 | 0.107 | -21.0 | 1680 | 1.0 | 0.5 | 160 | 350 | 150 | 1.38 | 40 | 21.3 | 43.4 | -0.3 | 6.5 |
| 092247.03512038.0 | SBS0919+515 | 0.160 | -22.3 | 1250 | 0.3 | 1.3 | 160 | 720 | 430 | 1.42 | 10 | 38.5 | 44.0 | 0.2 | 6.7 |
| 100405.00003253.4 | SDSSJ10040-0032 | 0.289 | -22.6 | 1410 | 0.4 | 2.0 | 150 | 140 | 40 | 1.21 | 230 | 28.8 | 44.4 | 0.2 | 7.0 |
| 101645.11421025.5 | RXJ10167+4210 | 0.055 | -21.2 | 1690 | 0.2 | 0.8 | 270 | 250 | 20 | 1.23 | 200 | 92.4 | 43.5 | -0.3 | 6.6 |
| 102434.72555626.5 | SBS1021+561 | 0.197 | -22.4 | 1660 | 0.6 | 0.7 | 200 | 240 | 50 | 1.20 | 240 | 29.9 | 44.1 | -0.1 | 7.0 |
| 102448.57003538.0 | SDSSJ10248+0035 | 0.095 | -20.8 | 1990 | 0.6 | 0.3 | 350 | 230 | 0 | 1.26 | 160 | 17.1 | 43.2 | -0.5 | 6.6 |
| 102531.29514034.9 | MARK142 | 0.045 | -20.6 | 1530 | 0.2 | 0.9 | 180 | 250 | 50 | 1.28 | 140 | 97.2 | 43.3 | -0.2 | 6.4 |
| 104210.03001814.7 | SDSSJ10421-0018 | 0.115 | -19.9 | 1150 | 0.3 | 0.9 | 170 | 210 | 50 | 1.33 | 90 | 6.8 | 43.0 | -0.1 | 5.9 |
| 104230.14010223.7 | SDSSJ10425+0102 | 0.115 | -20.8 | 1430 | 1.1 | 0.5 | 260 | 300 | 90 | 1.18 | 270 | 13.4 | 43.3 | -0.2 | 6.3 |
| 104332.88010108.8 | SDSSJ10435+0101 | 0.072 | -20.4 | 2530 | 1.0 | 0.1 | 230 | 200 | 0 | 1.19 | 250 | 18.4 | 43.0 | -0.8 | 6.6 |
| 112941.94512050.7 | SBS1126+516 | 0.234 | -23.2 | 1880 | 0.6 | 0.3 | 190 | 250 | 60 | 1.17 | 280 | 52.1 | 44.5 | -0.04 | 7.3 |
| 115023.59000839.1 | Q1147+0025 | 0.127 | -21.1 | 1310 | 0.5 | 0.6 | 210 | 150 | 0 | 0.97 | 690 | 16.7 | 43.5 | -0.1 | 6.4 |
| 115235.00000542.8 | Q1150+0010 | 0.129 | -21.6 | 3140 | 0.4 | 0.4 | 280 | 190 | 10 | 1.14 | 330 | 27.1 | 43.7 | -0.7 | 7.3 |
| 115533.50010730.6 | SDSSJ11555+0107 | 0.197 | -21.9 | 1510 | 0.3 | 0.7 | 150 | 780 | 330 | 1.23 | 200 | 17.1 | 43.8 | -0.05 | 6.7 |
| 115758.73002220.8 | QUESTJ1157-0022 | 0.260 | -23.8 | 4670 | 0.6 | 0.3 | 360 | 280 | -10 | 1.20 | 240 | 93.4 | 44.8 | -0.7 | 8.4 |
| 120226.76012915.3 | IRAS11598-0112 | 0.150 | -22.4 | 1460 | 0.5 | 2.7 | 250 | 340 | 170 | 1.31 | 110 | 47.6 | 44.1 | 0.1 | 6.8 |
| 121549.45544224.0 | SBS1213+549A | 0.150 | -22.9 | 1240 | 0.6 | 1.2 | 310 | 320 | 110 | 1.27 | 150 | 73.4 | 44.2 | 0.3 | 6.8 |
| 124324.22010028.1 | SDSSJ12434+0100 | 0.090 | -20.6 | 5180 | 0.4 | 0.2 | 230 | 240 | -10 | 0.94 | 770 | 16.5 | 43.2 | -1.3 | 7.3 |
| 124623.00002839.9 | SDSSJ12463+0028 | 0.088 | -20.6 | 2230 | 0.9 | 0.3 | 220 | 210 | 40 | 1.14 | 330 | 17.6 | 43.2 | -0.6 | 6.6 |
| 124635.25022208.8 | PG1244+026 | 0.048 | -20.5 | 1200 | 0.6 | 0.8 | 230 | 300 | 150 | 1.10 | 400 | 82.0 | 43.3 | -0.03 | 6.2 |
| 130023.22005429.8 | UM534 | 0.122 | -21.3 | 1240 | 0.7 | 0.6 | 250 | 150 | 70 | 1.09 | 410 | 20.9 | 43.5 | 0.01 | 6.3 |
| 130713.25003601.6 | SDSSJ13072-0036 | 0.170 | -22.5 | 2240 | 0.9 | 0.3 | 370 | 310 | -30 | 1.01 | 580 | 40.6 | 44.1 | -0.3 | 7.2 |
| 131750.32601041.0 | SBS1315+604 | 0.137 | -22.1 | 2660 | 1.5 | 0.1 | 380 | 340 | 20 | 1.20 | 240 | 31.3 | 43.8 | -0.6 | 7.2 |
| 132135.33001305.8 | SDSSJ13215-0013 | 0.082 | -21.2 | 3300 | 1.0 | 0.3 | 240 | 300 | 130 | 1.11 | 380 | 38.5 | 43.5 | -0.9 | 7.1 |
| 134351.07000434.8 | SDSSJ13438+0004 | 0.074 | -20.7 | 1960 | 0.7 | 0.4 | 200 | 190 | 10 | 0.99 | 630 | 29.2 | 43.2 | -0.4 | 6.5 |
| 134459.45001559.5 | Q1342-000 | 0.245 | -23.0 | 2450 | 1.0 | 0.2 | 410 | 240 | -30 | 1.26 | 160 | 41.7 | 44.4 | -0.3 | 7.5 |
| 135516.55561244.7 | SBS1353+564 | 0.122 | -22.4 | 1340 | 1.6 | 0.7 | 490 | 440 | 50 | 0.94 | 770 | 60.2 | 44.0 | 0.1 | 6.7 |
| 143030.22001115.1 | SDSSJ14305-0011 | 0.103 | -20.1 | 1510 | 1.3 | 0.5 | 170 | 160 | 30 | 1.23 | 200 | 8.4 | 43.0 | -0.3 | 6.2 |
| 143039.31493539.0 | CSO661 | 0.204 | -22.7 | 2480 | 0.3 | 0.5 | 260 | 230 | 30 | 1.19 | 250 | 38.9 | 44.2 | -0.4 | 7.4 |
| 143847.54000805.4 | SDSSJ14387-0008 | 0.104 | -20.9 | 3570 | 0.2 | 0.4 | 200 | 210 | -20 | 1.01 | 580 | 15.1 | 43.2 | -1.0 | 7.1 |
| 144130.11592801.7 | RXJ14414+5928 | 0.134 | -21.2 | 1600 | 0.3 | 0.8 | 180 | 250 | 30 | 1.36 | 60 | 16.8 | 43.5 | -0.2 | 6.6 |
| 144735.26003230.5 | SDSSJ14475-0032 | 0.217 | -21.6 | 1470 | 0.3 | 0.6 | 140 | 140 | 30 | 1.20 | 240 | 12.1 | 43.8 | -0.1 | 6.7 |
| 144932.71002236.3 | SDSSJ14495+0022 | 0.081 | -20.5 | 1240 | 0.7 | 0.8 | 230 | 140 | 40 | 1.30 | 120 | 18.0 | 43.1 | -0.1 | 6.1 |
| 145123.02000625.9 | SDSSJ14513-0006 | 0.139 | -21.1 | 2610 | 0.8 | 0.1 | 200 | 280 | -10 | 1.23 | 200 | 12.3 | 43.4 | -0.7 | 6.9 |
| 145143.30524127.4 | RXJ14517+5241 | 0.206 | -22.0 | 1970 | 0.5 | 0.2 | 220 | 290 | 60 | 1.04 | 510 | 18.3 | 43.9 | -0.3 | 7.0 |
| 145631.65001114.2 | SDSSJ14565-0011 | 0.132 | -21.8 | 6220 | 0.5 | 0.1 | 220 | 230 | -20 | 0.87 | 1030 | 25.3 | 43.7 | -1.3 | 7.8 |
| 151956.57001614.6 | SDSSJ15199+0016 | 0.114 | -21.5 | 1730 | 0.4 | 0.4 | 320 | 340 | 90 | 1.07 | 450 | 26.3 | 43.6 | -0.3 | 6.7 |
| 152628.20003809.4 | SDSSJ15264-0038 | 0.123 | -21.5 | 2240 | 0.3 | 0.8 | 120 | 170 | 20 | 1.25 | 180 | 27.4 | 43.6 | -0.5 | 6.9 |
| 153732.62494247.8 | SBS1536+498 | 0.280 | -22.2 | 1290 | 0.5 | 1.0 | 120 | 140 | 30 | 1.29 | 130 | 21.6 | 44.2 | 0.2 | 6.9 |
| 153911.17002600.8 | SDSSJ15391+0026 | 0.265 | -22.6 | 1450 | 0.7 | 0.4 | 220 | 380 | 110 | 1.25 | 180 | 28.2 | 44.3 | 0.1 | 7.0 |
| 155922.19270338.9 | 2E1557+2712 | 0.064 | -20.7 | 2500 | 0.5 | 0.3 | 250 | 200 | -10 | 1.23 | 200 | 35.7 | 43.2 | -0.7 | 6.7 |
| 161809.38361957.8 | RXJ16181+3619 | 0.034 | -19.1 | 1150 | 0.6 | 0.9 | 120 | 130 | 20 | 1.43 | 10 | 35.0 | 42.7 | -0.2 | 5.7 |
| 161951.31405847.2 | KUG1618+410 | 0.038 | -19.2 | 1750 | 1.1 | 0.2 | 280 | 210 | 20 | 1.16 | 300 | 28.5 | 42.7 | -0.6 | 6.1 |
| 163323.58471859.0 | RXJ16333+4718 | 0.116 | -21.7 | 1260 | 1.2 | 0.9 | 340 | 250 | 40 | 1.17 | 280 | 38.0 | 43.7 | 0.1 | 6.5 |
| 164907.64642422.3 | SDSSJ16491+6424 | 0.184 | -21.1 | 1360 | 0.5 | 0.8 | 160 | 320 | 10 | 1.41 | 20 | 9.4 | 43.5 | -0.1 | 6.4 |
| 165408.16392533.4 | EXO1652.4+3930 | 0.069 | -20.4 | 1280 | 0.2 | 0.6 | 250 | 120 | 50 | 1.11 | 380 | 25.1 | 43.1 | -0.2 | 6.1 |
| 165658.38630051.1 | SDSSJ16569+6300 | 0.169 | -21.1 | 1720 | 0.2 | 0.7 | 160 | 210 | 20 | 1.15 | 310 | 10.8 | 43.5 | -0.3 | 6.6 |
| 170328.97614110.0 | SDSSJ17034+6141 | 0.077 | -21.5 | 4000 | 0.6 | 0.2 | 260 | 430 | 60 | 1.16 | 300 | 55.1 | 43.6 | -1.0 | 7.4 |
| 170546.91631059.1 | SDSSJ17057+6310 | 0.119 | -20.9 | 1930 | 0.2 | 0.7 | 250 | 230 | 80 | 1.37 | 50 | 14.9 | 43.4 | -0.4 | 6.6 |
| 170812.29601512.6 | SDSSJ17082+6015 | 0.145 | -21.0 | 1070 | 1.0 | 0.5 | 280 | 260 | 60 | 1.25 | 180 | 10.8 | 43.4 | 0.1 | 6.1 |
| 171411.63575834.1 | SBS1713+580 | 0.093 | -22.2 | 2130 | 0.4 | 0.7 | 360 | 300 | 6 | 1.13 | 340 | 88.7 | 43.9 | -0.3 | 7.1 |
| 171550.49593548.8 | SDSSJ17158+5935 | 0.066 | -20.0 | 3240 | 0.7 | 0.2 | 340 | 270 | 40 | 1.14 | 330 | 15.8 | 42.9 | -1.0 | 6.7 |
| 171829.01573422.4 | SDSSJ17184+5734 | 0.101 | -21.3 | 1760 | 0.4 | 0.7 | 110 | 470 | 150 | 1.40 | 30 | 26.9 | 43.5 | -0.3 | 6.6 |
| 172032.29551330.3 | SDSSJ17205+5513 | 0.273 | -22.7 | 3490 | 0.6 | 0.2 | 250 | 250 | -10 | 1.20 | 240 | 33.7 | 44.4 | -0.6 | 7.8 |
| 172533.07571645.6 | SDSSJ17255+5716 | 0.066 | -20.5 | 4870 | 1.4 | 0.04 | 280 | 210 | 20 | 1.26 | 160 | 23.1 | 43.0 | -1.3 | 7.2 |
| 173107.87620026.1 | SDSSJ17311+6200 | 0.069 | -20.8 | 3860 | 1.1 | 0.4 | 350 | 310 | 20 | 1.07 | 450 | 30.5 | 43.2 | -1.1 | 7.1 |
| 221918.53120753.2 | IIZw177 | 0.081 | -21.3 | 1180 | 0.5 | 1.2 | 170 | 200 | 40 | 1.29 | 130 | 46.6 | 43.5 | 0.1 | 6.3 |
| 232328.00002032.9 | SDSSJ23234+0020 | 0.120 | -21.2 | 3890 | 0.5 | 0.3 | 410 | 300 | 10 | 1.11 | 380 | 18.4 | 43.5 | -1.0 | 7.3 |
| 233032.95000026.4 | SDSSJ23305+0000 | 0.123 | -21.3 | 1220 | 0.7 | 0.8 | 410 | 280 | 80 | 1.15 | 310 | 18.5 | 43.5 | 0.01 | 6.3 |
| 234725.30010643.7 | SDSSJ23474-0106 | 0.182 | -21.8 | 1830 | 0.3 | 0.4 | 320 | 180 | 40 | 1.21 | 230 | 18.2 | 43.8 | -0.2 | 6.9 |
| Prop. | class | range | average |
|---|---|---|---|
| NLS1 | [5.7,7.3] | 6.5 | |
| BLS1 | [6.5,8.4] | 7.2 | |
| NLS1 | [-0.6,0.3] | -0.1 | |
| BLS1 | [-1.4,-0.3] | -0.8 | |
| FWHM() | NLS1 | [110,490] | 230 |
| BLS1 | [120,570] | 300 | |
| FWHM() | NLS1 | [110,780] | 280 |
| NLS1aaExcluding galaxies with high velocity shifts (i.e., km s-1). | [110,440] | 210 | |
| BLS1 | [140,470] | 270 | |
| BLS1aaExcluding galaxies with high velocity shifts (i.e., km s-1). | [140,470] | 270 | |
| R4570 | NLS1 | [0.1,2.7] | 0.7 |
| BLS1 | [0.0,1.0] | 0.3 | |
| R5007 | NLS1 | [0.2,1.6] | 0.6 |
| BLS1 | [0.2,1.8] | 0.7 | |
| NLS1 | [-30,430] | 80 | |
| BLS1 | [-60,130] | 10 | |
| R[SII] | NLS1 | [0.94,1.43] | 1.22 |
| BLS1 | [0.87,1.47] | 1.13 | |
| NLS1 | [10,770]bbTwo objects, RXJ16181+3619 and SDSSJ01148-0029, have 10 cm-3, and were not included in the analysis involving . | 200 | |
| BLS1 | [150,1030] | 340 |
| Prop. | FWHM | R5007 | R4570 | FWHM[SII] | FWHM | R[SII] | |||||
|---|---|---|---|---|---|---|---|---|---|---|---|
| (1) | (2) | (3) | (4) | (5) | (6) | (7) | (8) | (9) | (10) | (11) | |
| (1) FWHM | all | 0.09 | -0.70 | 0.38 | 0.15 | -0.52 | -0.43 | 0.46 | 0.04 | -0.91 | 0.79 |
| NLS1s | -0.10 | -0.45 | 0.02 | 0.12 | -0.15 | -0.11 | 0.11 | 0.22 | -0.67 | 0.59 | |
| BLS1s | 0.14 | -0.50 | 0.15 | 0.24 | -0.07 | -0.37 | 0.38 | -0.13 | -0.85 | 0.51 | |
| (2) R5007 | 0.09 | all | -0.38 | 0.29 | 0.10 | -0.04 | -0.07 | 0.07 | -0.10 | -0.14 | 0.01 |
| -0.10 | NLS1s | -0.35 | 0.30 | 0.04 | -0.08 | -0.09 | 0.09 | -0.16 | 0.01 | -0.20 | |
| 0.14 | BLS1s | -0.47 | 0.25 | 0.13 | 0.22 | 0.09 | -0.10 | -0.03 | -0.15 | 0.02 | |
| (3) R4570 | -0.70 | -0.38 | all | -0.38 | -0.02 | 0.50 | 0.46 | -0.47 | 0.16 | 0.71 | -0.47 |
| -0.45 | -0.35 | NLS1s | -0.13 | 0.15 | 0.18 | 0.38 | -0.38 | 0.23 | 0.53 | 0.01 | |
| -0.50 | -0.47 | BLS1s | -0.23 | -0.21 | 0.20 | 0.17 | -0.12 | 0.09 | 0.41 | -0.27 | |
| (4) FWHM[SII] | 0.38 | 0.29 | -0.38 | all | 0.41 | -0.25 | -0.41 | 0.41 | 0.12 | -0.32 | 0.37 |
| 0.02 | 0.30 | -0.13 | NLS1s | 0.28 | -0.01 | -0.39 | 0.40 | -0.03 | 0.01 | -0.05 | |
| 0.15 | 0.25 | -0.23 | BLS1s | 0.67 | -0.03 | -0.12 | 0.06 | 0.41 | 0.05 | 0.45 | |
| (5) FWHM | 0.15 | 0.10 | -0.02 | 0.41 | all | 0.31 | -0.03 | 0.01 | 0.29 | -0.01 | 0.27 |
| 0.12 | 0.04 | 0.15 | 0.28 | NLS1s | 0.61 | 0.15 | -0.15 | 0.37 | 0.17 | 0.34 | |
| 0.24 | 0.13 | -0.21 | 0.67 | BLS1s | 0.17 | -0.22 | 0.18 | 0.20 | -0.13 | 0.27 | |
| (6) | -0.52 | -0.04 | 0.50 | -0.25 | 0.31 | all | 0.24 | -0.27 | 0.09 | 0.56 | -0.34 |
| -0.15 | -0.08 | 0.18 | -0.01 | 0.61 | NLS1s | 0.14 | -0.14 | 0.24 | 0.34 | 0.16 | |
| -0.07 | 0.22 | 0.20 | -0.03 | 0.17 | BLS1s | 0.04 | -0.06 | -0.07 | 0.04 | -0.16 | |
| (7) R[SII] | -0.43 | -0.07 | 0.46 | -0.41 | -0.03 | 0.24 | all | -1.00 | 0.03 | 0.38 | -0.35 |
| -0.11 | -0.09 | 0.38 | -0.39 | 0.15 | 0.14 | NLS1s | -1.00 | -0.01 | 0.00 | -0.02 | |
| -0.37 | 0.09 | 0.17 | -0.12 | -0.22 | 0.04 | BLS1s | -1.00 | 0.13 | 0.38 | -0.17 | |
| (8) | 0.46 | 0.07 | -0.47 | 0.41 | 0.01 | -0.27 | -1.00 | all | -0.06 | -0.42 | 0.34 |
| 0.11 | 0.09 | -0.38 | 0.40 | -0.15 | -0.14 | -1.00 | NLS1s | 0.01 | -0.003 | 0.02 | |
| 0.38 | -0.10 | -0.12 | 0.06 | 0.18 | -0.06 | -1.00 | BLS1s | -0.23 | -0.45 | 0.10 | |
| (9) L5100 | 0.04 | -0.10 | 0.16 | 0.12 | 0.29 | 0.09 | 0.03 | -0.06 | all | 0.34 | 0.59 |
| 0.22 | -0.16 | 0.23 | -0.03 | 0.37 | 0.24 | -0.01 | 0.01 | NLS1s | 0.54 | 0.90 | |
| -0.13 | -0.03 | 0.09 | 0.41 | 0.20 | -0.07 | 0.13 | -0.23 | BLS1s | 0.57 | 0.74 | |
| (10) | -0.91 | -0.14 | 0.71 | -0.32 | -0.01 | 0.56 | 0.38 | -0.42 | 0.34 | all | -0.50 |
| -0.67 | 0.01 | 0.53 | 0.01 | 0.17 | 0.34 | 0.00 | -0.003 | 0.54 | NLS1s | 0.15 | |
| -0.85 | -0.15 | 0.41 | 0.05 | -0.13 | 0.04 | 0.38 | -0.45 | 0.57 | BLS1s | -0.06 | |
| (11) | 0.79 | 0.01 | -0.47 | 0.37 | 0.27 | -0.34 | -0.35 | 0.34 | 0.59 | -0.50 | all |
| 0.59 | -0.20 | 0.01 | -0.05 | 0.34 | 0.16 | -0.02 | 0.02 | 0.90 | 0.15 | NLS1s | |
| 0.51 | 0.02 | -0.27 | 0.45 | 0.27 | -0.16 | -0.17 | 0.10 | 0.74 | -0.06 | BLS1s |
| EV1 | EV2 | EV3 | EV4 | EV5 | EV6 | EV7 | |
|---|---|---|---|---|---|---|---|
| Eigenvalue | 2.6592 | 1.2295 | 1.0299 | 0.6432 | 0.6050 | 0.4366 | 0.3966 |
| Percentage variance | 37.99 | 17.56 | 14.71 | 9.19 | 8.64 | 6.24 | 5.67 |
| Cumulative | 37.99 | 55.55 | 70.26 | 79.45 | 88.09 | 94.33 | 100.00 |
| -0.103 | -0.885 | 0.183 | -0.134 | -0.295 | 0.259 | -0.020 | |
| FWHM | 0.758 | -0.015 | -0.212 | -0.216 | 0.403 | 0.367 | 0.189 |
| R5007 | 0.441 | 0.004 | 0.841 | 0.038 | 0.059 | -0.132 | 0.276 |
| R4570 | -0.759 | 0.331 | -0.062 | 0.173 | -0.229 | 0.277 | 0.390 |
| FWHM[SII] | 0.667 | 0.451 | 0.238 | 0.175 | -0.304 | 0.308 | -0.278 |
| -0.606 | 0.347 | 0.298 | -0.634 | 0.025 | 0.080 | -0.122 | |
| R[SII] | -0.700 | -0.113 | 0.309 | 0.339 | 0.454 | 0.200 | -0.200 |
| EV1 | EV2 | |
|---|---|---|
| 0.71 | 0.05 | |
| -0.01 | 0.86 | |
| 0.60 | 0.48 | |
| -0.71 | 0.36 |