Preisach images of a simple mechanical system
Abstract
This work is an an early stage of a larger project aiming at answering the question whether or not the Preisach map is really fingerprinting magnetic materials. More precisely, we are interested whether Preisach model of magnetic hysteresis indeed contains any physics or is just a convenient modeling tool. To this extent we study a very simple mechanical system, thus fully tractable, subjected to the external force. Despite of its simplicity, our model captures all the fundamental features of real magnetic materials, namely their hysteretic behavior, coercivity, remanent magnetization and saturation at high fields. Both the overall shape of major hysteresis loop as well as First Order Reversal Curves (FORC’s) are reproduced quite correctly; they are very similar to those observed in magnetic materials. The model essentially consists of a single, spring loaded, rigid and rotative bar with non-zero friction torque. The length of a projection of this bar onto the direction of an external force is identified with magnetization. The friction torque and the spring constant are the only freely adjustable parameters of our model. Here we investigate, and present, their influence on the inferred Preisach maps.
pacs:
07.05.Tp, 45.20.da, 75.60.EjI Motivation
It took more than ten years to put into experimental practice Pike the idea of the so called FORC’s (First Order Reversal Curves) first introduced by Mayergoyz IM in 1986. Since then the FORC diagrams became more or less standard method of analysis of magnetic materials exhibiting hysteretic behavior. The FORC diagrams are nearly identical with Preisach Preis maps, except for the boundary part (necessarily equal to exactly zero in FORC picture), corresponding to the so called reversible part of magnetization curve. For this reason we will be using both terms as if they were equivalent.
In the beginning, the shape of Preisach map was essentially guessed. According to some theoretical hints given by Néel (1949–1952), such a map should consist of a single peak. The parameters of this peak, assumed most often as being Gaussian, Lorentzian or lognormal, were later refined in such a way as to reproduce the experimental data. The FORC technique, in contrast, does not assume any particular shape of a Preisach map and therefore reproduces empirical facts more accurately. It is really good news for engineers, but physicists rather would be interested what is the meaning of various details observed in result of FORC-type analysis. More specifically, it is very important to be able to draw some definite conclusions concerning various magnetic interactions dominating in a given material.
The published data with recovered FORC diagrams are quite ubiquitous but lack systematic attitude. The experimental data are sometimes accidental (rock samples), or only a very limited set of samples is available. In addition, the experiment itself is rather time-consuming. On the other hand, simulated data are easy to generate and, what is even more important, the analyst ‘knows everything’ about her artificial ‘sample’ in advance. Manipulating various parameters is straightforward and practically unrestricted.
In this situation, it seems natural to develop systematic studies in that matter, starting from the simplest models and making them more realistic (and more complex) later. Here we present our first attempt in this direction.
II The model
In our model (see Fig. 1) a stiff rod can be rotated around the axis located at (0,0). The rod is connected with the rotation axis by means of a spring.

An external force is applied either parallel or antiparallel to the -axis, so the rod’s deflection from vertical direction may never exceed . A static friction between the rod and its rotation axis is present. No movement is possible whenever the torque produced by spring and the external force has lower magnitude than the static friction torque, i.e. when
| (1) |
where the spring torque , with the dimensionless parameter being called spring constant from now on, and the external force produced torque is , where is the length of a rod, and, finally, is the static friction torque.
When the relation (1) is not satisfied, the rod rotates in the direction dictated by the sign of until the equilibrium condition
| (2) |
is reached.
In our mechanical model of magnetic hysteresis the external force is identified with the exciting field , and the projection of a rod onto the direction of external field, equal to , corresponds to (reduced) magnetization, since .
III The results
We present three selected hysteresis curves in Fig. 2. The shape of FORCs, perfectly horizontal, may be a little surprising at first sight, since our FORCs differ significantly from the majority of published data.

Yet, contrary to intuition, our simulations are not completely unrealistic. One might expect horizontal reversal curves only for very hard magnetic materials, but the curves similar to ours have been recently observed for arrays of Ni microwires Ni-wires electrodeposited in nanoporous alumina templates. The overall shape of our recovered FORC diagrams is roughly the same for sensible combinations of adjustable parameters. Three examples are shown in Fig. 3.


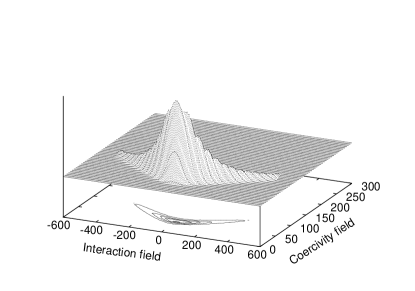
It is worth noticing that the peak is not a convex body – note the presence of ‘arms’ and ‘folded ellipses’ as contour lines. This fact alone invalidates some quasi one-dimensional, simplified models of the Preisach maps. It is also in sharp contrast with other analytical model of magnetic hysteresis, proposed by Takács Takacs and shown in Fig. 4. The results of more quantitative analysis are shown in following figures.

The position of the highest point on a map, more precisely its coercivity field coordinate, is strictly proportional to the friction but is insensitive to the spring stiffness (Fig. 5). The error bars there are taken as the field values nearest to the crossing of major hysteresis loop and axis.
The peak’s amplitude, on the other hand, is a decreasing function of both parameters. It seems inversely proportional to the spring constant (see Fig. 6).

The dependence on friction is less clear, due to inaccuracies generated by imperfect smoothing procedure, resulting in a slightly warped peak shape, as one can see in Fig. 3. Nevertheless, it is quite likely that the peak’s height is inversely proportional to the friction as well.
IV Conclusions
Our results show that various approximations of the peak shape, existing in literature, are probably too simplistic or even incorrect.
We occasionally observe small negative regions on obtained Preisach maps, especially at their edges, near coercivity coordinate equal to zero (see the top of Fig. 3). We are strongly convinced that it is an artifact, due to the numerical differentiation and/or smoothing procedure, rather than the real thing.

Negative regions are often observed both in real and simulated Robb magnetic systems. This feature is most likely related to the multimodal character of a potential energy landscape in real systems (pinning sites, defects, domain structure), while in our model the potential energy is unimodal.
Acknowledgments
This work was partially supported by the European Union within the European Regional Development Fund, through the Innovative Economy grant (POIG).
References
- (1) Christopher R. Pike, Andrew P. Roberts, Kenneth L. Verosub, J. Appl. Phys. 85, 6660–6667 (1999)
- (2) I.D. Mayergoyz, Phys. Rev. Lett. 56, 1518–1521 (1986)
- (3) F. Preisach, Z. Phys., 97, 277–302 (1935)
- (4) S. Da Col, M. Darques, O. Fruchart, and L. Cagnon, arxiv/1101.1753v2 (17 Feb. 2011)
- (5) J. Takács, COMPEL: The International Journal for Computation and Mathematics in Electrical and Electronic Engineering, 20, (2001) 1002–1014 (2001)
- (6) D.T. Robb, M.A. Novotny, P.A. Rikvold, J. Appl. Phys. 97, 10E510 (2005)