Evidence for extended gamma-ray emission from galaxy clusters
Abstract
We report evidence for extended gamma-ray emission from the Virgo, Fornax and Coma clusters based on a maximum-likelihood analysis of the 3-year Fermi-LAT data. For all three clusters, excess emission is observed within three degrees of the center, peaking at the GeV scale. This emission cannot be accounted for by known Fermi sources or by the galactic and extragalactic backgrounds. If interpreted as annihilation emission from supersymmetric dark matter (DM) particles, the data prefer models with a particle mass in the range GeV annihilating into the channel, or GeV and TeV annihilating into final states. Our results are consistent with those obtained by Hooper and Linden from a recent analysis of Fermi-LAT data in the region of the Galactic Centre. An extended DM annihilation profile dominated by emission from substructures is preferred over a simple point source model. The significance of DM detection is in Virgo and lower in the other two clusters. We also consider the possibility that the excess emission arises from cosmic ray (CR) induced gamma-rays, and infer a CR level within a factor of three of that expected from analytical models. However, the significance of a CR component is lower than the significance of a DM component, and there is no need for such a CR component in the presence of a DM component in the preferred DM mass range. We also set flux and cross-section upper limits for DM annihilation into the and channels in all three clusters.
1 Introduction
The existence of dark matter (DM) in the universe has so far only been deduced and constrained from its gravitational effect, due to the lack of electromagnetic interactions of the DM with itself or with baryonic matter. There are several elementary particle candidates for DM in various extension of the standard model of particle physics. Weakly interacting massive particles (WIMPs) are one of the most promising classes of dark matter candidates, with a self-interaction cross-section estimated at around under simplified assumptions. These particles arise naturally in theories that seek to extend the standard model and, at the same time, produce the correct relic density of dark matter in the early universe. Within the framework of the minimal supersymmetric standard model (MSSM), the lightest neutralino emerges as the prototype of a WIMP that is stable over cosmological timescales and can annihilate into standard model particles. These particles are generally known as cold dark matter.
Much effort has been devoted to the search for dark matter, either directly or indirectly. Direct detection involves identifying the rare events of DM scattering off ordinary matter or searching for new particles near the weak scale at the LHC. Indirect detection involves looking for the annihilation or decay products of dark matter in cosmic rays and gamma rays. In particular, pair annihilation produces gamma-ray photons at a rate proportional to the square of the dark matter density, which then propagate, almost without absorption, to the observer. In this case, the Galactic Center should be the brightest gamma-ray source on the sky (Springel et al., 2008, and references therein). There have been recent claims of extended emission (besides a central point source) in the Galactic Center (Hooper & Linden, 2011; Hooper & Goodenough, 2011; Chernyakova et al., 2011; Boyarsky et al., 2010), which is consistent with either DM annihilation from a halo with a slightly cuspier density profile (an inner slope of to ) than the typical NFW cold dark matter galactic halo (Navarro et al., 1996, 1997), or with proton collisions accelerated by the central galactic black hole. The latter process is very poorly understood so a definitive conclusion is not yet possible.
Targetting the entire sky rather than the Galactic center in searching for annihilation radiation may seem a good strategy since it takes advantage of the large-scale distribution of dark matter while avoiding some of the uncertainties arising from the astrophysical modelling of galactic gamma-ray sources. However, the fact that we are located near the center of the Galactic halo and that most of the annihilation emission outside the Galactic Center is produced by dark matter substructures (Springel et al., 2008; Diemand et al., 2007) results in a gamma-ray map from annihilation that is almost uniform on large scales. This makes detection within the Milky Way halo a difficult task, exacerbated by the additional uncertainty in having to model the extragalactic background, which is more important on large scales (Zaharijas et al., 2010; Baxter & Dodelson, 2011).
Dwarf galaxies are the most DM-dominated objects known, are relatively free from astrophysical contamination and appear compact on the sky. They are therefore promising targets for DM annihilation detection. Recent joint analyses of eight to ten dwarf galaxies (Geringer-Sameth & Koushiappas, 2011; The Fermi-LAT Collaboration: M. Ackermann et al., 2011) resulted in a null detection but have began to rule out the canonical annihilation cross-section of for DM masses below GeV.
Galaxy clusters are the most massive virialized DM structures in the universe and are also good targets for indirect DM searches. The presence of a large population of DM substructures (or subhalos) predicted by numerical simulations further boosts the detectability of DM in clusters. Although the total mass within subhalos amounts to only 10 to 20 percent of the total halo mass, the density enhancement within subhalos can boost the total cluster annihilation luminosity by a factor as high as 1000 when extrapolated down to a subhalo mass limit of one Earth mass as expected, for example, for a GeV WIMP (Gao et al., 2011; Pinzke et al., 2011). As the distribution of subhalos is much less concentrated than that of the smooth main halo, the total annihilation emission from clusters is predicted to be extended. Thus, attempts to detect DM annihilation assuming a point source or NFW-squared type profile could miss most of the signal. In fact, just such a search using the 11-month Fermi-LAT data has yielded a null detection in six clusters (Ackermann et al., 2010)
In this work, we use the 3-year Fermi-LAT data to search for extended emission from clusters. We consider possible contributions from cosmic ray (CR) induced gamma-ray emission, which can be as high as, or higher than, that from cluster DM annihilation (Jeltema et al., 2009; Pinzke & Pfrommer, 2010; Pinzke et al., 2011). We adopt the model proposed by Gao et al. (2011) for the cluster annihilation profile and the semi-analytic method developed by Pinzke & Pfrommer (2010) to model CR induced gamma-ray emission and provide constraints on both the DM and CR components. We focus on three galaxy clusters: Coma, which is predicted to have the highest signal-to-noise according to Gao et al. (2011), and Fornax and Virgo which are predicted to have the lowest astrophysical contamination (Pinzke et al., 2011).
During the final stages of preparation of this work, a paper (Huang et al., 2011) was posted on arxiv presenting a null detection of DM annihilation emission from a combined analysis of eight galaxy clusters. Our work differs from this interesting paper in several respects: firstly, we assume a DM annihilation profile based on high resolution cosmological simulations (Gao et al., 2011); secondly, we assess the impact of cosmic rays in the detection of dark matter; and finally, we include the Virgo cluster in our sample which turns out to be the best candidate. The constraints we set on the annihilation cross-section are consistent with those in Huang et al. (2011).
The cosmological parameters used in this work are the same as those assumed by Gao et al. (2011): ,,.
2 Modeling gamma-ray emission in clusters
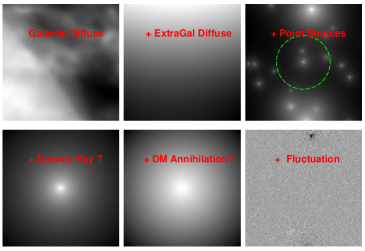
We model the observed gamma-ray emission in clusters with several components as shown in Figure 1: the galactic foreground (GAL), the extragalactic background (EG), emission from known point sources, DM annihilation and CR-induced emission. The GAL and EG diffuse emission are given by the most recent templates, gal_2yearp7v6_v0.fits and iso_p7v6source.txt, which can be obtained from the Fermi-LAT data server, while the point sources are taken from the LAT 2-year point source catalogue (2FGL,The Fermi-LAT Collaboration (2011)). We now describe in detail our models for DM annihilation and CR emission.
2.1 Cluster annihilation emission
The gamma-ray intensity along the line-of-sight due to DM annihilation is given by:
| (1) |
where is the DM particle mass, the particle model dependent term giving the differential number of photons produced from each annihilation event as a function of energy, , in a particular annihilation channel, , and is the cross-section (or annihilation rate) for that channel, which is predicted to be constant for cold dark matter. The line-of-sight integration of the density squared is often expressed in terms of a dimensionless factor,
| (2) |
If the source size is much smaller than the instrumental beam size, a point source approximation is applicable. In this case, the integration of over a large enough solid angle is used to determine the total flux for the point source, .
The cluster annihilation emission is modeled with both a point source approximation and with the extended profile suggested by Gao et al. (2011). We will refer to models using these two profiles respectively as PT and EXT. If the cluster follows a smooth NFW profile, then its integrated factor which determines the total annihilation flux can be found as
| (3) |
Here is the angular diameter distance of the cluster and and are the characteristic density and radius for the NFW profile. They are related to halo concentration and virial radius through the relations, and , with the critical density of the universe, the cluster virial radius within which the average density is and the concentration parameter, , given by the following mass-concentration relation:
| (4) |
(Duffy et al., 2008). Extrapolating to a cutoff mass of , the existence of subhalos will boost this flux by a factor
| (5) |
Gao et al. (2011). Using the results of the simulations by these authors, the surface brightness profile of subhalo emission can be fitted within by the following formula:
| (6) |
Below we fit the subhalo emission surface brightness beyond the virial radius and extrapolate to several times the virial radius using an exponential decay,
| (7) |
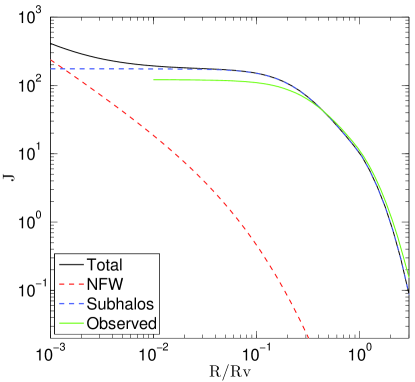
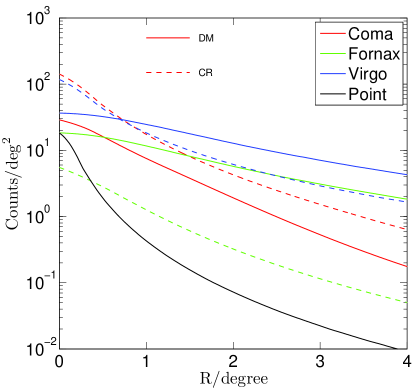
The total annihilation profile is the sum of the contributions from a smooth NFW profile and the subhalo emission. This is completely dominated by subhalo emission except in the very center of the cluster. We show the total annihilation profile and its decomposition into main halo and subhalo contributions in the left panel of Figure 3, taking Virgo as an example. This profile is further inflated after convolution with the LAT point spread function.
Following Ackermann et al. (2010), we consider two representative annihilation channels, namely into and final states. The annihilation spectrum is calculated using the DarkSUSY package (Gondolo & Silk, 1999),111http://www.darksusy.org. which tabulates simulation results from PYTHIA.222http://home.thep.lu.se/ torbjorn/Pythia.html We also include the contribution from inverse Compton (IC) scattered photons by energetic electron-positron pairs produced during the annihilation process, following the procedure described in Pinzke et al. (2011). In general three external energy sources are involved in the dissipation and scattering of the injected electrons from annihilation: the Cosmic Microwave Background (CMB), infrared to UV light from stars and dust, and the interstellar magnetic field. However, as shown in Pinzke et al. (2011), the latter two components are expected to be important only in the inner region of clusters (), corresponding to less than 0.1 degrees for our three clusters. Including them would introduce a position-dependent component to the annihilation spectrum, so for simplicity we only consider the contribution of CMB photons in the IC calculation. For the channel, IC photons only contribute significantly to the low energy spectrum for relatively high neutralino mass, while for the channel, which has plenty of energetic electrons, the IC emission can completely dominate the annihilation emission over the full energy range of interest for the highest neutralino masses considered.
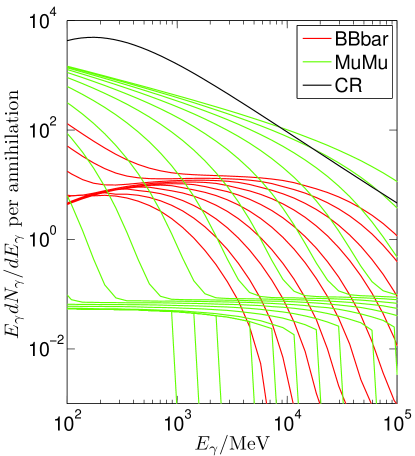
We note that the electroweak corrections recently proposed by Ciafaloni et al. (2011) (see also Cirelli et al. (2011)) can bring visible differences to the channel spectrum at high WIMP masses before IC scattering. However, since IC photons dominate at the high mass end and the electroweak correction only significantly changes the positron yields at low energy, thus having little effect on the IC spectrum, the electroweak correction to the total spectrum is still negligible. The total photon yields are shown in Figure 2. The almost flat spectrum with a cutoff around the energy corresponding to the WIMP mass comes from prompt annihilation emission including continuum secondary photons and final state radiation from charged final state particles. The low energy rise originates from IC scattered CMB photons.
2.2 Cosmic-ray induced gamma-ray emission within clusters
The cosmic ray induced gamma-ray emission is calculated following a semi-analytic prescription, derived from high resolution numerical simulations of galaxy clusters, that models cosmic ray physics self consistently (Pinzke & Pfrommer, 2010). The gamma-ray photon production rate (or source function) from pion decay is found to be separable into a spatial and a spectral part:
| (8) |
where the spatial part, , is proportional to the square of the gas density profile multiplied by a slowly varying radial function parametrized by cluster mass. The spectral part, , is almost independent of cluster mass and has a power-law form, , for the energy range GeV but flattens at low energies, as shown in Figure 2. We summarize the detailed form of and plus the gas density profile for the three clusters derived from X-ray observations in the Appendix.
The differential gamma-ray flux from this source function is simply its integral along the line-of-sight:
| (9) |
This prescription is derived from the average emission profile for a sample of simulated clusters for a realistic choice of parameter values (e.g., for the maximum shock acceleration efficiency, ). In addition to the uncertainties in the model parameters there is also uncertainty in the observationally derived halo mass and gas density profile. In this work, we simply assume that the shape of is given by the model described above and account for the uncertainty in the model parameters as well as sample variance with an additional normalization parameter, , so that
| (10) |
We take as our fiducial CR model and also consider the case when is fitted from the actual gamma-ray data as an optimal model. In the right panel of Figure 3 we compare the CR profile for the fiducial model to the expected DM annihilation profile within our three clusters, assuming a fiducial DM particle model with particle mass annihilating through the channel with cross-section, . In general the CR emission is more centrally concentrated than the annihilation profile since the CR traces the gas profile. It can be readily seen that Fornax has a particularly low CR level while Coma is CR dominated. Coma has steeper profiles due to its larger distance and hence smaller angular size.
3 Data analysis
3.1 Data preparation
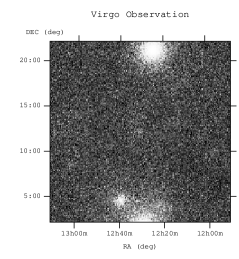
We analyze the first 3 years of data (04/08/2008 to 16/08/2011) from the Fermi-LAT, 333http://fermi.gsfc.nasa.gov/cgi-bin/ssc/LAT/LATDataQuery.cgi trimmed with the cuts listed below, to select high quality photon events. This typically results in photons within a radius of 10 degrees around each cluster, while the expected number of annihilation photons is of the order of according to Figure 3. The most recent instrument response function, P7SOURCE_V6, is adopted for the analysis, in accordance with our event class selection.
| Minimum Energy | 100 MeV |
| Maximum Energy | 100 GeV |
| Maximum zenith angle444ZENITH ANGLE (degrees): angle between the reconstructed event direction and the zenith line (originates at the center of the Earth and passes through the center of mass of the spacecraft, pointing outward). The Earth’s limb lies at a zenith angle of 113 degrees. | 100 degrees |
| Event Class555EVENT CLASS: flag indicating the probability of the event being a photon and the quality of the event reconstruction. | 2 (P7SOURCE) |
| DATA-QUAL666DATA-QUAL: flag indicating the quality of the LAT data, where 1 = OK, 2 = waiting review, 3 = good with bad parts, 0 = bad | 1 |
| LAT CONFIG777LAT-CONFIG: flag for the configuration of the lat (1 = nominal science configuration, 0 = not recommended for analysis) | 1 |
| ABS (ROCK ANGLE)888ROCK ANGLE: angle of the spacecraft -axis from the zenith (positive values indicate a rock toward the north). | |
| ROI-based zenith angle cut | yes |
We list the basic properties of the three clusters in Table 1.
| Coma | Fornax | Virgo (M87) | |
| RA (deg) | 194.9468 | 54.6686 | 187.6958 |
| DEC (deg) | 27.9388 | -35.3103 | 12.3369 |
| (Mpc)aaAngular diameter distance from the NASA extragalactic database. | 95.8 | 17.5 | 22.3 |
| ()bbCluster halo mass defined as mass within the radius, , within which the average density equals 200 times the critical density of the universe. Values of masses taken from Pinzke et al. (2011). | 1.3e15 | 2.4e14 | 6.9e14 |
| (deg)bbCluster halo mass defined as mass within the radius, , within which the average density equals 200 times the critical density of the universe. Values of masses taken from Pinzke et al. (2011). | 1.3 | 4.1 | 4.6 |
| ccIntegrated coefficient, , over the solid angle spanned by the cluster virial radius, assuming a smooth NFW density profile. | 5.9e-5 | 4.1e-4 | 6.3e-4 |
| Boost factorddBoost factor relative to the total annihilation luminosity within the virial radius due to substructures, extrapolated to a subhalo mass limit of | 1.3e3 | 6.5e2 | 9.8e2 |
3.2 Maximum-likelihood fitting
We use the pyLikelihood tool shipped with the Fermi Science Tools software package (version v9r23p1-fssc-20111006) to perform a maximum likelihood (ML) analysis (Mattox et al., 1996). After applying appropriate data cuts, as described in section 3.1, we bin the data into 0.1 degree-wide pixels and 30 logarithmic energy bins within a radius of 10 degrees around each cluster. This large radius is chosen to account for the large LAT PSF size ( degrees at 100 MeV999The LAT PSF size scales roughly as , so at 1 GeV it is deg).
A model is constructed to fit the data including all known foreground and background emission, as well as DM and CR components. We include all the point sources from 2FGL within a radius of 15 degrees from the cluster center in the model, plus the most recent galactic (GAL) and extragalactic (EG) diffuse emission given by the template files gal_2yearp7v6_v0.fits and iso_p7v6source.txt. The normalization of the GAL and EG diffuse components are allowed to vary during the fitting. Within the cluster virial radius there are two 2FGL point sources in Fornax, and three in Virgo, one of which is associated with the central AGN, M87 (Abdo et al., 2009). We allow the normalization and power-law spectral index of these five point sources to vary freely. Parameters for other point sources are fixed as in the 2FGL catalog.
A surface brightness template given by the dimensionless factor J in Equation 2 is generated for each cluster out to a 15 degree radius by summing up both the contribution from a smooth NFW profile and the boost from subhalos. This J-map is used to fit for extended cluster annihilation emission. For the point source model, the integrated factor in Equation 3 is used to derive an annihilation cross-section from the fitted total flux.101010This only strictly applies if the cluster size is smaller than the PSF size so that the entire cluster within the virial radius can be approximated as a point source. Otherwise, the integration over solid angle should only extend to the angular resolution of the telescope. However, since the surface brightness for a smooth NFW profile drops rapidly with radius, and because of the energy dependent PSF size, we choose to use a generic estimation of as given by an integral over the cluster virial radius. Similarly, a CR photon template is generated for each cluster out to three times the cluster virial radius, where the surface brightness has dropped to below of the central value and beyond which the model is not reliable. Images for various model components are shown in Figure 1 taking Virgo as an example.
The photon counts within each pixel are treated assuming Poisson statistics for each energy bin to calculate the likelihood. The best-fit parameters are obtained when the likelihood for the entire data set is maximized. The significance of a given component of interest (e.g. DM or CR) from the ML fitting is quantified by the likelihood ratio statistic,
| (11) |
where is the maximum likelihood for the full model, and is the maximum likelihood for the null hypothesis, i.e, the model without the component of interest. This test statistic (TS) approximately follows a distribution, with one degree of freedom for our case where the normalization is the only free parameter. The probability that a given value of TS arises purely from fluctuations of the null hypothesis is:
| (12) |
The factor comes from the constraint that the normalization parameter is non-negative. The significance of detection can thus be quoted as (one sided Gaussian confidence).
4 Results
4.1 Constraints on CR emission
With all the model components defined above, we first proceed with ML fitting for a model with no DM annihilation but with cosmic rays, the “CR-only” model hereafter. Note that the GAL and EG backgrounds, as well as the nearby point sources are always implicitly included in the analysis, as described in section 3.2. The results for the CR-only model fitting are listed in Table 2. The fitted CR levels all agree within a factor of three with the theoretical predictions. While Fornax is the most poorly constrained due to its intrinsically low CR level, the derived upper limit for Coma already rules out the fiducial value at 95% confidence.
| aaBest fit normalization ( is the theoretical prediction.) | bb95% upper limit (UL) on the normalization | (ph cm-2 s-1) | TS | |
|---|---|---|---|---|
| Coma | 0.5 | 2.74e-09 | 5.2 | |
| Fornax | 6.4 | 2.4e-09 | 0.6 | |
| Virgo | 2.3 | 2.1e-08 | 8.2 |
4.2 Constraints on DM annihilation
Given the low significance of the CR detection in the CR-only model, it is not safe simply to adopt the best fit values for further extraction of the DM signal. Instead, we consider the following four families of cosmic ray models in the presence of a DM component:
- Fiducial-CR model.
-
The CR level is fixed to the theoretical expectation, . Since this is larger than the upper limits derived for Coma, we exclude Coma from further discussion for this family.
- Optimal-CR model.
-
The CR level is taken as the best-fit value listed in Table 2.
- Free-CR model.
-
The normalization of the CR level is treated as a free parameter.
- No-CR model.
-
No CR emission is considered, only DM.
For each family, both point source (PT) and extended (EXT) profiles are considered for the DM component.
4.3 The channel
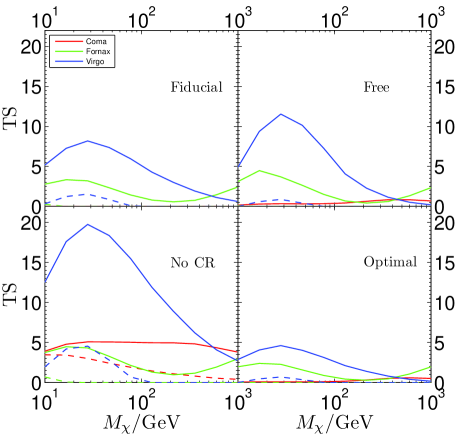
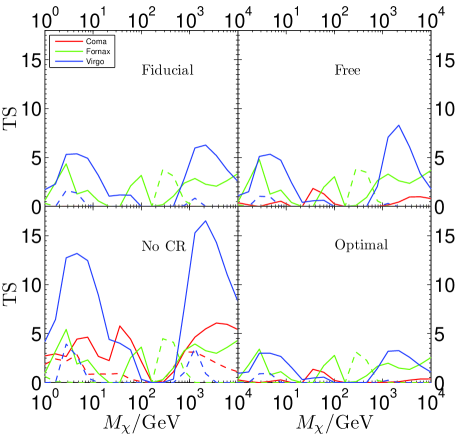
The significance for the channel of annihilating DM is shown in Figure 4. It can be seen that in almost all cases, the EXT profile has higher significance than the PT profile, over the entire DM mass range considered. There is no significant evidence for a PT model component within Fornax. For the four families of models, the No-CR model has the highest DM significance. In particular, a peak TS value of 19.8, corresponding to a confidence level, is obtained for Virgo with the EXT profile when no CR component is considered. This decreases to when a CR component with free normalization is included and is even lower when the CR level is fixed either to the fiducial or the optimal levels. There is a general trend for the significance to peak in the mass range GeV for all three clusters. This is consistent with the conclusion of Hooper & Linden (2011), who claim that a DM model with particle mass in the range GeV annihilating into final states can explain the excess extended emission observed from the direction of the Galactic center.
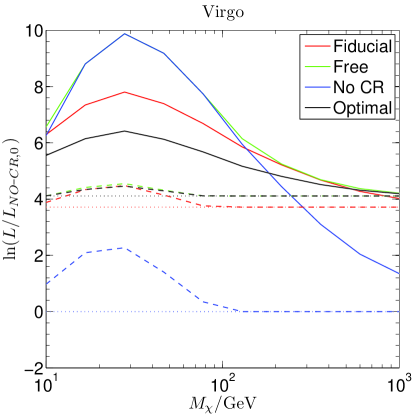
To facilitate comparison between all different model families and assess the significance of a CR component, we show the maximum likelihood values for each model of the Virgo cluster in Figure 5. As seen in the TS curves, the likelihood for the extended model is always higher than that for the point source model. For the most likely mass range, GeV, the No-CR and Free-CR models with extended DM emission share the highest likelihood, with the No-CR model being superior by having one fewer parameter. Actually there is effectively no contribution from CR when CR and DM are fitted simultaneously for this particle mass range, and the fiducial and optimal CR levels are above the 95% CR upper limit predicted from the Free-CR model in the presence of extended DM annihilation. This preference for DM over CR also obtains for Fornax, although the optimal and fiducial CR cases are still allowed in the presence of an extended DM component. The story is very different in Coma, where the DM and CR components are almost degenerate in the sense that either component alone has a similar level of likelihood.
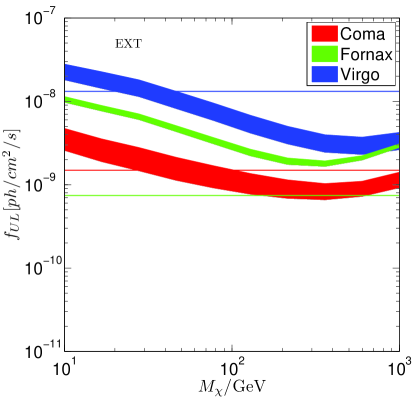
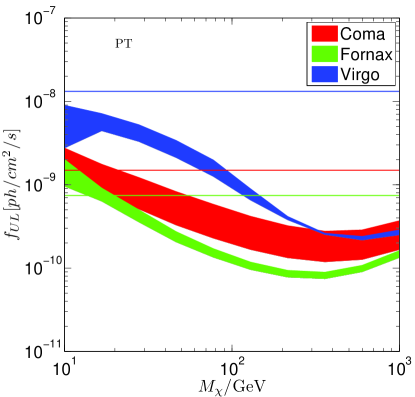
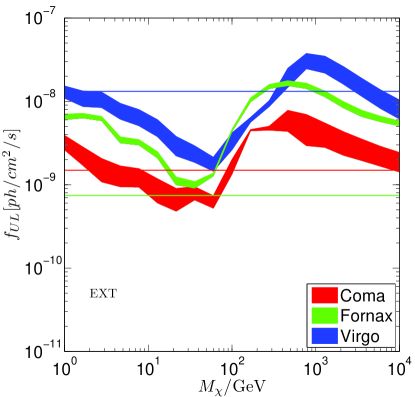
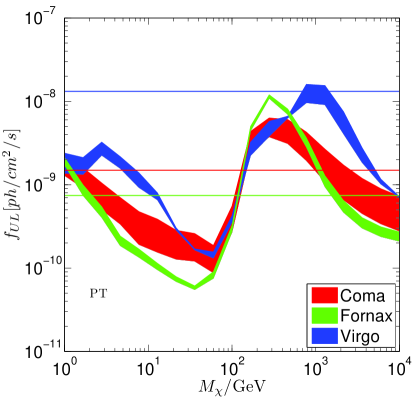
In Figure 6 we show the 95% confidence upper limits on the DM annihilation flux and compare them to the CR levels. For each cluster, the colored stripes are defined by the minimum and maximum upper limit predictions among the four families of models. The optimal CR levels in the three clusters are all comparable to the fitted DM flux, and the DM flux upper limits for the four different CR models vary only within a factor of two, with the No-CR and Optimal-CR cases predicting the highest and lowest upper limits. The left and right panels show the results for the PT and EXT models respectively; the PT models always have lower flux upper limits than the extended models.
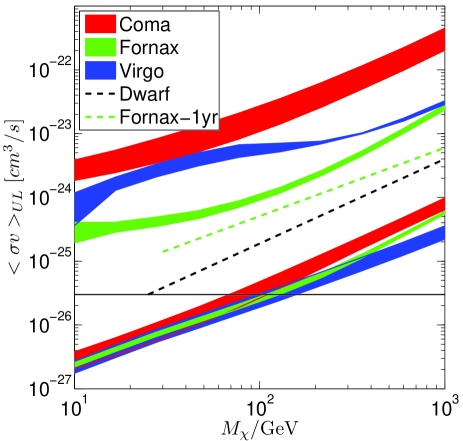
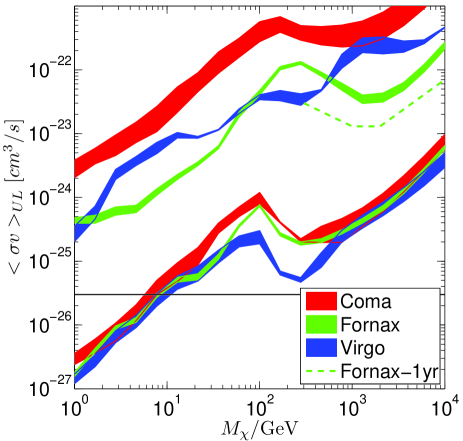
The flux upper limits are translated into cross-section upper limits in Figure 12, using Equation 1. These are also shown as colored regions reflecting the variance in the different treatments of CR. Although the predicted flux upper limits decrease slowly with DM particle mass and remain within the same order of magnitude for the mass range considered, the resulting cross-section upper limits increase by a factor of 100 from low to high particle mass. This is because low mass particles correspond to higher DM number densities (the factor in Equation 1) for a given mass density, so to obtain the same flux level, the required cross-section must be smaller for low mass particles. With the help of a boost factor of order , a much lower cross-section is needed (by a factor of at least 100) for extended annihilation models to achieve a slightly higher flux upper limit than point source models.
Our cross-section limits are much lower than the 11-month Fermi-LAT constraints in Ackermann et al. (2010), where the tightest constraint came from Fornax for a much lower assumed boost factor of . Our limits are also tighter than that from a joint analysis of the dwarf satellites of the Milky Way by Geringer-Sameth & Koushiappas (2011). They drop below the fiducial thermal cross-section of for GeV. Of the three clusters, Virgo has the highest significance and flux upper limits and places the tightest constraints on the annihilation cross-section. The best-fit cross-section for the extended model is closer to the thermal cross-section than that for the point source model. For example, for GeV and where the TS value is higher than 2, the best-fit cross-section is for the extended model and for the point source model.
4.4 The channel
The significance, flux upper limits and cross-section upper limits for DM annihilating through the channel are plotted in Figures 8 to 10. The predicted flux upper limits for Coma and Virgo are still comparable to the CR level, with Fornax having much lower CR emission. A DM particle mass of GeV is preferred, which is also consistent with the values inferred from analysis of the Galactic center emission by Hooper & Linden (2011). In addition, a second region of high significance is obtained for TeV. The inferred cross-section falls below the canonical value for DM particle masses less than 10 GeV. Note the discontinuity in the upper limit predictions around 100 GeV which reflects the transition from the prompt annihilation dominated regime to the IC emission dominated regime in the photon spectrum.
4.5 Examination of the excess emission
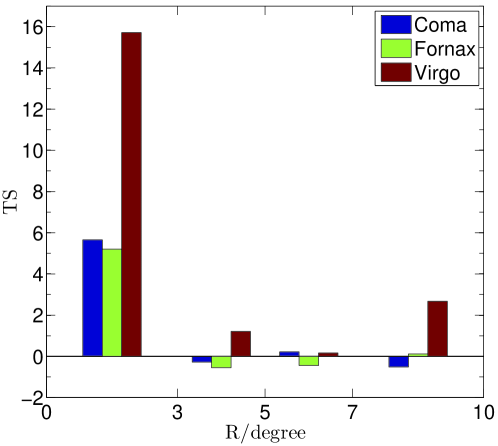
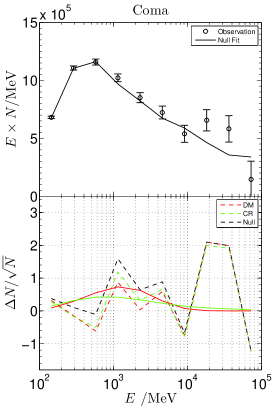
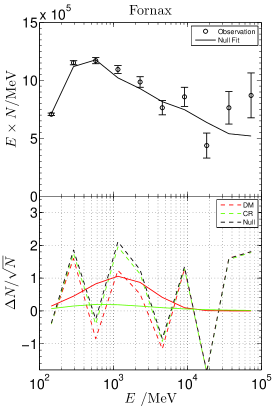
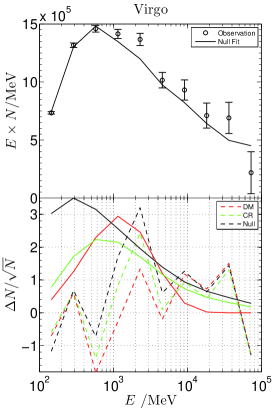
To pin down the source of the significance of our fits, in Figure 11 we break down the TS value for our preferred particle model into contributions from four radial ranges. Clearly, most of the significance for the DM model comes from the region within 3 degrees around each cluster. The spectrum within this region (Figure 12) shows excess emission around 1 GeV for all three clusters relative to a fit with no DM or CR components (the null model). This excess is consistent with an almost scale-free spectrum (), picking out DM particles in the range GeV for and GeV for final states, for which the cutoff at the high energy end and the IC boost at the low energy end are not significant around GeV energy scales. At much higher masses (above 1 TeV) in the channel, where IC emission completely dominates the annihilation spectrum and begins to harden again around GeV scales, the TS for the annihilation component picks up again, as seen in Figure 8.
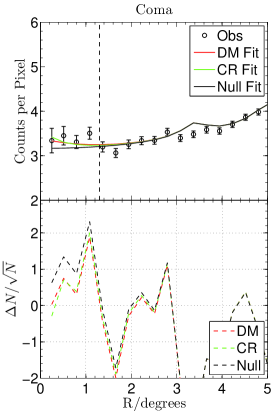
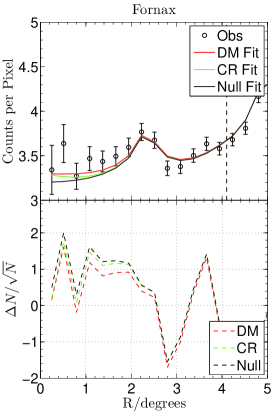
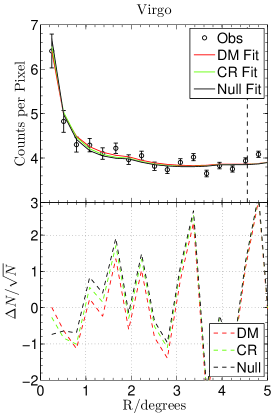
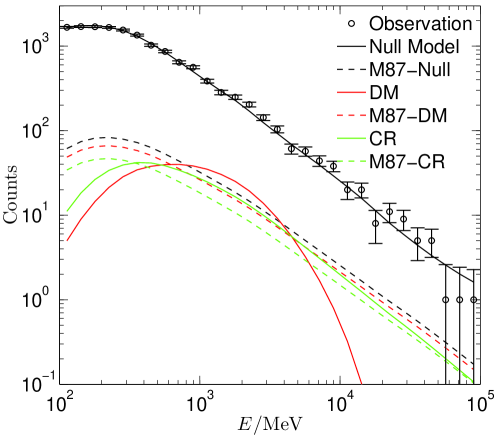
The radial profile of the photon counts also reveals signs of excess emission in the central regions of the clusters when fitted with the null model, as shown in Figure 13. The central cluster emission is apparent in Coma and Fornax but in Virgo it can be observed only weakly in a ring of [1,3] degrees, due to the existence of a central point source, M87. We show the fitted photon counts spectrum of M87 in the null, DM-only and CR-only models explicitly in Figure 14. The total flux for M87 is comparable to the CR and DM flux and varies by 20 to 30 percent in different models without much change in the spectral shape. The low energy dip for the three components comes from the decrease in the instrument’s effective area at low energy. The AGN spectrum differs from the CR spectrum primarily at low energy and is distinct from the DM spectrum over a wide energy range. This, together with their different radial profiles, helps to disentangle the two components easily during the fitting. In Fornax, however, the central excess is only partly fitted by a DM component. We checked that the remaining part is mostly associated with a low energy spectral excess below 400MeV, which is not fitted by the current DM spectrum.
A possible reason for a central excess we have found in all three clusters is a systematic error in the fitting. For instance, if the fixed point sources outside the cluster virial radius have too much flux attributed to them, then the diffuse EG and GAL components would be biased low and would not contribute enough model flux to the central region. This would lead to an excess in the center. However, we have verified that our fits are insensitive to whether all the point sources are kept fixed or allowed to vary freely.131313When the M87 parameters are fixed to the 2FGL values, the significance of the DM detection in Virgo decreases to less than . However, we find that the 2FGL parameter values tend to overfit the current data slightly. When the M87 parameters are refitted within the null model, the normalization decreases by 15 percent and if this value is then fixed when fitting for an additional DM component, the significance for the DM and CR components are almost the same as when the fits are performed in our standard way. In addition, we have carried out the same analysis on three regions randomly selected from the 3-year LAT sky where no known prominent clusters exist near the center. No central excess is observed in any of these three regions, suggesting that the excess emission is related to the presence of the galaxy clusters.
To see how common the extended emission is in galaxy clusters, we have searched in seven other clusters adopting our preferred DM particle model with GeV in the channel. These seven clusters – M49, A1367, AWM7, Centaurus, Hydra, NGC4636 and NGC5813 – are predicted to have high annihilation flux by Pinzke et al. (2011). They are also selected to lie at least 15 degrees away from the galactic plane. A DM significance comparable to that in Fornax is found in M49 and A1367141414The central excess in A1367 is more consistent with a point source profile, with a significance of . with a TS value around 4, while Centaurus, NGC4636 and NGC5813 show no sign of DM annihilation emission at all. We point out that these additional clusters are all very compact on the sky (except M49) with a virial radius close to or smaller than 2 degrees, making it difficult to exploit the information contained in the radial profile. In addition, the existence of additional sources inside the virial radius (one point source in Hydra and NGC4636, two point sources and one extended source (CenA Lobe) inside Centaurus) complicates the analysis further.
5 Discussion and conclusions
We have performed maximum likelihood fits to the 3-year Fermi-LAT data for three galaxy clusters: Coma, Fornax and Virgo. We fit models which, in addition to point sources and galactic and extragalactic backgrounds, include emission due to dark matter (DM) annihilation and cosmic rays (CR). For the former, we assume both a point source and the theoretically predicted extended distribution of gamma rays in two generic annihilation channels. When searching for a dark matter signal, we experiment with different treatments of the CR component. Our main results are as follows.
-
•
Assuming no DM annihilation radiation, the gamma ray data from Coma and Virgo already set significant constraints on the CR level at more than 2. For Virgo, the data are consistent with the predictions from the analytic CR model proposed by Pinzke & Pfrommer (2010); Pinzke et al. (2011) while, for Coma, the data give an upper limit that is a factor of two lower than the analytic prediction, indicating either an uncertainty in model parameters such as halo mass and gas density, or a peculiarity of the CR emission in Coma. If interpreted as an error in the halo mass, a reduction in mass by a factor of is required to reconcile the model with the upper limits, assuming a simple CR luminosity scaling relation, (Pinzke & Pfrommer, 2010), or a factor of according to Equation A1 in the case when the gas density profile is fixed from X-ray observations. For Fornax, the non-detection of a CR component is consistent with the low level predicted by the model.
-
•
Assuming no CR emission, we obtain a detection of DM in Virgo at the significance level (TS=19.8) for a model in which supersymmetric DM particles of mass GeV annihilate into the channel giving rise to an extended surface brightness profile as predicted by the simulations of Gao et al. (2011). For Coma and Fornax the significance of a DM component is lower, and respectively. The inclusion of cosmic rays suppresses the likelihood of the DM annihilation component, depending on the treatment of the CR emission. For Virgo the significance decreases to when a free CR component is included and to and respectively when our fiducial and optimal CR models are included. The predicted DM annihilation flux and cross section upper limits are more robust to the uncertainty in the CR component for all three clusters, with the results for different CR models agreeing to within a factor of two.
-
•
Assuming neither CR nor DM annihilation emission results in excess emission within three degrees around each cluster. The spectrum within this region shows that this excess peaks at around 1 GeV. These two features combined lead to an increase in likelihood when an extended emission component with an almost scale-free spectrum is included in the model, explaining the significance seen in the CR and DM components.
-
•
The DM model that best fits the spectral excess has a particle mass in the range GeV for final states or GeV and TeV for final states. These mass ranges are consistent with the conclusions of the recent analysis of a gamma-ray excess in the direction of the Galactic Center (Hooper & Linden, 2011). The preferred masses are robust to changes in the treatment of cosmic rays. Within these mass ranges, DM emission is preferred by the data over CR emission in Virgo and Fornax.
-
•
Models in which the DM annihilation emission has the extended profile predicted by cosmological simulations have a higher significance and higher flux upper limits than models in which this emission is assumed to be a point source. Due to the large boost factor of the order of 1000, the cross-section upper limits for extended models are at least 100 times lower than those for point source models. Our cross-section constraints are much tighter than those from an analysis of clusters using the 11-month data (Ackermann et al., 2010) and are also tighter than those from a joint analysis of the Milky Way’s dwarf galaxies (Geringer-Sameth & Koushiappas, 2011; The Fermi-LAT Collaboration: M. Ackermann et al., 2011). Our new limits exclude the thermal cross-section for GeV for final states and for GeV for final states. The thermal cross-section, however, can still be reconciled with the data by lowering the assumed boost factor from subhalos and hence the factor. Since the boost factor, (Springel et al., 2008), a cut-off mass of , rather than our assumed , would be sufficient to increase the cross-section limits by a factor of 3.
In our analysis we have chosen to adopt the values given in the LAT 2-year point source catalogue for the intensity and spectral shape of the point sources lying within the virial radius of each cluster (where the DM annihilation and CR emission levels are relatively important). This allows for possible corrections to the point source parameters in the presence of the CR and DM components, while also avoiding the risk of re-fitting sources lying near the boundary of the data region with less accuracy. However, we also tried keeping all the point sources fixed or allowing the parameters of all the point sources within the data region to vary during the fitting. We find that this freedom in the treatment of the point sources has little impact on the DM model fits. Our results are insensitive to the uncertainty in cluster halo masses or concentration parameters. A change in halo mass by a factor of 4, or a change in concentration parameter by a factor of 2 would only change the overall normalization of the inferred DM annihilation emission by a factor of 2 with the profile shape remaining unchanged outside . We also checked that the different energy cuts assumed in our analysis and in that of Huang et al. (2011) has no effect on the derived upper limits. We are able to reproduce the upper limits on the annihilation cross-section of Huang et al. (2011) for the test case of the Fornax cluster, after correcting for slightly different assumed boost factors.
The Virgo cluster where we have obtained our most significant DM signal has a complex structure. Although we have concluded that the central gamma-ray source in M87 does not interfere with our detection, the existence of several neighboring structures (M86/M84, M49, M60, M100), which show signs of interactions, could result in a complex annihilation profile. Given the high significance of our result for Virgo, it is worthwhile trying to improve the model for this cluster as a multi-component structure and to use simulations of merging clusters to improve the theoretical annihilation profile.
While we have shown that Virgo has an exceptionally high signal for DM-like emission, the signal-to-noise ratio can be enhanced by stacking several clusters. Such an analysis was recently carried out by Huang et al. (2011), but the signal-to-noise was degraded by the assumption of an NFW annihilation profile rather than the extended profile seen in the simulations. They considered an extended subhalo-dominated annihilation profile but only for individual clusters, not for the stack. Their stacked analysis resulted in looser constraints on DM annihilation than their analysis of individual clusters, presumably because the use of an inappropriate theoretical profile resulted in the different clusters yielding inconsistent results. Thus, it is clearly worth repeating the joint analysis with the “correct” subhalo-dominated profile. It is also tempting to extend the search for DM annihilation to multi-wavelength data from the radio to very high energy gamma-rays.
The significance of the excess DM-type annihilation emission that we have detected in our small cluster sample is only marginal and needs to be confirmed with future observations. Nevertheless, the similarity with the excess gamma-ray emission from the Galactic center and the general trend for such excess emission in all three clusters examined here is intriguing.
Acknowledgments
JXH is supported by the European Commissions Framework Programme 7,through the Marie Curie Initial Training Network Cosmo-Comp (PITNGA-2009-238356). CSF acknowledges a Royal Society Wolfson research merit award and an ERC Advanced Investigator grant. The calculations for this work were performed on the ICC Cosmology Machine, which is part of the DiRAC Facility jointly funded by STFC, the Large Facilities Capital Fund of BIS, and Durham University. This work was supported in part by an STFC rolling grant to the ICC. We thank Shaun Cole, Jie Liu and Yu Gao for helpful discussions. JXH acknowledges the support on software issues from Tesla Jeltema and the Fermi science support team, especially Elizabeth C. Ferrara, Jeremy S. Perkins and Dave Davis.
References
- Abdo et al. (2009) Abdo, A. A., Ackermann, M., Ajello, M., et al. 2009, ApJ, 707, 55
- Ackermann et al. (2010) Ackermann, M., Ajello, M., Allafort, A., et al. 2010, J. Cosmology Astropart. Phys, 5, 25
- Baxter & Dodelson (2011) Baxter, E. J., & Dodelson, S. 2011, Phys. Rev. D, 83, 123516
- Boyarsky et al. (2010) Boyarsky, A., Malyshev, D., & Ruchayskiy, O. 2010, ArXiv e-prints
- Chernyakova et al. (2011) Chernyakova, M., Malyshev, D., Aharonian, F. A., Crocker, R. M., & Jones, D. I. 2011, ApJ, 726, 60
- Ciafaloni et al. (2011) Ciafaloni, P., Comelli, D., Riotto, A., et al. 2011, J. Cosmology Astropart. Phys, 3, 19
- Cirelli et al. (2011) Cirelli, M., Corcella, G., Hektor, A., et al. 2011, J. Cosmology Astropart. Phys, 3, 51
- Diemand et al. (2007) Diemand, J., Kuhlen, M., & Madau, P. 2007, ApJ, 657, 262
- Duffy et al. (2008) Duffy, A. R., Schaye, J., Kay, S. T., & Dalla Vecchia, C. 2008, MNRAS, 390, L64
- Gao et al. (2011) Gao, L., Frenk, C. S., Jenkins, A., Springel, V., & White, S. D. M. 2011, ArXiv e-prints
- Geringer-Sameth & Koushiappas (2011) Geringer-Sameth, A., & Koushiappas, S. M. 2011, ArXiv e-prints
- Gondolo & Silk (1999) Gondolo, P., & Silk, J. 1999, Physical Review Letters, 83, 1719
- Hooper & Goodenough (2011) Hooper, D., & Goodenough, L. 2011, Physics Letters B, 697, 412
- Hooper & Linden (2011) Hooper, D., & Linden, T. 2011, ArXiv e-prints
- Huang et al. (2011) Huang, X., Vertongen, G., & Weniger, C. 2011, ArXiv e-prints
- Jeltema et al. (2009) Jeltema, T. E., Kehayias, J., & Profumo, S. 2009, Phys. Rev. D, 80, 023005
- Mattox et al. (1996) Mattox, J. R., Bertsch, D. L., Chiang, J., et al. 1996, ApJ, 461, 396
- Navarro et al. (1996) Navarro, J. F., Frenk, C. S., & White, S. D. M. 1996, ApJ, 462, 563
- Navarro et al. (1997) —. 1997, ApJ, 490, 493
- Pinzke & Pfrommer (2010) Pinzke, A., & Pfrommer, C. 2010, MNRAS, 409, 449
- Pinzke et al. (2011) Pinzke, A., Pfrommer, C., & Bergstrom, L. 2011, ArXiv e-prints
- Springel et al. (2008) Springel, V., White, S. D. M., Frenk, C. S., et al. 2008, Nature, 456, 73
- The Fermi-LAT Collaboration (2011) The Fermi-LAT Collaboration. 2011, ArXiv e-prints
- The Fermi-LAT Collaboration: M. Ackermann et al. (2011) The Fermi-LAT Collaboration: M. Ackermann, Ajello, M., Albert, A., et al. 2011, ArXiv e-prints
- Zaharijas et al. (2010) Zaharijas, G., Cuoco, A., Yang, Z., & Conrad, J. 2010, ArXiv e-prints
Appendix A Semi-Analytic formula for the Cosmic Ray induced gamma-ray emission
Here we summarize the relevant equations for calculating the CR induced gamma-ray emission in galaxy clusters as derived in Pinzke & Pfrommer (2010) and Pinzke et al. (2011). The CR induced photon source function from pion decay can be decomposed as:
The spatial part is given by:
| (A1) |
with
| (A2) | |||||
| (A3) | |||||
| (A4) |
The spectrum is given as:
| (A5) | |||||
with , , the proton mass and
| (A6) |
The proton cut-off energy is
| (A7) |
and .
| (A8) |
The maximum shock acceleration efficiency is chosen to be so that . The gas density is fitted with multiple beta-profiles (Pinzke et al., 2011) as:
| (A9) |
where is the primordial hydrogen mass fraction and is the ratio of electron and hydrogen number densities in fully ionized ICM, with parameter values for , and listed in TABLE VI of Pinzke et al. (2011).