A new candidate for probing Population III nucleosynthesis with carbon-enhanced damped Lyman- systems††thanks: Based on observations collected at the W.M. Keck Observatory, which is operated as a scientific partnership among the California Institute of Technology, the University of California and the National Aeronautics and Space Administration. The Observatory was made possible by the generous financial support of the W. M. Keck Foundation.
Abstract
We report the identification of a very metal-poor damped Ly system (DLA) at that is modestly carbon-enhanced, with an iron abundance of solar ([Fe/H] ) and [C,O/Fe] . Such an abundance pattern is likely to be the result of nucleosynthesis by massive stars. On the basis of 17 metal absorption lines, we derive a upper limit on the DLA’s kinetic temperature of K, which is broadly consistent with the range of spin temperature estimates for DLAs at this redshift and metallicity. While the best-fitting abundance pattern shows the expected hallmarks of Population III nucleosynthesis, models of high-mass Population II stars can match the abundance pattern almost as well. We discuss current limitations in distinguishing between these two scenarios and the marked improvement in identifying the remnants of Population III stars expected from the forthcoming generation of 30-metre class telescopes.
keywords:
galaxies: abundances galaxies: evolution quasars: absorption lines1 Introduction
With the advent of the Sloan Digital Sky Survey in combination with metre class telescopes, it has become possible to routinely identify clouds of gas in the high redshift Universe that harbour the metals from some of the earliest stellar populations (Pettini et al., 2008a; Penprase et al., 2010; Becker et al., 2011; Cooke et al., 2011b). The challenge we are now faced with is to measure the allowable ranges of mass, explosion energy, and metallicity of these early stars, using metal-line diagnostics alone. In the last decade, attention has been drawn to the diagnostic power of carbon for probing the nature of zero or near-zero metallicity stars. In particular, it is believed that metal-free stars are more likely to yield an abundance pattern that is enhanced in carbon relative to iron (Umeda & Nomoto, 2003). In fact, such signatures may be observed among the population of metal-poor stars in the halo of our Galaxy that exhibit a marked carbon-enhancement in their atmosphere; these stars are known as carbon-enhanced metal-poor (CEMP) stars, and are currently defined to have [C/Fe] (Aoki et al. 2007, although some authors adopt [C/Fe] or as the defining cut).111We adopt the standard notation: [A/B] , where refers to the number of atoms of element A and B, and the second term refers to the solar ratio.
Several possibilities have been put forward to explain the peculiar abundance patterns of these stars. One option is that they result from mass transfer from a now extinct asymptotic giant branch companion star. This type of CEMP star also exhibits enhancements in its s-process neutron-capture elements, and is thus labelled a CEMP-s star. The above mechanism is now a well-established means to produce a CEMP-s star (Lucatello et al., 2005). Alternatively, the carbon enhancement may be the residual signature from a previous generation of stars — possibly Population III — that seeded (with high carbon abundance) the birth cloud of the star we see today (Ryan et al., 2005). These are known as CEMP-no stars, as they show no strong enhancement in their neutron-capture elements. Perhaps the strongest empirical evidence in support of the latter picture is the observation of an increasing fraction of CEMP stars with decreasing metallicity (Beers & Christlieb, 2005). Furthermore, the fraction of CEMP stars that are labelled as CEMP-no stars becomes relatively more common at the lowest metallicities (Aoki et al., 2007).
Additional evidence in support of this picture has recently been provided by the discovery of a CEMP damped Ly system (DLA) at with [Fe/H] and [C/Fe] (Cooke et al., 2011a). These authors proposed that such DLAs could be the missing link between the enrichment of a primordial cloud by Population III stars, and the later incorporation of the trace metals into objects such as the CEMP-no stars seen in the halo of our Galaxy. Indeed, models of metal-free nucleosynthesis are able to successfully reproduce the observed abundance pattern for this DLA (Kobayashi, Tominaga, & Nomoto, 2011). However, there may be an additional contribution to the metal content of this DLA from long-lived second generation asymptotic giant branch stars (Salvadori & Ferrara, 2012), which are known to be prolific carbon producers.
| Ion | Transitions used | log (X)/ | log (X) | log (X) | [X/H] | [X/Fe] |
|---|---|---|---|---|---|---|
| H i | 1025, 1215 | 20.47 0.07 | — | 12.0 | — | — |
| C ii | 1036, 1334 | 14.65 0.10 | 8.43 | |||
| N i | 1200.2 | 12.62 0.14 | 7.83 | |||
| O i | 971, 976, 988, 1039, 1302 | 14.94 0.05 | 8.69 | |||
| Al ii | 1670 | 11.92 0.03 | 6.44 | |||
| Si ii | 989, 1260, 1304, 1526 | 13.40 0.03 | 7.51 | |||
| S ii | 1253, 1259 | 13.11 0.09 | 7.14 | |||
| Fe ii | 1144, 1260, 1608 | 13.10 0.03 | 7.47 |
a.
bWe have not included the uncertainty in H i.
cAsplund et al. (2009).
d[X/H].
DLAs are clouds of neutral gas seen in absorption against the light of background QSOs; their properties have been reviewed by Wolfe et al. (2005). As discussed by Pettini (2004) and more recently Cooke et al. (2011b), measurements of their chemical composition complement very effectively local stellar abundance studies. While most DLAs are metal-poor, with typical metallicities of of solar (Ellison et al., 2012), interest has recently focused on identifying and studying the most metal-poor DLAs, with [Fe/H] , which may still retain the nucleosynthetic signatures of the first episodes of metal enrichment in the Universe (Erni et al., 2006; Pettini et al., 2008a; Penprase et al., 2010; Cooke et al., 2011b).
Empirically, it is found that the most metal-poor DLAs tend to have very quiescent kinematics, with most of the metal line absorption concentrated in one or two components of low velocity dispersion. For example, the CEMP DLA reported by Cooke et al. (2011a) consists of a single absorption component with an internal one-dimensional velocity dispersion km s-1. In this extreme regime it becomes important to differentiate between bulk gas motions which broaden all absorption lines by the same amount, and thermal motions which, for the same gas temperature, broaden lighter elements more than heavier ones (see Section 3). Unfortunately, with present instrumentation it is generally not possible to fully resolve the metal line profiles produced by such quiescent gas, although under favourable circumstances a curve-of-growth analysis can help to separate the relative contributions of turbulent and thermal broadening to the line equivalent widths (e.g. O’Meara et al., 2001; Jorgenson et al., 2009; Tumlinson et al., 2010; Carswell et al., 2011).
In their analysis of the CEMP DLA at Cooke et al. (2011a) assumed that turbulent motions dominate, as is the case if the gas temperature is less than a few thousand degrees. Higher temperatures would have the effect of decreasing selectively the carbon abundance, and hence the degree of carbon enhancement (see Section 3 for further details), although the resulting line profiles are a poorer fit to the data (Cooke, 2011c; Carswell et al., 2012).
In order to make progress on these issues it is important to identify and study further examples of CEMP DLAs. In this paper we report the discovery of a new candidate with a lower carbon enhancement than the first example of this class, but where the gas temperature can be constrained within a narrower range. In Section 2 we describe the observations and data reduction procedures, saving the discussion of line profile fitting and the abundance analysis to Section 3. We discuss the possibility of using such systems to measure the kinetic temperature of DLAs in Section 4, before comparing the best-fitting abundance pattern to models of stellar nucleosynthesis in Section 5 and concluding in Section 6.
2 Observations and Data Reduction
To search for additional candidate CEMP DLAs out of the increasing database of damped systems, we target metal-poor systems showing an unusually strong C ii absorption line in spectra recorded at medium resolution (full width at half maximum, FWHM – km s-1). While this relatively coarse resolving power is insufficient for a reliable abundance analysis (Cooke et al., 2011b), it does provide the means to identify some of the most promising candidates.
We selected the DLA at towards the quasar J13586522 on the basis of the Echelle Spectrograph and Imager (ESI) observations with FWHM km s-1 by Penprase et al. (2010). These authors reported [O/H] and [C/O] ; given that DLAs in this metallicity regime commonly exhibit an -enhancement of [O/Fe] (Cooke et al., 2011b), the Penprase et al. (2010) data suggest that [C/Fe] .
We conducted follow-up observations of J13586522 for s divided into nine exposures with the W. M. Keck Observatory’s High Resolution Echelle Spectrometer (HIRES; Vogt et al. 1994) on 2011 March 23, 24 (program ID: A152Hb). We used the C5 decker (a arcsec slit) which delivers a nominal resolution of km s-1 for a uniformly illuminated slit (but see Section 3, where we adopt a lower FWHM resolution of km s-1 due to the sub-arcsecond seeing conditions), which we sample with pixels. We used the red cross-disperser with the WG360 filter and on-chip binning.
The data were reduced with the makee
data reduction pipeline maintained by
Tom Barlow.222We used makee
version 5.2.4, available for download from
http://spider.ipac.caltech.edu/staff/tab/makee/
makee performs the usual steps relevant to
echelle data reduction, including bias subtraction,
flat-fielding, order definition and extraction.
Each science exposure was followed
by a ThAr hollow-cathode lamp
frame which was used to wavelength
calibrate the extracted orders. The wavelength
scale was converted to vacuum heliocentric
using the software package
uves_popler.333uves_popler
can be downloaded from
http://astronomy.swin.edu.au/mmurphy/UVES_popler/
This software was also used to combine
the extracted orders from all exposures, whilst
rejecting deviant pixels and unusable orders.
Finally, the combined spectrum was
normalised by fitting and dividing
out the quasar continuum and emission lines.
The metal absorption features of interest were
then extracted in km s-1 windows
about the line centroid, and a fine adjustment
to the continuum was applied if necessary. The
resulting signal-to-noise ratio of the data at
5000 Å is S/N per resolution element.
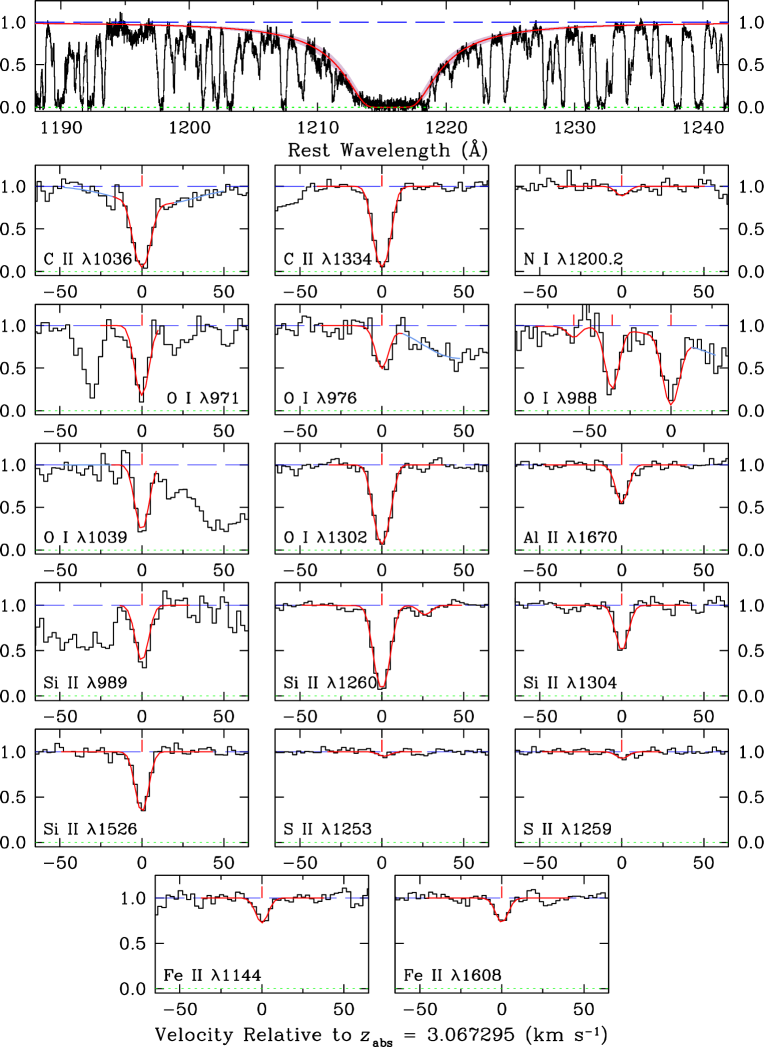
Examples of absorption lines in the
DLA are collected in Figure 1.
3 Analysis and Results
3.1 Profile Fitting
As can be seen from Figure 1 and Table 1, our HIRES spectrum covers many transitions of the dominant ionisation stages of C, N, O, Al, Si, S and Fe, as well as lines in the Lyman series of H i. All the metal lines exhibit a single, narrow absorption component which, with FWHM pixels, is just resolved with our instrumental resolution of pixels.
In order to deduce the corresponding element
abundances, we modelled the absorption lines
with theoretical Voigt profiles (convolved
with the instrumental broadening function)
using the -minimisation software
vpfit444vpfit is available from
http://www.ast.cam.ac.uk/rfc/vpfit.html,
which returns the best-fitting Doppler parameter
and
redshift of the DLA, in addition to the column densities
of the available ions. The line fitting procedure
consisted of three main steps, which we now outline.
3.2 Instrumental Resolution
In the first step, we determined the true value of the instrumental resolution which is likely to be lower than the nominal value of FWHM km s-1 appropriate to the uniformly illuminated slit provided by the C5 HIRES decker, given that the seeing during our observations was better than the 1.15 arcsec width of the slit. Examination of the emission line profiles from the Th-Ar hollow-cathode lamp showed that, at the signal-to-noise ratio of our data, a gaussian profile is a good approximation to the instrumental broadening function.
We assessed the resolution of our spectrum empirically from the metal lines in the DLA—which are the narrowest features available in the spectrum—using vpfit in a series of model fits which differed by the assumed value of the instrumental broadening FWHM and noting the corresponding value of , as described in Cooke et al. (2011a). The minimum value of was found to be that for an instrumental resolution FWHM km s-1, which we adopted in all the subsequent model fitting. Lowering the instrumental resolution from the nominal FWHM km s-1, to FWHM km s-1 has only a modest effect on the derived element abundances, since for most elements we cover at least one absorption line which is optically thin. Thus, for example, the change in the column density of Fe ii is only . The largest change is for C ii, , because both C ii and transitions are moderately saturated (see Figure 1).
3.3 Abundance Analysis
Having determined the most likely value of the instrument resolution, we used vpfit to derive the absorption parameters, or ‘cloud model’, that best represent the data. When transitions from elements of different atomic mass are available, as is the case here, vpfit can solve separately for the macroscopic, or turbulent, broadening parameter, , which is independent of atomic mass, and the microscopic, or thermal, broadening parameter, , which is related to the temperature of the gas and the mass of the ion via the standard relation: , where is the Boltzmann constant. The two contributions add in quadrature to give the total broadening: .
Given the simplicity of the kinematics of the DLA under consideration, where all the absorption lines due to ions that are dominant in neutral gas (in our case O i, N i, C ii, Al ii, Si ii, S ii and Fe ii) appear to consist of a single, narrow component, we forced vpfit to find the best-fitting values of , and common to all the above species. We found that a single component with redshift , Doppler parameter km s-1, and the ion column densities (and associated errors) as listed in Table 1, provides the best representation of the data. The corresponding line-profile fits are overplotted on the data in Figure 1. Interestingly, vpfit favours low values of temperature such that the broadening is dominated by turbulent motions (further details in Section 3.4).
Since the species observed are the dominant ion stages of the corresponding elements in H i regions, the element abundances can be obtained directly by dividing the ion column densities in the third column of Table 1 by the H i column density . Comparison with the solar abundance scale of Asplund et al. (2009) finally gives the abundance pattern relative to solar listed in the penultimate column of Table 1.
We find [Fe/H] , making this DLA one of the most metal-poor known. We also find [O/H] and [C/O] ; these values are significantly different from those reported by Penprase et al. (2010) from data of lower spectral resolution, [O/H] and [C/O] . As discussed by Cooke et al. (2011b), such differences are not unexpected when comparing medium- and high-resolution data (and are indeed the reason why high resolution follow-up observations of candidate metal-poor DLAs are essential for accurate abundance determinations, despite the substantial investment in observing time required).
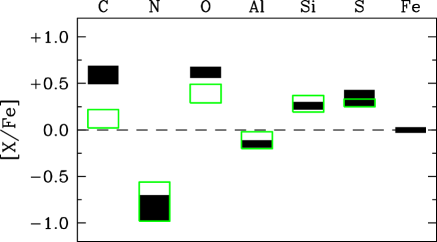
In Figure 2 we show the abundance pattern of the DLA relative to Fe, together with that of a typical ‘carbon-normal’ DLA, taken from the recent survey of very metal-poor DLAs by Cooke et al. (2011b). Both C and O appear enhanced relative to Fe by larger factors than is normally the case, although the C enhancement is much less pronounced than in the first reported case of a CEMP DLA, [C/Fe] in the DLA in line to the QSO J00350918 (Cooke et al., 2011a). Before considering possible interpretations of the chemical composition we have uncovered (Section 5), we discuss the effect of thermal broadening on the derived element abundances, estimated through a third and final set of vpfit simulations.
3.4 Thermal Broadening?
As explained in the previous section, the cloud model which best fits the observed metal line profiles is one in which thermal motions do not make a significant contribution to the line broadening, i.e. the gas in this DLA appears to be ‘cold’. We deduced an upper limit to the gas temperature by no longer treating as a free parameter in the line fitting procedure, but instead forcing vpfit to adopt a fixed value of ( remained a free parameter throughout these tests). In a procedure similar to that described by Carswell et al. (2012, see also ), we considered a grid of temperatures within the range , and for each value of , rerun vpfit to find the best-fitting model parameters and corresponding value of . In these tests we excluded the weak N i and S ii lines (see Figure 1), because they offer no constraint on the line broadening.
In Figure 3, we plot the resulting differential value, for each temperature, where refers to the of the best-fitting model. Noting that seven parameters can alter the total line width (i.e. the thermal and turbulent Doppler widths in addition to five column density estimates which are weakly anticorrelated with the total line width), the and percent confidence regions of the distribution (i.e. and for a normal distribution) correspond to and respectively. These are indicated with dashed lines in Figure 3. From this test we derive a upper limit to the DLA’s kinetic temperature of K. Furthermore, we remark that a cloud model where the line profiles are broadened entirely by thermal motions (resulting in a temperature K), gives and is thus ruled out at more than .
The effect of raising the gas temperature from the best-fitting low values to the upper limit is most pronounced for the C ii column density and corresponding C abundance. The reasons are two-fold. First, the two C ii lines accessible, and , are both strong and close to saturation (see Figure 1). For all other species transitions are available which are so weak that the column density is almost independent of the Doppler parameter, and is thus insensitive to the DLA temperature. Second, C is the lightest among the metals observed, and is thus the one with the largest value of at a given temperature. Consequently, adopting the upper limit K has the effect of reducing [C/Fe] by 0.37 dex relative to the value in Table 1, diluting the degree of C enhancement deduced for this DLA. On the other hand, [O/Fe] is unchanged (for the reasons just explained: both O and Fe have weak absorption lines in our spectrum); thus, even for the upper limit on the temperature, the [O/Fe] abundance in this DLA is away from the values typical of the metal-poor DLA population (Figure 2).
The usefulness of the analysis described above is limited by the fact that the masses of the elements included in our data set span less than a factor of five between C and Fe, so that the corresponding values of for a given differ by little more than a factor of two (recall that ). Further progress could be made by observing a much lighter element, such as D. However, absorption lines from the Lyman series of D i can only be resolved from the neighbouring H i transitions in high order Lyman lines (e.g. O’Meara et al., 2006; Pettini et al., 2008b); recording these transitions with the required S/N ratio will involve dedicated and time consuming observations in the ground-based UV portion of the spectrum.
In conclusion, while the most likely interpretation (i.e. the one producing the lowest value of ) of the absorption lines in the DLA considered here implies a C enhancement by a factor of ([C/Fe] ), the uncertainties introduced by the range of gas temperatures allowed by the data lead us to consider the DLA in front of J13586522 as a candidate CEMP DLA.

4 Gas temperature estimates in DLAs
At present, there have been very few measurements of the kinetic temperature for high redshift DLAs. This is hardly surprising, since the contribution to the total metal-line broadening in a gas with a temperature K is nearly undetectable, even for systems with a relatively low velocity dispersion ( km s-1). Indeed, the sole direct measurement of a DLA’s kinetic temperature, on the basis of metal-lines alone, was reported only recently by Carswell et al. (2012), who measured a gas temperature of K for the DLA towards Q.
For the DLA we report herein, the upper limit on the kinetic temperature of K is consistent with the gas residing in either a cold (a few K) or a warm (a few K) neutral medium. In fact, the absence of molecular absorption lines (or species such as C i) might suggest that the DLA’s gas is predominantly warm, with a temperature that is likely K (Petitjean, Srianand, & Ledoux, 2000). As a side note, we also comment that our derived limit for this system is consistent with the best-fitting temperature of K for the CEMP DLA towards J, using the metal absorption lines alone.
At present, the majority of DLA temperature estimates rely on measuring the spin temperature from the H i 21 cm line and assuming that it is thermalised (e.g. Kanekar et al., 2009; Srianand et al., 2012). This may not be a valid assumption in the metal-poor regime, where there are fewer atomic coolants available to lower the temperature of the gas below K; for temperatures above K, collisions are less efficient at thermalising the H i 21 cm line (see e.g. Liszt, 2001), resulting in a spin temperature that is somewhat less than the kinetic temperature. Although this remains to be tested in a system where both the spin and kinetic temperature can be derived, the current upper limits based on line-profile techniques are consistent with the lower limits afforded by spin temperatures for [Fe/H].
Certainly, the simplicity of the absorption lines from such quiescent DLAs highlights them as ideal systems to directly measure the kinetic temperature of neutral gas in the metal-poor regime. The ability to measure or place limits on the kinetic temperature of DLAs is an exciting prospect for future research; one could in principle test how the gas temperature varies as a function of metallicity, H i column density, and redshift.
5 Comparison with nucleosynthetic yields
We now compare the best-fitting abundance pattern shown in Figure 2 to illustrative models of stellar nucleosynthesis. The ultimate aim of this work is to decipher the clues into the nature of the stars responsible for the metal enrichment of the most metal-poor DLAs; here we look critically at what advances can be made towards this goal using the new data presented here.
At very low metallicities it is likely that the dominant metal yields are from massive stars (–) that explode as core-collapse supernovae (CCSNe). At present, however, we still lack a full physical understanding of the explosion mechanism that operates during the collapse of a massive star (see e.g. Mezzacappa 2005 and Ott, O’Connor, & Dasgupta 2011 for recent reviews on this topic). Despite these uncertainties, several groups have developed theoretical models that parameterise the unknown physics, such as the degree of mixing between the stellar layers and the final kinetic energy of the explosion, in order to estimate the resulting nucleosynthetic yields. Here we consider two CCSNe model suites to compare to the measured abundance pattern of the candidate CEMP DLA: (1) the recent calculations for metal-free Population III stars in the mass range –M⊙ by Heger & Woosley (2010); and (2) the Population III/II/I calculations by Chieffi & Limongi (2004) for stars with masses in the range –M⊙.
The recent database of zero-metallicity nucleosynthesis calculations by Heger & Woosley (2010) contains a suite of models, with two parameters describing the physics of the explosion and one parameter describing the mixing. Although these calculations use a fine mass-resolution of M⊙, the model stars that differ in mass by just M⊙ often produce notable differences in the final nucleosynthetic yields. We have therefore opted to integrate the yields over a Gaussian-like initial mass function (IMF; two additional model parameters are used to define the centroid [MIMF] and width [] of the IMF). In this way, we hope to obtain an approximate handle on the mass range of the stars responsible for the DLA’s enrichment. Thus, the resulting parameter space contains combinations of the five adjustable parameters.
To determine the best-fitting model, we use the
star_fit software provided by
Heger & Woosley (2010).555star_fit is
available for download from
http://homepages.spa.umn.edu/alex/znuc/
The combination of parameters
which best fits the DLA element abundances
has an IMF
centred on MM⊙, with a width
of M
(details are summarised in Table 2).
This model has a relatively low degree
of mixing between the stellar layers
(approximated by a running boxcar filter with
a width equal to 2.5% of the total
He core mass), and a final kinetic energy
of the ejected material of
erg s-1.
For this IMF-weighted model,
the average star will eject M⊙ of Fe.
An Fe yield of just M⊙ is quite
low for such an explosion energy,
this occurs as a result of the low degree
of mixing between the stellar layers during
the explosion.
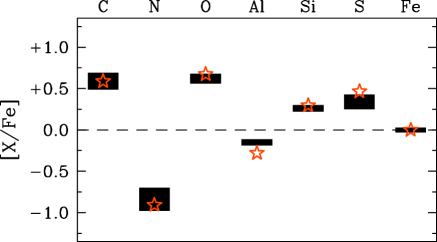
The abundance pattern generated with this model is shown in the left panel of Figure 4. Overall, there is good agreement between calculated and measured abundances, except possibly for Al which deviates by . However, the discrepancy is only 0.13 dex, which is small considering the likely uncertainties in the calculations of model yields.
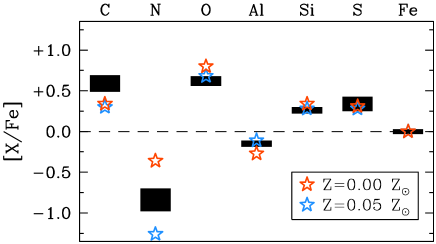
We next consider the nucleosynthesis calculations of Population III/II/I stars by Chieffi & Limongi (2004). This database contains a set of six stars of different mass, spanning a range of metallicity (a further six choices of metallicity are available, including: and ), and an effectively continuous range of ‘mass cut’, which is a parameterisation for the amount of material that escapes the binding energy of the star following the explosion; this leads to a model with only three free parameters. The model that comes closest to reproducing the chemical composition of our candidate CEMP DLA is for a M⊙ star with a metallicity of ejecting M⊙ of 56Ni (the default value considered by Chieffi & Limongi 2004 is M⊙ of 56Ni). A summary of the model details is presented in Table 2. In order to eject M⊙ of 56Ni, the kinetic energy of the ejecta for a M⊙ star would need to be an order of magnitude larger than a typical supernova, and will thus reside on the hypernova branch (see e.g. Figure 1 from Tominaga, Umeda, & Nomoto 2007).
The abundance pattern for this model is shown in the right panel of Figure 4 as the blue stars. Qualitatively, the match to the data is poorer than in the previous case, with both C and N appearing somewhat discrepant. However, we caution against reading too much into such a comparison: the abundances of C and N have the largest errors among the elements we observed and this model involves fewer free parameters. Statistically, the two models shown in Figure 4 are equally probable, if the (unknown) model uncertainties are comparable in the two cases.
To determine which of the two model suites provide a closer representation of the data we use the Bayes evidence ratio (otherwise known as the Bayes factor). This measure has the advantage of being able to directly compare two model suites with different physical prescriptions and a different number of free parameters. Using the Laplace approximation (see e.g. Mackay 2003, p. 341) and assuming flat priors, we measure the evidence ratio of the Chieffi & Limongi (2004) models relative to the Heger & Woosley (2010) models to be , confirming our earlier conclusion that it is difficult to discern between the two models.
In the right panel of Figure 4, we also show the best-fitting model from the recent Limongi & Chieffi (2012) metal-free nucleosynthesis calculations (orange stars). These new models were computed with the latest version of their stellar evolutionary code, and now include higher mass stars (with a total mass range of to ). The best-fitting model with this suite of calculations is for a metal-free star that ejects M⊙ of 56Ni. Although the model gives a somewhat better fit, we consider both models to be adequate representations of the data given the unknown model uncertainties.
We have not considered models of rotating low metallicity Population II (Meynet, Ekström, & Maeder, 2006; Hirschi, 2007) or Population III stars (Joggerst et al., 2010). These models tend to yield a large [N/Fe] abundance, something that we do not observe in the abundance pattern of this DLA. We also refrain from computing full-scale galactic chemical evolution models. Such an exercise was performed recently by Salvadori & Ferrara (2012) to infer the enrichment history of CEMP DLAs. These authors conclude that such DLAs are enriched by Population III stars, but may receive an additional contribution from AGB stars – which would increase both the C and N abundances (see e.g. Table 6 from Cristallo et al. 2011). Given the relatively low N abundance observed here, we suggest that the metal contribution from AGB stars for this system is minimal.
Thus, on the basis of the available data, it is not possible to distinguish statistically between the two possibilities considered here, enrichment solely by metal-free stars, or by stars of moderate metallicity, with (and of course it would be even more difficult to recognise a mixed scenario, involving more than one stellar generation). Looking ahead, there are two foreseeable avenues that may yield tighter constraints on the nature of the stars that enrich the most metal-poor DLAs:
(1) Improvements in the modelling of massive star nucleosynthesis and, in particular, a better description of the physics behind the explosion mechanism. Much progress is currently being made on the relevant theory (see e.g. Belczynski et al. 2011). Furthermore, future increases in computational power will allow the construction of large databases of finer-grid nucleosynthesis calculations. This may remove the ‘discreteness’ of the current models.
(2) Stronger discriminatory power between different models, particularly regarding the explosion energy, lies with the ratio of two Fe-peak elements (e.g. [Cr,Ni,Zn/Fe], Umeda & Nomoto 2002). In the most metal-poor DLAs, absorption lines from these less abundant elements are too weak to be detected with current observational facilities, but may be within the grasp of the next generation of 30-m class telescopes. This will open up new avenues to probe the details of the explosion. Furthermore, the greater light gathering power of these future facilities will make it feasible to observe the faint background quasars with the spectral resolution required to fully resolved the metal absorption lines of most DLAs, and thus decouple directly (rather than by indirect means as done here) the relative contributions to the line widths from thermal and turbulent broadening.
5.1 Identifying more CEMP DLAs
At present, the discriminatory power between Population II and Population III models rests with the [C/Fe] ratio. We should therefore compile a list of candidate systems, such as the one described here, that exhibit the following hallmark signatures: (1) an enhanced [C/Fe] ratio with relatively normal [N/Fe] (i.e. ). Current models of Population II nucleosynthesis have difficulty in reproducing these signatures. (2) an [O/Fe] ratio that is enhanced beyond the typical value observed for DLAs (; Cooke et al. 2011b); enhanced [C/Fe] is more likely to yield enhanced [O/Fe] as well (assuming the Population III nucleosynthesis calculations by Heger & Woosley 2010). Furthermore, there are several weak O i lines that are insensitive to the details of the cloud model and in particular to the balance between thermal and turbulent broadening. The more easily measured O/Fe ratio may therefore prove to be a reliable indicator of further examples of CEMP DLAs.
6 Summary and Conclusions
We have reported new observations,
at a higher spectral resolution than any
published previously,
of the very metal-poor damped Ly system at
towards the QSO
J13586522.
Our Keck HIRES spectrum covers 21 absorption
lines from ion stages of H, C, N, O, Al, Si, S, and Fe
which are dominant in neutral gas.
From the analysis of these data we
draw the following conclusions:
(i) The metallicity of the DLA, as measured by the Fe/H ratio, is of solar ([Fe/H] ). Both C and O appear to be enhanced by a factor of relative to Fe.
(ii) The gas is ‘cold’, in the sense that the profiles of the absorption lines are best reproduced by a model that has a low value of the Doppler parameter, km s-1, which furthermore appears to be dominated by turbulent, rather than thermal, motions.
(iii) We derived a upper limit on the DLA’s kinetic temperature of K. The thermal broadening that corresponds to this upper limit lowers the [C/Fe] ratio by 0.37 dex, but does not affect the [O/Fe] which is deduced from weak, unsaturated absorption lines.
(iv) Finally, we compared the abundance pattern for this candidate CEMP DLA to model nucleosynthesis calculations for Population I, II, and III stars. Given the handful of elements available and the present limitations of the models, we are unable to formally distinguish between models of Population II and Population III enrichment. Upcoming facilities will permit the abundances for several Fe-peak elements to be measured, providing additional diagnostics between these two possibilities.
CEMP DLAs might be more common than currently appreciated; the available C ii lines are almost always saturated, making it difficult to measure accurately the C abundance unless one can determine a secure cloud model from a careful analysis of the line profiles. Given the potential of CEMP DLAs for probing nucleosynthesis by Population III stars, a sample of the most promising candidates should now be compiled. With the next generation of 30-metre class telescopes, it should become feasible to record absorption lines from the intrinsically less abundant Fe-peak elements, and thereby explore in more detail than is possible at present the properties of the core-collapse supernova explosions of metal-free stars.
Acknowledgements
We are grateful to the staff astronomers at the Keck Observatory for their expert assistance with the observations. We also thank an anonymous referee who provided some comments on the manuscript. Valuable advice and help with various aspects of the work described in this paper was provided by Bob Carswell, and Sergey Koposov. We thank the Hawaiian people for the opportunity to observe from Mauna Kea; without their hospitality, this work would not have been possible. RC is supported by a Research Fellowship at Peterhouse College, Cambridge. MTM thanks the Australian Research Council for a QEII Research Fellowship (DP0877998).
References
- Aoki et al. (2007) Aoki W., Beers T. C., Christlieb N., Norris J. E., Ryan S. G., Tsangarides S., 2007, ApJ, 655, 492
- Asplund et al. (2009) Asplund M., Grevesse N., Sauval A. J., Scott P., 2009, ARA&A, 47, 481
- Becker et al. (2011) Becker G. D., Sargent W. L. W., Rauch M., Calverley A. P., 2011, arXiv, arXiv:1101.4399
- Beers & Christlieb (2005) Beers T. C., Christlieb N., 2005, ARA&A, 43, 531
- Belczynski et al. (2011) Belczynski K., Wiktorowicz G., Fryer C., Holz D., Kalogera V., 2011, arXiv:1110.1635
- Carswell et al. (2011) Carswell, R. F., Jorgenson, R. A., Wolfe, A. M., & Murphy, M. T. 2011, MNRAS, 411, 2319
- Carswell et al. (2012) Carswell R. F., Becker G. D., Jorgenson R. A., Murphy M. T., Wolfe A. M., 2012, MNRAS, submitted
- Chieffi & Limongi (2004) Chieffi A., Limongi M., 2004, ApJ, 608, 405
- Cooke et al. (2011a) Cooke R., Pettini M., Steidel C. C., Rudie G. C., Jorgenson R. A., 2011a, MNRAS, 412, 1047
- Cooke et al. (2011b) Cooke R., Pettini M., Steidel C. C., Rudie G. C., Nissen P. E., 2011b, MNRAS, 417, 1534
- Cooke (2011c) Cooke R., 2011c, PhD Thesis, University of Cambridge.
- Cristallo et al. (2011) Cristallo S., et al., 2011, ApJS, 197, 17
- Ellison et al. (2012) Ellison, S. L., Kanekar, N., Prochaska, J. X., Momjian, E., & Worseck, G. 2012, MNRAS, in press (arXiv:1205.1200).
- Erni et al. (2006) Erni P., Richter P., Ledoux C., Petitjean P., 2006, A&A, 451, 19
- Heger & Woosley (2010) Heger A., Woosley S. E., 2010, ApJ, 724, 341
- Hirschi (2007) Hirschi R., 2007, A&A, 461, 571
- Joggerst et al. (2010) Joggerst C. C., Almgren A., Bell J., Heger A., Whalen D., Woosley S. E., 2010, ApJ, 709, 11
- Jorgenson et al. (2009) Jorgenson, R. A., Wolfe, A. M., Prochaska, J. X., & Carswell, R. F. 2009, ApJ, 704, 247
- Kanekar et al. (2009) Kanekar N., Smette A., Briggs F. H., Chengalur J. N., 2009, ApJ, 705, L40
- Kobayashi, Tominaga, & Nomoto (2011) Kobayashi C., Tominaga N., Nomoto K., 2011, ApJ, 730, L14
- Lampton, Margon, & Bowyer (1976) Lampton M., Margon B., Bowyer S., 1976, ApJ, 208, 177
- Limongi & Chieffi (2012) Limongi M., Chieffi A., 2012, arXiv, arXiv:1202.4581
- Liszt (2001) Liszt H., 2001, A&A, 371, 698
- Lucatello et al. (2005) Lucatello S., Tsangarides S., Beers T. C., Carretta E., Gratton R. G., Ryan S. G., 2005, ApJ, 625, 825
- Mackay (2003) Mackay D. J. C., 2003, Information Theory, Inference, and Learning Algorithms. Cambridge Univ. Press, Cambridge
- Meynet, Ekström, & Maeder (2006) Meynet G., Ekström S., Maeder A., 2006, A&A, 447, 623
- Mezzacappa (2005) Mezzacappa A., 2005, ARNPS, 55, 467
- O’Meara et al. (2001) O’Meara J. M., Tytler D., Kirkman D., Suzuki N., Prochaska J. X., Lubin D., Wolfe A. M., 2001, ApJ, 552, 718
- O’Meara et al. (2006) O’Meara, J. M., Burles, S., Prochaska, J. X., et al. 2006, ApJ, 649, L61
- Ott, O’Connor, & Dasgupta (2011) Ott C. D., O’Connor E. P., Dasgupta B., 2011, arXiv:1111.6282
- Penprase et al. (2010) Penprase B. E., Prochaska J. X., Sargent W. L. W., Toro-Martinez I., Beeler D. J., 2010, ApJ, 721, 1
- Petitjean, Srianand, & Ledoux (2000) Petitjean P., Srianand R., Ledoux C., 2000, A&A, 364, L26
- Pettini (2004) Pettini M., 2004, in Esteban C., Herrero A., Garcia-Lopez R., Sanchez F., eds, Cosmochemistry: The Melting Pot of Elements. Cambridge Univ. Press, Cambridge, p. 257
- Pettini & Bowen (2001) Pettini M., Bowen D. V., 2001, ApJ, 560, 41
- Pettini et al. (2008a) Pettini M., Zych B. J., Steidel C. C., Chaffee F. H., 2008a, MNRAS, 385, 2011
- Pettini et al. (2008b) Pettini, M., Zych, B. J., Murphy, M. T., Lewis, A., & Steidel, C. C. 2008b, MNRAS , 391, 1499
- Ryan et al. (2005) Ryan S. G., Aoki W., Norris J. E., Beers T. C., 2005, ApJ, 635, 349
- Salvadori & Ferrara (2012) Salvadori S., Ferrara A., 2012, MNRAS, 421, L29
- Srianand et al. (2012) Srianand R., Gupta N., Petitjean P., Noterdaeme P., Ledoux C., Salter C. J., Saikia D. J., 2012, MNRAS, 421, 651
- Tominaga, Umeda, & Nomoto (2007) Tominaga N., Umeda H., Nomoto K., 2007, ApJ, 660, 516
- Tumlinson et al. (2010) Tumlinson J., et al., 2010, ApJ, 718, L156
- Umeda & Nomoto (2002) Umeda H., Nomoto K., 2002, ApJ, 565, 385
- Umeda & Nomoto (2003) Umeda H., Nomoto K., 2003, Nature, 422, 871
- Vogt et al. (1994) Vogt S. S., et al., 1994, SPIE, 2198, 362
- Wolfe et al. (2005) Wolfe, A. M., Gawiser, E., & Prochaska, J. X. 2005, ARA&A, 43, 861