Galactic structure based on the ATLASGAL 870 m survey
Abstract
The ATLASGAL 870 m continuum survey conducted with the APEX telescope is the first survey covering the whole inner Galactic plane ( & ) in submm continuum emission tracing the cold dust of dense and young star-forming regions. Here, we present the overall distribution of sources within our Galactic disk. The submm continuum emission is confined to a narrow range around the galactic plane, but shifted on average by 0.07 deg below the plane. Source number counts show strong enhancements toward the Galactic center, the spiral arms and toward prominent star-forming regions. Comparing the distribution of ATLASGAL dust continuum emission to that of young intermediate- to high-mass young stellar objects (YSOs) derived from Spitzer data, we find similarities as well as differences. In particular, the distribution of submm dust continuum emission is significantly more confined to the plane than the YSO distribution (FWHM of 0.7 and 1.1 deg, corresponding to mean physical scale heights of approximately 46 and 80 pc, respectively). While this difference may partly be caused by the large extinction from the dense submm cores, gradual dispersal of stellar distributions after their birth could also contribute to this effect. Compared to other tracers of Galactic structure, the ATLASGAL data are strongly confined to a narrow latitude strip around the Galactic plane.
Subject headings:
Stars: formation — Galaxy: structure — dust, extinction — stars: pre-main sequence — ISM: clouds1. Introduction
Since the location of our solar system is within the Galactic disk, studying the Galactic structure of our Milky Way is always a challenging problem. Therefore, we cannot derive such comprehensive and intuitive pictures of our disk as extragalactic studies are able to do for other spiral galaxies (e.g., Kennicutt et al. 2003; Nieten et al. 2006; Walter et al. 2008). Nevertheless, based on a diverse set of studies over all wavelengths, in the last few decades we have derived a reasonably comprehensive picture of our Galactic spiral structure (for recent work, see, e.g., Benjamin 2008; Reid et al. 2009). The Galactic plane has been observed in the optical/near-/mid-infrared bands (e.g., Dobashi et al. 2005; Skrutskie et al. 2006; Churchwell et al. 2009; Carey et al. 2009) as well as at longer wavelengths, e.g., in CO or cm continuum emission (e.g., Dame et al. 2001; Stil et al. 2006). However, until the arrival of the two (sub)mm Galactic plane surveys ATLASGAL (The APEX Telescope Large Area Survey of the GALaxy at 870 m) and BGPS (Bolocam Galactic Plane Survey) (Schuller et al., 2009; Aguirre et al., 2011), no survey at (sub)mm wavelengths existed that trace the cold dust emission stemming from dense and young star-forming regions at adequate spatial resolution (the COBE (Cosmic Background Explorer) and WMAP (Wilkinson Microwave Anisotropy Probe) data have too coarse resolution to isolate individual star-forming regions). Here, we employ the 870 m submm continuum survey ATLASGAL to study the general distribution of the dense dust and gas within our Galactic plane.
2. Observations and source extraction
The 870 m data are taken from the APEX Telescope Large Area Survey of the Galaxy (ATLASGAL, Schuller et al. 2009). The rms of the data is 50 mJy beam-1 and the FWHM . Using the clumpfind source identification algorithm by Williams et al. (1994) with a threshold of 300 mJy beam-1, we identified 16336 clumps within the Galactic plane for longitudes and latitudes . In the context of this paper, we are not aiming for exact fluxes, column densities or masses, but we just want to evaluate source number counts within the Galactic plane. Therefore, the specific clump identification algorithm or the used thresholds are not of great importance. To test this, we also derived corresponding source catalogs using or thresholds. While the absolute number of sources obviously varies significantly with changed thresholds, the structural results presented below are not significantly affected by that. As an additional test, instead of deriving clumps, we just extracted the total submm fluxes above the threshold in the given latitude and longitude bins. Again the structural distributions in longitude and latitude are very similar. Since other Galactic plane surveys usually also work on source counts (e.g., GLIMPSE (Galactic Legacy Infrared Midplane Extraordinaire) or MSX (Midcourse Space Experiment); Churchwell et al. 2009; Robitaille et al. 2008; Egan et al. 2003), for the remainder of the paper we adopt the source catalog. The clump masses range between 100 and a few 1000 M⊙, and these clumps form clusters with certain star formation efficiencies. Therefore, the ATLASGAL data largely trace gas/dust clumps capable of forming intermediate- to high-mass stars at distances between several 100 out to more than 10000 pc (Schuller et al. 2009; Tackenberg et al. subm.).
Tackenberg et al. (subm.) analyzed the ATLASGAL data in the longitude range between 10 and 20 deg in depth via correlating them with the GLIMPSE and MIPSGAL (MIPS Galactic Plane Survey) near- to mid-infrared surveys of the Galactic plane (Churchwell et al., 2009; Carey et al., 2009), and at long wavelength with the NH3 spectral line data from Wienen et al. (subm.). Out of 210 starless clump candidates, Tackenberg et al could extract NH3 spectral information – and by that kinematic distances – for 150 sources. To resolve the kinematic distance ambiguity, these targets were compared to the GLIMPSE and MIPSGAL images. Clumps associated with GLIMPSE/MIPSGAL shadows were assigned the near distance, and the other clumps were assigned as far. This way, 115 clumps are likely on the near side of the Galaxy and 35 on the far side. Tackenberg et al. find that the mean distances of starless clumps in the longitude range between 10 and 20 deg on the near and far side of the Galaxy are 3.1 and 13.8 kpc, respectively. One should keep in mind that the rotation curve of the inner Galaxy is far from circular (e.g., Reid et al. 2009), making the absolute determination of kinematic distances a difficult task.
For comparison with somewhat more evolved evolutionary stages, namely young stellar objects (YSOs), we resort to the Spitzer red source catalog (with a color criterion of 1, for more details see Robitaille et al. 2008). While the intrinsically red sources are contaminated by approximately 30% AGB stars, Robitaille et al. (2008) extracted statistically these AGB stars and provided a YSO catalog with reduced AGB contamination. This YSO catalog contains 11649 sources again over the Galactic longitude range . Because deriving distances and masses for individual YSOs is difficult, Robitaille & Whitney (2010) conducted a population synthesis analysis of the sample. They find that their detected sources consist mainly of intermediate- to high-mass stars (between 3 and 25 M⊙) at distances of several kpc. Again dividing their sources in near and far sources with respect to the Galactic center and Galactic bar, they as well find mean distances in the longitude range between 10 and 20 deg of 4.9 and 13.1 kpc, respectively.
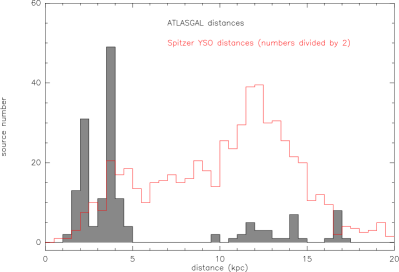
Figure 1 presents a histogram of the kinematic distances in the Galactic longitude range between 10 and 20 deg derived for the ATLASGAL sample (Tackenberg et al. subm.) and population synthesis distances for the GLIMPSE sources (Robitaille & Whitney, 2010), respectively. Clearly, both distributions show a near and far distance peak (see also Fig. 9 in Dunham et al. 2011). For the ATLASGAL sources, the far peak has less sources because, at the given spatial resolution of , close clumps that would be spatially resolved at the near distance merge and appear as one clump at the far side of the Galaxy (Tackenberg et al. subm.). To be more precise, Tackenberg et al. (subm.) simulated the distance smoothing effect for the ATLASGAL data, and they found that an artificial sample of 328 clumps at 3 kpc distance would appear as only 20 clumps when put to 15 kpc distance (see also the corresponding discussion in Dunham et al. 2011). This effect is far less severe for the much better resolved GLIMPSE sources. Additionally, GLIMPSE sources easier saturate at the near side of the Galaxy. Combining these effects with the larger observed volume at the far side of the Galaxy, more sources are found at the far side for that sample. Although the near peaks of the ATLASGAL and GLIMPSE samples are shifted with respect to each other a little bit, taking into account the inherent uncertainties of kinematic distances for the ATLASGAL sample and population synthesis for the YSO sample (1 kpc each), the two source types cover comparable distance ranges. Another difference between the two samples is that ATLASGAL barely detects any sources between 5 and 10 kpc whereas the GLIMPSE distribution shows sources there. The latter is due to the model used for the population synthesis with an axisymmetric ring around the center of the Galaxy (see Fig. 2 in Robitaille & Whitney 2010). The non-detection of ATLASGAL sources in that distance regime is likely attributed to the large extend of the Galactic bar (see also Fig. 3) which is not taken into account in Galactic rotation models to derive the kinematic distances (e.g., Reid et al. 2009).
While the ATLASGAL clumps are in absolute terms more massive than the GLIMPSE YSOs, considering typical star formation rates and an initial mass function for each cluster-forming region, the ATLASGAL clumps form intermediate- to high-mass stars in the mass range of the GLIMPSE YSOs.
In combination, the two samples are well suited for comparison of the different evolutionary populations. In addition to this, since the Galactic longitude range between 10 and 20 represents a fraction of the Galactic plane that covers near and far spiral arms, we consider it to first order as representative to extrapolate the distance similarities for both samples also for the rest of the surveys. Additional similarities and differences will be discussed in section 4.2.
3. Results
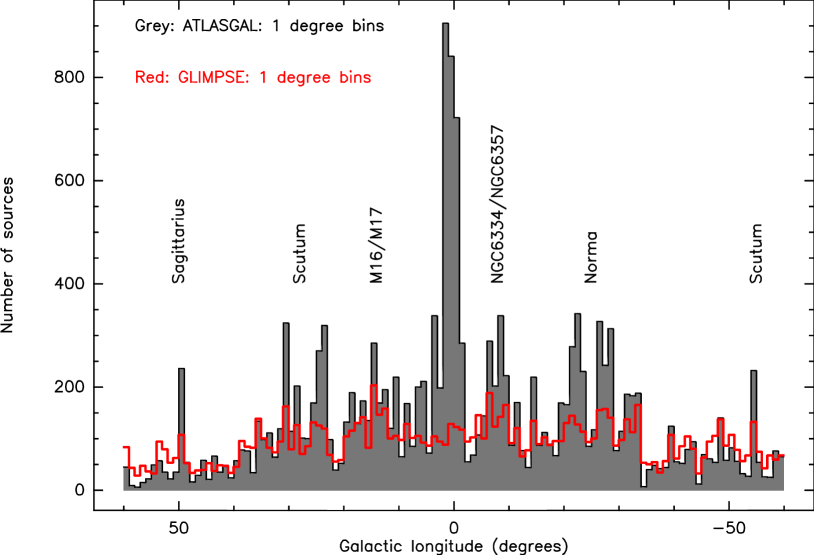
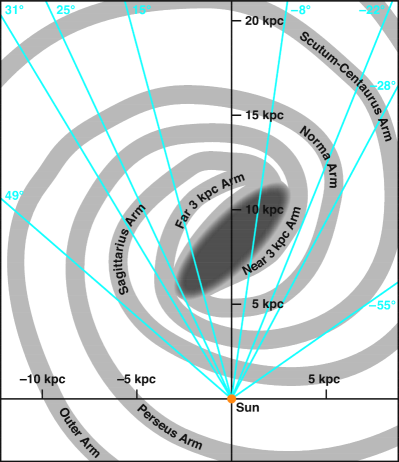
Figure 2 presents the longitude distribution of the submm continuum and YSO sources within our Galactic plane (see Schuller et al. (2009) for a first version of such a plot based on a far smaller initial dataset). While the YSO distribution based on the Spitzer data is relatively flat, the submm continuum emission shows a series of distinctive peaks. The most prominent one is toward the Galactic center where the source count increases approximately by a factor of 4. In addition to this, there are a few more clear submm source count peaks at positive and negative longitudes. They can mainly be attributed to tangential points of spiral arms (for a discussion of older COBE 240 m data, see Drimmel 2000) as well as to a few prominent star formation complexes in the nearby Sagittarius arm. The most important of these are marked in Figure 2. For comparison, a sketch of our Galaxy as it would be viewed face-on is shown in Fig. 3 where several lines of sight are marked corresponding to increased number counts in Fig. 2. For longitudes deg, a similar distribution was found in the BGPS survey (Rosolowsky et al., 2010). The implications suggested by this result will be discussed further in section 4.
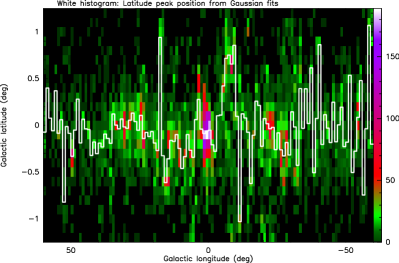
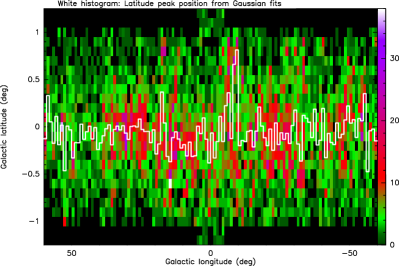
Another way to represent the 870 m source distribution is in a 2-dimensional binning in Galactic longitude and latitude (Fig. 4 top panel). In addition to an increase in source counts toward specific Galactic longitudes, we also identify a tight confinement to the Galactic mid-plane with only a narrow spread north and south of the mid-plane. To derive the approximate latitude for which the submm emission peaks in each longitude bin, we fitted Gaussians to their latitude distribution in each longitude bin. The Gaussian fit peak positions are marked in Fig. 4 (top panel). These fits indicate that the dominant dust and gas distribution is slightly shifted to negative Galactic latitudes with a mean offset over the whole plane of deg (the mean values are derived from Gaussian fits to 10 deg longitude bins, see below).
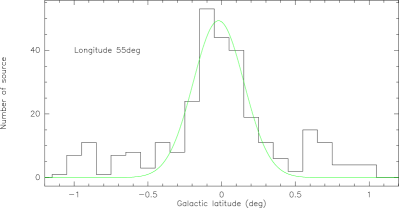
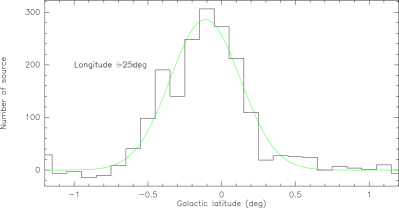
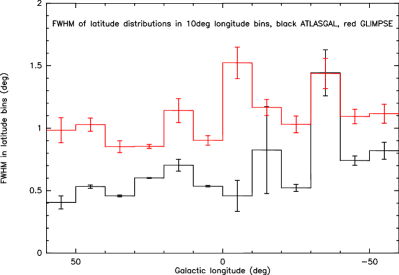
We can produce the same plot for the YSO distribution derived from the Spitzer data (Fig. 4 bottom panel). Similarly, the mean value of the peaks of the YSO distribution is also shifted below the Galactic mid-plane, again at deg (the mean values are also derived from Gaussian fits to 10 deg longitude bins). Already a visual inspection of the two distributions indicates that the YSOs appear to cover a broader range in Galactic latitude than the dust and gas clumps traced by the submm continuum emission. Fitting Gaussians to the latitude distributions in each longitude bin for the submm clumps as well as the YSOs allows us to better quantify this effect. Since the latitude distributions are not as smooth on the scales of individual degrees in Galactic longitude, we average over 10 deg in longitude for smoothing purposes. Figure 5 presents Gaussian example fits at different Galactic longitudes outlining the applicability of the Gaussian assumption to these distributions. The corresponding Gaussian full width half maximum (FWHM) for the two distributions are shown in Figure 6. One clearly sees that the YSO distributions is broader over the whole Galactic plane than the dense gas and dust distribution. Below Galactic longitudes of -30 deg, the ATLASGAL distribution shows a tendency of increased FWHM. However, this effect is confined to only three bins, one with a particularly large error-bar. Therefore, in the context of this paper we refrain from further interpretation. The mean values of the FWHM for the dust continuum and YSO distributions are 0.67 and 1.09 deg, respectively. This corresponds to characteristic scale heights (distance where distribution has dropped to 1/e, 0.6FWHM) of 0.4 and 0.7 deg for the submm continuum and YSO distributions, respectively. Robitaille & Whitney (2010) fitted their source distribution with a mean physical scale height of 80 pc. Since we have no explicit distances for individual ATLASGAL sources over the whole range of the Galactic plane, deriving directly a physical scale height from our data alone is hardly feasible. However, because the distance and mass regimes of the ATLASGAL sources and the YSOs are similar (see section 2), we can use the linear scale height of the YSOs to derive a first-order estimate of the linear scale height for the ATLASGAL clumps (see section 4.2 for additional discussion). With the measured FWHMs of the YSOs and the ATLASGAL sources, and using the modeled 80 pc mean physical scale height of the YSOs, we estimate, proportionally, an approximate physical scale height of the submm dust continuum emission of 46 pc. Since the distribution of near and far sources favors near sources for ATLASGAL and far sources for GLIMPSE (see Fig. 1), the 46 pc should be considered as an upper limit.
Another estimate of the ATLASGAL scale height can be derived from the sample discussed in section 2 for the Galactic longitude range between 10 and 20 deg (Tackenberg et al. subm). Using only the near kinematic distance sample (the far distance sample has too low number statistics), we find a FWHM and scale height of 23 and 14 pc, respectively. This is considerably lower than the estimate of 46 pc derived above. The most important reason for this difference is based on the way near and far distance sources are separated in the study by Tackenberg et al. (subm.): While the kinematic distances always give near and far solutions at this and the other side of the Galaxy, the near solution was favored for infrared dark clouds if absorption shadows were detected in the Spitzer mid-infrared data (e.g., Peretto & Fuller 2009). However, at high Galactic latitudes the infrared background is significantly reduced and by default it is more difficult to identify infrared dark clouds. Therefore, from a statistical point of view, at high latitude, clumps are potentially shifted to the far distance. This implies that the derived scale height of 14 pc from this sample has to be considered as a lower limit.
4. Discussion
4.1. Longitude distribution
To first order, it appears surprising that the cold dust clump distribution and the YSO distribution do not resemble each other more closely. While the submm continuum emission is optically thin and should therefore trace almost all cold dust along each line of sight, the YSO distribution is more strongly affected by extinction. It may well be that a considerable fraction of YSOs are not identified because of too high extinction. Regarding the different properties of the ATLASGAL clumps and YSOs toward the Galactic center (Fig. 2), a similar emission increase toward the Galactic center was recently also found in the dense gas emission of NH3 (the HOPS survey, e.g., Walsh et al. 2011, Purcell et al. subm., Longmore et al. in prep.). The lack of a prominent peak toward the Galactic center in the GLIMPSE YSO data may be partly an observational bias but also partly a real physical effect. Observationally, the extinction toward the Galactic center increases which increases the GLIMPSE detection threshold. However, in contrast to that, also surveys of Hii regions, tracing more evolved high-mass star-forming regions, as well as H2O and CH3OH maser surveys exhibit no strong emission peaks toward the Galactic center (e.g., Wilson et al. 1970; Lockman 1979; Bronfman et al. 2000; Anderson et al. 2011; Walsh et al. 2011; Green et al. 2011). Does that imply a relatively low gas-to-star conversion in that specific part of our Galaxy? For a more detailed discussion, see Longmore et al. in prep..
Simon et al. (2006) presented a similar plot to our Fig. 2 for the distribution of IRDCs in the Galactic plane. While the general features for the IRDCs appear similar to the dust continuum distribution, the spiral arm and star-forming regions are less pronounced. Anderson et al. (2011) performed a similar study of the Hii region distribution of the Galactic plane accessible to the northern hemisphere, whose results are noticeably different to what we find. The Hii region distribution does not exhibit a peak toward the Galactic center region, but a clear peak is found at approximately +30 deg, corresponding to our peak for the Scutum arm. Previous Hii region surveys show a similar Hii number increase at negative longitudes around -30 deg (Wilson et al., 1970; Lockman, 1979; Bronfman et al., 2000).
Recently, Green et al. (2011) report on the CH3OH maser distribution in the Galactic plane between longitude deg. Among other source count peaks, in particular they report an increased detection rates at longitudes around and deg, very similar to what we find. While the peaks at and deg are likely associated with the end of the long Galactic bar and the beginning of the Scutum-Centaurus spiral arm, the deg peak should be associated with a tangent point of the 3 kpc arm (Fig. 3). In summary, the submm continuum emission is an excellent tracer of the Galactic dense gas structure, even in our Milky Way where our location within the plane complicates the picture so severely.
4.2. Latitude distribution
The finding that the average peak of the Gaussian latitude distribution is below the Galactic plane has already been inferred by other groups, e.g., for (sub)mm continuum emission (Schuller et al., 2009; Rosolowsky et al., 2010), in the infrared (Churchwell et al., 2006, 2007; Robitaille & Whitney, 2010), for CO emission (Cohen & Thaddeus, 1977), clusters (Mercer et al., 2005), Hii regions (Lockman, 1979; Bronfman et al., 2000) or infrared bubbles (Kendrew priv. comm., Simpson et al. in prep.). Even the Galactic center itself is located at 0.05 deg below the Galactic plane (Reid & Brunthaler, 2004). While a common interpretation of that effect is based on a poor definition of the Galactic plane where neither the sun nor the Galactic center itself are located directly in the plane at 0 deg latitude (e.g., Humphreys & Larsen 1995; Joshi 2007; Schuller et al. 2009), Rosolowsky et al. (2010) recently suggested that this effect may also simply be caused by individual star formation complexes and not so much reflect a global Galactic property. However, they state that the offset is mainly a feature of the molecular interstellar medium, whereas different studies of the GLIMPSE survey indicate that the stellar component shows the same effect (e.g., Mercer et al. 2005; Churchwell et al. 2006, this study). Although we cannot conclusively differentiate these scenarios, the data here are indicative of a real global offset of the Galactic midplane from its conventional position where the axis between the sun and the Galactic center are located at deg.
Are the different Galactic latitude distributions of the submm clumps and the YSOs a real physical effect or could they be caused by observational biases? As outlined in section 2, the mass distributions and the distances on the near and far side of the Galaxy of the two samples are similar. One may now ask whether the number of near sources were larger for the YSOs than for the submm clumps. However, there are several effects that counteract this: At the relatively coarse spatial resolution of ATLASGAL (), clumps that would be separate entities on the near side of the Galaxy merge into single objects on the far side, and the total number of sources on the far side is lower than that on the near side (Tackenberg et al. subm.). In contrast to that, at the higher spatial resolution of Spitzer (), most sources remain point sources independent of the distance, and therefore less suffer from the “merging-problem”. Furthermore, the observed volume at the far side of our Galaxy is larger than that on the near side, and GLIMPSE sources on the near side more easily saturate. These combined effects even cause a YSO number increase on the far side compared to the near side of our Galaxy (Fig. 1, Robitaille & Whitney 2010). Therefore, the mass and distance distributions of the submm clumps and YSOs are unlikely to be the cause for the difference in the latitude distribution. Furthermore, Robitaille et al. (2008) statistically excluded the AGB star population from their catalogue, which implies that contamination by post-main-sequence sources is not responsible for the difference in latitude distribution as well. Similar to the effect seen for the longitude distribution discussed in the previous section (§4.1), extinction may cause part of the broader latitude distribution because toward the highest extinction regions, that are traced by the submm continuum emission, infrared emission is hardly detectable and hence the most deeply embedded YSO population is likely to be missed by the Spitzer data or the selection criteria in Robitaille et al. (2008). Herschel longer-wavelength data may identify such embedded population better (e.g., Hennemann et al. 2010; Henning et al. 2010; Beuther et al. 2010).
Walsh et al. (2011) recently reported a Galactic average scale height for H2O masers of approximately 0.4 deg, earlier finding a scale height for the CH3OH class II masers in a similar range (Walsh et al., 1997). Assuming a comparable distance distribution for the maser as well as the submm continuum sources, the mean physical scale-height of the masers should also be 46 pc. For ultracompact Hii regions, Wood & Churchwell (1989) found a scale height of 0.6 deg, intermediate between our values for the submm clumps and the YSOs. Later, Becker et al. (1994) reported a smaller mean physical scale-height for ultracompact Hii regions of 30 pc (about 40% of the Wood & Churchwell 1989 value), claiming that the Wood & Churchwell (1989) sample is biased by its large fraction of B-stars. Similar mean physical scale heights for high-mass star-forming regions of 44 pc and 29 pc were reported by Bronfman et al. (2000) and Urquhart et al. (2011). Hence masers as typical tracers of star-forming regions (a fraction of the H2O masers may also stem from AGB stars), dust continuum emission as a tracer of the dense gas, and young high-mass stars exhibit similar scale height distributions in the Milky Way. In comparison, Bronfman et al. (1988) find an approximate scale height of 70 pc for CO (rescaled to a galactocentric solar distance of 8.5 kpc), and Dame & Thaddeus (1994) derive a values of 120 pc for the thick CO disk (which is an average of their 3 cited values). The reported cold HI scale height is around 150 pc (Kalberla & Kerp, 1998; Kalberla, 2003; Dedes et al., 2005). Therefore, while tracers of the youngest evolutionary stages of star formation (submm continuum emission and masers) are all found closest to the Galactic plane, more evolved evolutionary stages like YSOs as well as the less dense atomic and molecular gas appear to be located on average slightly further from the plane.
Using the estimated mean physical scale heights for the dust continuum and YSO distributions of 46 and 80 pc, respectively, we can calculate approximate velocities required to move the 30 pc difference in the given YSO lifetimes of 1–2 Myrs. This estimate results in required YSO velocities between 15 and 30 km s-1. While velocities of that order are found (e.g., PV Cephei, Goodman & Arce 2004), they are apparently not the rule. Therefore, we propose that the most likely explanation for the spread in scale height for different populations appears to be a combination of extinction effects and dissolving young clusters from their natal birth sites.
5. Conclusions
We present a study of the Galactic distribution of submm dust continuum emission from the northern and southern hemisphere. The submm continuum emission, which traces the dense gas emission from star-forming regions, excellently traces the structure within our Galaxy. Spiral arms and prominent structures of star formation are easily distinguished by significantly increased source counts toward these Galactic longitudes. The Galactic latitude distribution is skewed slightly below the Galactic plane, and the mean physical scale height is estimated to 46 pc. This scale height corresponds well to other star-formation tracers like CH3OH and H2O maser emission, and it is more confined to the Galactic plane than most of the other populations in our Galaxy. We compare the submm continuum emission with several other tracers of Galactic structure, in particular with the YSO population identified by Spitzer observations. The YSO population has a significantly larger scale height, and we propose that this may be attributed to a combined effect of extinction and dissolving of protostellar clusters after their birth.
References
- Aguirre et al. (2011) Aguirre, J. E., Ginsburg, A. G., Dunham, M. K., et al. 2011, ApJS, 192, 4
- Anderson et al. (2011) Anderson, L. D., Bania, T. M., Balser, D. S., & Rood, R. T. 2011, ApJS, 194, 32
- Becker et al. (1994) Becker, R. H., White, R. L., Helfand, D. J., & Zoonematkermani, S. 1994, ApJS, 91, 347
- Benjamin (2008) Benjamin, R. A. 2008, in Astronomical Society of the Pacific Conference Series, Vol. 387, Massive Star Formation: Observations Confront Theory, ed. H. Beuther, H. Linz, & T. Henning, 375
- Beuther et al. (2010) Beuther, H., Henning, T., Linz, H., et al. 2010, A&A, 518, L78
- Bronfman et al. (2000) Bronfman, L., Casassus, S., May, J., & Nyman, L.-Å. 2000, A&A, 358, 521
- Bronfman et al. (1988) Bronfman, L., Cohen, R. S., Alvarez, H., May, J., & Thaddeus, P. 1988, ApJ, 324, 248
- Carey et al. (2009) Carey, S. J., Noriega-Crespo, A., Mizuno, D. R., et al. 2009, PASP, 121, 76
- Churchwell et al. (2009) Churchwell, E., Babler, B. L., Meade, M. R., et al. 2009, PASP, 121, 213
- Churchwell et al. (2006) Churchwell, E., Povich, M. S., Allen, D., et al. 2006, ApJ, 649, 759
- Churchwell et al. (2007) Churchwell, E., Watson, D. F., Povich, M. S., et al. 2007, ApJ, 670, 428
- Cohen & Thaddeus (1977) Cohen, R. S. & Thaddeus, P. 1977, ApJ, 217, L155
- Dame et al. (2001) Dame, T. M., Hartmann, D., & Thaddeus, P. 2001, ApJ, 547, 792
- Dame & Thaddeus (1994) Dame, T. M. & Thaddeus, P. 1994, ApJ, 436, L173
- Dedes et al. (2005) Dedes, L., Kalberla, P. M. W., Arnal, E. M., et al. 2005, in Astronomical Society of the Pacific Conference Series, Vol. 331, Extra-Planar Gas, ed. R. Braun, 75
- Dobashi et al. (2005) Dobashi, K., Uehara, H., Kandori, R., et al. 2005, PASJ, 57, 1
- Drimmel (2000) Drimmel, R. 2000, A&A, 358, L13
- Dunham et al. (2011) Dunham, M. K., Rosolowsky, E., Evans, II, N. J., Cyganowski, C., & Urquhart, J. S. 2011, ApJ, 741, 110
- Egan et al. (2003) Egan, M. P., Price, S. D., Kraemer, K. E., et al. 2003, VizieR Online Data Catalog, 5114, 0
- Goodman & Arce (2004) Goodman, A. A. & Arce, H. G. 2004, ApJ, 608, 831
- Green et al. (2011) Green, J. A., Caswell, J. L., McClure-Griffiths, N. M., et al. 2011, ApJ, 733, 27
- Hennemann et al. (2010) Hennemann, M., Motte, F., Bontemps, S., et al. 2010, A&A, 518, L84
- Henning et al. (2010) Henning, T., Linz, H., Krause, O., et al. 2010, A&A, 518, L95
- Humphreys & Larsen (1995) Humphreys, R. M. & Larsen, J. A. 1995, AJ, 110, 2183
- Joshi (2007) Joshi, Y. C. 2007, MNRAS, 378, 768
- Kalberla (2003) Kalberla, P. M. W. 2003, ApJ, 588, 805
- Kalberla & Kerp (1998) Kalberla, P. M. W. & Kerp, J. 1998, A&A, 339, 745
- Kennicutt et al. (2003) Kennicutt, Jr., R. C., Armus, L., Bendo, G., et al. 2003, PASP, 115, 928
- Lockman (1979) Lockman, F. J. 1979, ApJ, 232, 761
- Mercer et al. (2005) Mercer, E. P., Clemens, D. P., Meade, M. R., et al. 2005, ApJ, 635, 560
- Nieten et al. (2006) Nieten, C., Neininger, N., Guélin, M., et al. 2006, A&A, 453, 459
- Peretto & Fuller (2009) Peretto, N. & Fuller, G. A. 2009, A&A, 505, 405
- Reid & Brunthaler (2004) Reid, M. J. & Brunthaler, A. 2004, ApJ, 616, 872
- Reid et al. (2009) Reid, M. J., Menten, K. M., Zheng, X. W., et al. 2009, ApJ, 700, 137
- Robitaille et al. (2008) Robitaille, T. P., Meade, M. R., Babler, B. L., et al. 2008, AJ, 136, 2413
- Robitaille & Whitney (2010) Robitaille, T. P. & Whitney, B. A. 2010, ApJ, 710, L11
- Rosolowsky et al. (2010) Rosolowsky, E., Dunham, M. K., Ginsburg, A., et al. 2010, ApJS, 188, 123
- Schuller et al. (2009) Schuller, F., Menten, K. M., Contreras, Y., et al. 2009, A&A, 504, 415
- Simon et al. (2006) Simon, R., Jackson, J. M., Rathborne, J. M., & Chambers, E. T. 2006, ApJ, 639, 227
- Skrutskie et al. (2006) Skrutskie, M. F., Cutri, R. M., Stiening, R., et al. 2006, AJ, 131, 1163
- Stil et al. (2006) Stil, J. M., Taylor, A. R., Dickey, J. M., et al. 2006, AJ, 132, 1158
- Urquhart et al. (2011) Urquhart, J. S., Moore, T. J. T., Hoare, M. G., et al. 2011, MNRAS, 410, 1237
- Walsh et al. (2011) Walsh, A. J., Breen, S. L., Britton, T., et al. 2011, MNRAS, 416, 1764
- Walsh et al. (1997) Walsh, A. J., Hyland, A. R., Robinson, G., & Burton, M. G. 1997, MNRAS, 291, 261
- Walter et al. (2008) Walter, F., Brinks, E., de Blok, W. J. G., et al. 2008, AJ, 136, 2563
- Williams et al. (1994) Williams, J. P., de Geus, E. J., & Blitz, L. 1994, ApJ, 428, 693
- Wilson et al. (1970) Wilson, T. L., Mezger, P. G., Gardner, F. F., & Milne, D. K. 1970, A&A, 6, 364
- Wood & Churchwell (1989) Wood, D. O. S. & Churchwell, E. 1989, ApJ, 340, 265