2 INAF/IASF–Roma, Via del Fosso del Cavaliere 100, I-00133 Roma, Italy
3 CIFS–Torino, Viale Settimio Severo 3, I-10133, Torino, Italy
4 INAF/IASF–Milano, Via E. Bassini 15, I-20133 Milano, Italy
5 Dip. di Fisica, Univ. “Tor Vergata”, Via della Ricerca Scientifica 1, I-00133 Roma, Italy
6 Dip. di Fisica and INFN Trieste, Via Valerio 2, I-34127 Trieste, Italy
7 ENEA–Bologna, Via Biancafarina 2521, I-40059 Medicica (BO), Italy
8 INFN–Roma “La Sapienza”, Piazzale A. Moro 2, I-00185 Roma, Italy
9 INFN–Pavia, Via Bassi 6, I-27100 Pavia, Italy
10 INFN–Roma “Tor Vergata”, Via della Ricerca Scientifica 1, I-00133 Roma, Italy
11 Dip. di Fisica, Univ. dell’Insubria, Via Valleggio 11, I-22100 Como, Italy
12 ENEA–Frascati, Via E. Fermi 45, I-00044 Frascati (Roma), Italy
13 ASI–ASDC, Via G. Galilei, I-00044 Frascati (Roma), Italy
14 ASI, Viale Liegi 26 , I-00198 Roma, Italy
15 Dipartimento di Fisica Nucleare e Teorica, Universitá di Pavia, Via Bassi 6, Pavia, I-27100, Italy
16 Dipartimento di Fisica, Universitaá La Sapienza, Piazza Aldo Moro 2, I-00185 Roma, Italy
17 INAF Osservatorio Astronomico di Cagliari, Poggio dei Pini, I-09012 Capoterra (Cagliari), Italy
18 Astrophysics Group, Cavendish Laboratory, 19 J. J. Thomson Avenue, Cambridge CB3 0HE, UK
19 Special Astrophysical Observatory RAS, Karachaevo-Cherkassian Republic, Nizhnij Arkhyz 36916, Russia
20 Smithsonian Center for Astrophysics, 60 Garden Street, Cambridge, Massachusetts 02138, USA
21 Finnish Centre for Astronomy with ESO (FINCA), University of Turku, Väisä lä ntie 20, FI-21500 Piikkiö, Finland
22Aalto University Metsähovi Radio Observatory Metsähovintie 114 FIN-02540 Kylmälä Finland
23 INAF/IASF–Palermo, Via Ugo La Malfa 153, I-90146 Palermo, Italy
24 Astronomy And Astrophysics Department of Physics, University of Warwick, Coventry CV4 7AL, UK
25 CISAS “G. Colombo” , Univ. di Padova, Via Venezia 15, 35131 Padova, Italy
26 Department of Physics and Space Sciences, Florida Institute of Technology, 150 W. University Blvd., Melbourne, FL 32901, USA
27 INAF - Osservatorio Astronomico di Roma, Via Frascati 33, I-00040 Monteporzio, Italy
28 School of Physics, University of the Witwatersrand, Johannesburg Wits 2050, South Africa
AGILE detection of Cygnus X-3 -ray active states during the period mid-2009/mid-2010
Abstract
Context. Cygnus X-3 (Cyg X-3) is a well-known microquasar producing variable emission at all wavelengths. Cyg X-3 is a prominent X-ray binary producing relativistic jets, and studying its high energy emission is crucial for the understanding of the fundamental acceleration processes in accreting compact objects.
Aims. Our goal is to study extreme particle acceleration and -ray production above 100 MeV during special spectral states of Cyg X-3 usually characterized by a low hard X-ray flux and enhanced soft X-ray states.
Methods. We observed Cyg X-3 with the AGILE satellite in extended time intervals from 2009 Jun.–Jul, and 2009 Nov.–2010 Jul. We report here the results of the AGILE -ray monitoring of Cyg X-3 as well as the results from extensive multiwavelength campaigns involving radio (RATAN-600, AMI-LA and Metsähovi Radio Observatories) and X-ray monitoring data (XTE and Swift).
Results. We detect a series of repeated -ray flaring activity from Cyg X-3 that correlate with the soft X-ray states and episodes of decreasing or non-detectable hard X-ray emission. Furthermore, we detect -ray enhanced emission that tends to be associated with radio flares greater than 1 Jy at 15 GHz, confirming a trend already detected in previous observations. The source remained active above 100 MeV for an extended period of time (almost 1.5 months in 2009 Jun.–Jul and 1 month in 2010 May). We study in detail the short timescale -ray flares that occurred before or near the radio peaks.
Conclusions. Our results confirm the transient nature of the extreme particle acceleration from the microquasar Cyg X-3. A series of repeated -ray flares shows correlations with radio and X-ray emission confirming a well established trend of emission. We compare our results with Fermi-LAT and MAGIC TeV observations of Cyg X-3.
Key Words.:
gamma-rays:stars; Stars: individual: Cygnus X-31 Introduction
Cygnus X-3 (Cyg X-3) is one of the most puzzling and interesting compact objects in our Galaxy. Discovered in 1966 Giacconi et al. (1967), Cyg X-3 is a high-mass X-ray binary exhibiting a 4.8 hr modulation in its X-ray Parsignault et al. (1972); Vilhu et al. (2009), infrared Mason et al. (1986); van Kerkwijk et al. (1992, 1996) and -ray Abdo et al. 2009b emission. The system is believed to be composed of a mass-donating Wolf-Rayet star van Kerkwijk et al. (1996) orbiting around a compact object (neutron star or black hole). Certainly what makes Cyg X-3 an interesting object is its ability to produce very energetic relativistic radio jets Molnar et al. (1988); Mioduszewski et al. (2001) that usually occur in coincidence with particular spectral states McCollough et al. (1999); Zdziarski & Gierlinski (2004); Szostek et al. (2008); Hjalmarsdotter et al. (2009); Koljonen et al. (2010). Many decades of X-ray monitoring of Cyg X-3 have provided a wealth of information on this source, and in general the soft, intermediate and hard X-ray states show correlated or anti-correlated behaviours with respect to the radio and jet emission. In particular, the soft (1-10 keV) and hard (20-100 keV) X-ray emission from Cyg X-3 are clearly anti-correlated during “normal” stages during which the source produces radio emission at low or intermediate levels with no major radio jet production. Major radio flares in Cyg X-3 are preceded by quenched states, during which the source is in a soft X-ray state and radio emission is strongly suppressed.
The ability of Cyg X-3 to efficiently accelerate particles in relativistic jets, and the favourable jet geometry parameters that make the transient jet phenomenon very dramatic (e.g. Mioduszewski et al. (2001) ) have attracted considerable attention from the astrophysics community. Cyg X-3 is a Galactic “microquasar”, and the inner dynamics and accretion properties of its compact object can shed light on fundamental physical processes of relativistic jet sources, both Galactic and extragalactic. From this point of view, exploring the high-energy emission from Cyg X-3 and unveiling its temporal and physical properties open the way to a detailed understanding of the plasma properties of inner accretion disks of compact objects and of particle acceleration processes under extreme radiative conditions.
Motivated by these reasons, our group has made a detailed study of -ray emission from Cyg X-3 with the AGILE satellite. The AGILE discovery of transient -ray emission from Cyg X-3 in 2008 Apr. associated with a specific spectral state preceding a major radio jet ejection opened a new window of investigation of microquasars. Several other major -ray emission episodes from Cyg X-3 have been detected by AGILE and Fermi since 2008 Tavani et al. 2009b ; Abdo et al. 2009b . In this paper, we focus on the main results of our extensive search for transient -ray emission from Cyg X-3 carried out in the energy range 100 MeV - 50 GeV by AGILE during the periods 2009 Jun–Jul and 2009 Dec.–2010 mid-Jun. We find that the activity in -rays during the periods 2009 Jun–Jul and 2010 May temporally coincide with the hard X-ray emission reach minimum values. Our results confirm the overall trend found by (Tavani et al. 2009b, ), i.e., that the highest -ray emission above 100 MeV from Cyg X-3 is associated with soft X-ray spectral states that are in general coincident with or anticipate radio jet ejections. Furthermore, our results show that -ray emission from Cyg X-3 is detectable by AGILE not only during relatively short (1-2 day) flares as in (Tavani et al. 2009b, ) but also during “extended” periods lasting several days or weeks (as during 2009 Jun-Jul). Detecting continuous -ray emission during “active” phases is of great theoretical relevance for the modelling of Cyg X-3 .
We also briefly compare here the AGILE and Fermi-LAT results. We also consider a recent investigation by the MAGIC group reporting their results on a monitoring program of Cyg X-3 in the TeV energy range Aleksic et al. (2010), and briefly discuss the implications with respect to the AGILE detections.
2 The AGILE GRID observations of Cyg X-3
AGILE (Astrorivelatore Gamma ad Immagini LEggero - Light Imager for Gamma-ray Astrophysics) is a scientific mission of the Italian Space Agency (ASI) launched on April 23, 2007 Tavani et al. 2009a . The AGILE scientific payload is made of three detectors: (1) a -ray imager made of a Tungsten-Silicon Tracker (ST) Barbiellini et al. (2002); Prest et al. (2003); Bulgarelli et al. (2010) with a large field of view (about 60∘); (2) a co-axial hard X-ray silicon detector (named Super-AGILE Feroci et al. (2007)), for imaging in the 18-60 keV energy range, and (3) a CsI(Tl) Mini-Calorimeter (MCAL) detector Labanti et al. (2006) that detects -rays or particle energy deposits between 350 keV and 100 MeV. The whole instrument is surrounded by an anti-coincidence (AC) system Perotti et al. (2006) of plastic scintillators for the rejection of background charged particles. An effective background rejection, event trigger logic, and on-board data storage and transmission is implemented Argan et al. (2004). ST, MCAL and AC form the so called Gamma-Ray Imaging Detector (GRID) for observations in the 30 MeV-50 GeV energy range. The AGILE orbital characteristics (quasi-equatorial with an inclination angle of 2.5 degrees and average 530 km altitude) are optimal for low-background -ray observations. AGILE data are transmitted to the ASI Malindi ground station in Kenya, and quickly transferred to the ASI Science Data Center (ASDC) near Frascati. Data processing of -ray data is then carried out at the ASDC and AGILE Team locations.
The AGILE-GRID is optimized in the 100 MeV - 1 GeV range, as demonstrated by the calibrated data (Cattaneo et al., 2011; Chen et al. 2011b, ) and by the in-orbit performance Tavani et al. 2009a .
The AGILE -ray exposure of the Cygnus region can be divided in two parts.
(1) A first set of exposures obtained in the satellite “pointing mode” characterized by pointing centroids near the Cygnus region in the Galactic plane. In this mode, AGILE accumulated a total effective time of 338 days during the period 2007 Jul–2009 Oct. Table 1 provides the details of the main time intervals analyzed in this paper for which a substantial exposure was accumulated in the Cygnus region in this pointing mode.
(2) A second set of exposures obtained quasi-continuously with the satellite operating in “spinning mode” since 2009 Nov. In this mode, the satellite axis sweeps an entire circle in the sky in approximately 7 minutes. Depending on the season, the whole sky is progressively exposed with a typical accumulating pattern. The Cygnus region is favorably positioned in the sky, and has been continuously monitored since 2009 Nov. with a 2-days exposure comparable with 1-day pointing exposure level.
| Obs. block | l | b | Time (MJD) | Mean off-axis angle | Flux | ||
|---|---|---|---|---|---|---|---|
| OB7500/OB7600 | 92.835 | -9.574 | 54997.50-55027.50 | 17/29 | 3.5 | 32 10 | |
| OB7700 | 105.729 | 7.231 | 55027.50-55055.50 | 30 | 2 | 20 | |
| spinning | - | - | 55168.50-55362.50 | - | 2 | 16 |
The Table provides: (1) the observation block (OB) number; (2-3) the galactic coordinates and of the pointing centroids; (4) the time interval in MJD; (5) the off-axis position of Cyg X-3 at the beginning of the OB (in degrees); (6) the statistical significance of the source detection according to the maximum likelihood ratio test; (7) the period-averaged flux () in ph. cm-2 s-1(if a upper limit is reported)
2.1 Data analysis method
The data analysis was performed on the data set in pointing mode generated with the reprocessing no. 3 of the AGILE Standard Pipeline, and with the AGILE-GRID software package version 4 publicly available at the ASI Data Center web site (http://agile.asdc.asi.it/). The analysis has been performed with the FM3.119 filter and the calibration matrix used is the I0023 version. The events collected during the passage in the South-Atlantic Anomaly and the Earth albedo background were consistently rejected. The GRID event directions were reconstructed by the AGILE Kalman filter technique (Giuliani et al., 2006). To reduce the particle background contamination, we selected only events flagged as confirmed -ray events (G class events, corresponding to an on-axis effective area of cm2 at 100 MeV).
The multi-source likelihood analysis method (MSLA) (Mattox et al., 1996) was used to search for persistent and transient emission from Cygnus region; this analysis method iteratively optimizes position, flux and spectral index of all the sources of the region. The likelihood ratio is then simply the ratio of the maximum likelihood of two hypothesis (e.g. the absence and the presence of a source). For this analysis, integrating all flaring episodes in 2009 Jun-Jul, we obtained (see Section 3.2 and Fig. 4) and kept fixed the photon index of 2.0 for Cyg X-3. This is consistent with other AGILE detections reported in (Tavani et al. 2009b, ).During the analysis the position of the source is kept free and constrained with the 95 confidence contour level. The AGILE photon counts, exposure, and Galactic background maps were generated with a bin size of for E100 MeV to compute the period-averaged source flux and its evolution. The analysis was performed over a region of radius.
The Galactic diffuse -ray radiation (Giuliani et al., 2004) and the isotropic emission are taken into account in the model. The Galactic diffuse emission model is based on a 3D grid with bin of 0.25∘ in galactic longitude and latitude and 0.2 kpc in distance along the line of sight. In order to model the matter distribution in the galaxy we use the HI (Kalberla et al., 2005) and CO (Dame et al., 2001) radio survey and we take into account the cosmic ray models (Chi et al., 1991) which can differ from the locally observed cosmic ray spectrum.
Two energy bands have been considered in the analysis: 100 MeV - 50 GeV and 400 MeV - 50 GeV.
Only the detections with and with a position consistent with Cyg X-3 source are selected. For this subclass of selected flare peaks, a non-automatic verification is performed to further confirm the results. Pre-trial significance was determined by calculating the density function of our analysis method (Mattox et al., 1996) by means of Monte Carlo simulation (Bulgarelli et al. submitted, ). For the determination of the post-trial significance we have taken into account only the number of bins of the light curve111This means that we have considered maps in pointing mode and maps in spinning mode. The total number of maps is 150..
| E100 MeV | E400 MeV | ||||||
| AGILE Name | l | b | Flux | Flux | Counterpart name | ||
| AGL 2021+4029 | 78.24 | 2.16 | 42.1 | 141 4 | 30 | 33 1.5 | 1AGL J2022+4032 - Gamma Cygni |
| AGL 2021+3652 | 75.24 | 0.14 | 23.3 | 67 3 | 21 | 19 1.2 | 1AGL J2021+3652 - PSR J2021+3651 |
| AGL 2030+4129 | 80.11 | 1.25 | 8.1 | 18 4 | 8.7 | 5.6 0.7 | 1AGL J2032+4102 - LAT PSR J2032+4127 |
| AGL 2026+3346 | 73.28 | -2.49 | 6.8 | 10 1.7 | 6.2 | 2.8 0.5 | - |
| AGL 2046+5032 | 88.99 | 4.54 | 6.5 | 10 1.7 | 6.1 | 2.6 0.5 | - |
| AGL 2016+3644 | 74.59 | 0.83 | 6.3 | 14 2.3 | - | - | - |
| AGL 2029+4403 | 81.97 | 3.04 | 5.4 | 14 3 | 5.1 | 3.4 0.7 | - |
| AGL 2033+4056 | 79.92 | 0.58 | 5.3 | 15 2 | 3.1 | 2.3 0.7 | 1AGL J2032+4102 - Cygnus X-3 |
| AGL 2038+4313 | 82.32 | 1.18 | 5.1 | 15 3 | - | - | - |
| AGL 2024+4027 | 78.56 | 1.63 | 5.0 | 24 5 | 6.1 | 11 2 | - |
| AGL 2019+3816 | 76.24 | 1.14 | 4.2 | 11 2.4 | 4.2 | 2 0.6 | - |
| AGL 2036+3954 | 79.47 | -0.56 | 3.4 | 5.0 1.5 | 5.7 | 3.8 0.7 | - |
The Table provides: (1) AGILE name of the sources; (2) (3) the galactic coordinates and ; (4) (6) the statistical significance of the source detection according to the maximum likelihood ratio test for E100 MeV and E400 MeV respectively; (5) (7) the period-averaged flux () in ph. cm-2 s-1for E100 MeV and E400 MeV respectively; (8) a possible counterpart
The Cygnus region is characterized by complex -ray emission: several -ray sources are detected above 100 MeV, and it is important to correctly model the diffuse radiation of the region. Three bright -ray sources dominate the Cygnus region and also reported in the First AGILE Catalog Pittori et al. (2009). They are all -ray pulsars Halpern et al. (2008); Abdo et al. 2009a ; Camilo et al. (2009). We added more nearby sources in the -ray model (Table 2) and the statistical analysis of these sources is compared with the First AGILE Catalog analysis. A new likelihood analysis investigation has been performed to take into account a new background event filter (FM3.119). We have also added considerably more exposure to the data set.
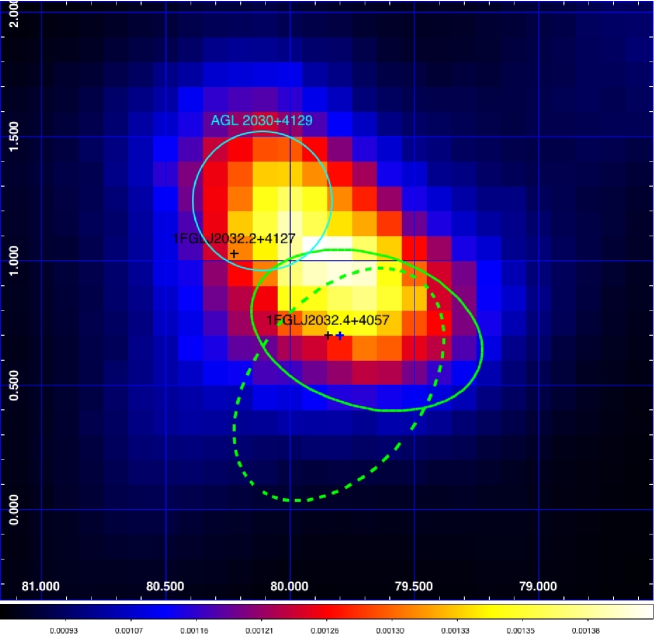
For our MSLA method we first determined self-consistently the positions of all bright sources (including also a Cyg X-3 candidate source, AGL 2033+4056) by considering the whole set of AGILE-GRID data in pointing mode for the Cygnus region. Subsequently (see next Section), for the time-resolved analysis of Cyg X-3 candidate source, we fixed the fluxes and the positions of the brightest sources as shown in Table 2, keeping the position and flux of Cyg X-3 free. In particular, we studied the -ray source 222Notice that the initially reported AGILE First Catalog source 1AGL J2032+4102 Pittori et al. (2009) comprises two -ray sources separated by only 0.4∘ as clarified in (Tavani et al. 2009b, ) and confirmed by our more refined analysis. that we call here AGL 2030+4129 that is positioned only 0.4∘ from Cyg X-3 position. This -ray source is consistent in position and average flux with the source 1FGL~J2032.2+4127 Abdo et al. (2010) which is the counterpart of the radio pulsar PSR~J2032+4127 (of spin period ms, and a most likely distance kpc (Camilo et al., 2009)). Given the differences in the published determinations333 Fermi-LAT First Catalog analyses give a -ray photon spectral index consistent with the value . However, an analysis of the -ray Fermi-LAT data of PSR J2032+4127 that was carried out by selecting only the on-pulse phase photons gives an exponentially cut-off power law spectrum of photon spectral index and cutoff energy GeV for a pulsed -ray flux of above 100 MeV (Camilo et al., 2009). of the -ray spectral index of AGL 2030+4129/1FGL J2032.2+4127, we considered in our analysis two -ray spectral indices (Fermi-LAT First Catalog) , and calculated with AGILE data; for these indices we find the corresponding average fluxes and ph. cm-2 s-1. In this paper we adopt the spectral index value that is the value calculated with the AGILE data.
An alternative method using the False Discovery Rate (FDR, (Benjamini et al., 1995; Miller et al., 2001; Hopkins et al., 2002)) has been used to analyze the flares detected with MSLA. The detection method (FDRM) is a statistical test that takes into account the corrections for multiple testing, as needed for example in repeated systematic searches. The FDRM allows to control the expected rate of false detections (due to background fluctuations) within a selected sample. The FDR- parameter provides the fraction of expected false detections for a given source selection. The method was adapted to the analysis of AGILE gamma-ray data of the Galactic plane Sabatini et al. (2010); Tavani et al. 2009b in pointing mode and for E100 MeV (for spinning mode end for E400 MeV the method is not available). The FDRM is complementary and more conservative than the determination of a post-trial detection significance based on a simulated set of replicated photon maps; applying FDR method to typical short-time AGILE-GRID photon maps in the Galactic plane, FDR- values near or below 0.01 fully qualify for gamma-ray transients (it correspond to post-trial random occurrences of 1-day map replications equal to 1 every 300 or more).
2.2 Flaring -ray activity observed by AGILE
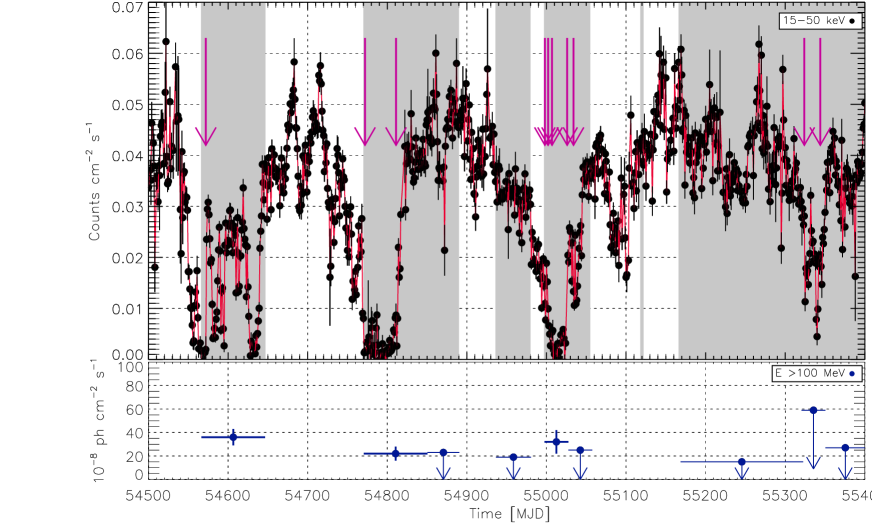
We detected several significant short timescale -ray flares from the Cyg X-3 region during the 2009 Jun–Jul period (pointing mode) and during the 2009 Dec.–2010 Jun period (spinning mode). Fig. 1 shows the light-curve of Cyg X-3 obtained in the 15-50 keV range by the Swift -BAT instrument from 2008 Jan. 1 to 2010 Jun 1. Superimposed on the same plot are several arrows indicating the periods of major -ray flaring detected by AGILE and associated with Cyg X-3, including those already reported in (Tavani et al. 2009b, ) (see Table 5).
Table 6 and 7 reports the details of the flares analyzed in this paper with the significance of the detections both with MSLA method and FDR method (when applicable). The MSLA and the FDRM use different assumptions for the background (diffuse) model, therefore it could happen that the relative significance of the detections is different. However, the result we wanted to point out in the table is that both independent methods would have selected the episodes as statistically significant.
Periods of long -ray AGILE exposure (shown in grey in Fig. 1) cover both high, intermediate, and low states of hard X-ray emission from Cyg X-3.
2.3 Average -ray flux detected from Cyg X-3
By integrating all AGILE data from 2007 Jul 13 (MJD 54294.50) to 2010 Jun 15 (MJD 55362.50) (about 1.5 year of effective livetime on the Cygnus region) for E 100 MeV. we find a -ray source at the level consistent with Cyg X-3 position, at (l,b) = (79.92, 0.58) 0.3 (stat.) 0.1 (syst.) and with an average flux ph. cm-2 s-1above 100 MeV that contains all the -ray states. No significant detection is made for E 400 MeV.
If we remove all flares detected by AGILE with (reported in (Tavani et al. 2009b, ) and in Table 6) we find a -ray source at the level at the position (l,b) = (80.03, 0.65) 0.5 (stat.) 0.1 (syst.), consistent with the Cyg X-3 position, with an average flux ph. cm-2 s-1above 100 MeV. Note that this extended time interval includes several periods with low hard X-ray/high soft X-ray emission that we call here “active -ray states”. It is therefore possible that the value of is influenced by low-level -ray emission from Cyg X-3 during the active states.
Table 5 reports all the “active” and “non-active” -ray states associated with the hard and soft X-rays state. These periods are also shown in the bottom panel of Figure 1. For example, integrating during the period 2009 Jun 15 until 2009 July 15 (MJD = 54997.50 - 55027.50) we find an average flux ph. cm-2 s-1above 100 MeV.
In order to study “non-active -ray” Cyg X-3 states (i.e., those corresponding in general to the common high hard X-ray states) we also focused on specific time intervals characterized by average Swift/BAT levels of emission above 0.028 cts. cm-2 s-1. For the period starting on 2009 Jan. 19 until 2009 Feb. 28 (MJD = 54850.50-54890.50) we find a 95% confidence limit upper limit ph. cm-2 s-1above 100 MeV. Integrating from 2009 Dec. 1 until 2010 May 4 (MJD = 55166.50-55320.50) we find a 95% confidence limit upper limit ph. cm-2 s-1above 100 MeV.
| Time (MJD) | Flux | X-ray state | |
|---|---|---|---|
| 54566.50-54646.50 | 5.9 | 36 7 | soft |
| 54770.50-54850.50 | 3.6 | 22 6 | soft |
| 54850.50-54890.50 | 2 | 23 | hard |
| 54936.50-54980.50 | 2 | 19 | hard |
| 54997.50-55027.50 | 3.5 | 32 10 | soft |
| 55027.50-55055.50 | 2 | 20 | hard |
| 55166.50-55320.50 | 2 | 15 | hard |
| 55320.50-55350.50 | 2 | 59 | soft intermediate |
| 55350.50-55400.50 | 2 | 27 | hard |
The Table provides: (1) the time interval in MJD; (2) the statistical significance of the source detection according to the maximum likelihood ratio test; (3) the period-averaged flux () in ph. cm-2 s-1(if a upper limit is reported); (4) the X-ray state
2.4 Instrument stability
| AGL source name | (l,b) positioning | -ray flux | Counterpart name | |
|---|---|---|---|---|
| (degrees) | ( ph. cm-2 s-1) | |||
| AGL J0247+6027 | (136.71, 0.70) 0.37 0.1 | 11 3 | 4.4 | PSR J0248+6021 |
| AGL J0303+7438 | (131.46, 13.98) 0.43 0.1 | 7 2 | 4.0 | PSR J0308+7442 |
| AGL J1136-6053 | (293.90, 0.67) 0.35 0.1 | 12 3 | 4.5 | LAT PSR J1135-6055 |
| AGL J1435-5932 | (315.68, 0.75) 0.70 0.1 | 13 4 | 4.0 | LAT PSR J1429-5911 |
| AGL J1953+3254 | (68.76, 2.86) 0.18 0.1 | 17 2 | 8.3 | PSR J1952+3252 |
| AGL J2224+6113 | (106.20, 3.20) 0.43 0.1 | 11 2 | 5.7 | PSR J2229+6114 |
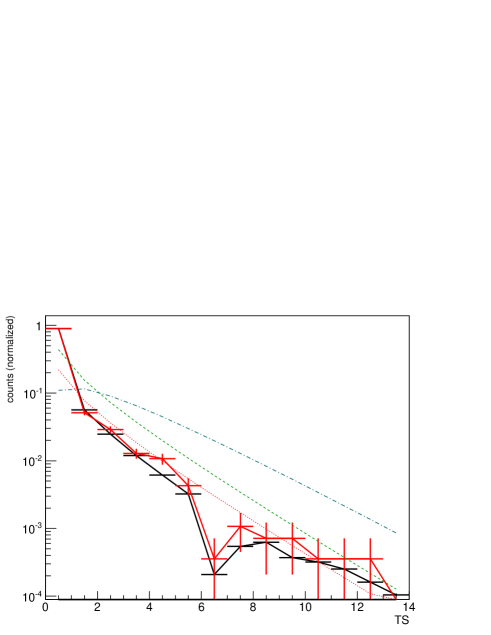
We have analyzed some AGILE sources having flux near the average -ray flux detected from Cyg X-3 (see Section 2.3) that are not expected to be variable. In particular, we have considered the -ray pulsars reported in Table 4. The analysis has been carried out using the same procedure performed on Cyg X-3, by dividing the analyzed period (from 2007 Jul to 2011 May) in two sets: pointing mode (with a 1 day bin size light-curve) and spinning mode (from 2009 Nov., with a 2 days bin size light-curve). We have done about 1530 trials for the pointing mode and 1536 trials for the spinning mode. The resulting probability density function (PDF) of values is shown in Fig. 2 where it is compared with a simulation of Cyg X-3 field: in this field all the sources reported in Table 2 are simulated except Cyg X-3 that has zero flux. It is noted that the distribution of real AGILE observations of the source listed in Table 4 (red line) is fully compatible with the simulations (black line) and this fact excludes the presence of spurious flares introduced by instrument instability during the AGILE lifetime. As stated in (Bulgarelli et al. submitted, ) the vertical translation of the distribution depends on the complexity of the analyzed region.
With these distributions the expected number of wrong detections with (the lowest value of Table 6) in 150 maps (the number of bins of the light curves) is about 0.2; in this paper we have 8 detections in 150 maps.
2.5 Observations in pointing mode
The AGILE pointing observations of the Cygnus field analyzed in this paper are listed in Table 1, and cover about two months of uninterrupted observation. Having obtained the general results on the Cygnus region described in the previous section, we carried out a systematic search for short timescale variability of Cyg X-3 during the interval of substantial AGILE-GRID exposure in pointing mode in 2009.
| -ray flaring date | (l,b) positioning | -ray flux | FDR- | |
|---|---|---|---|---|
| (MJD) | (degrees) | ( ph. cm-2 s-1) | ||
| 54572.00-54573.00 | (79.10, 0.60) 0.60 0.1 | 260 80 | 0.001 | 4.2 |
| 54772.00-54773.00 | (79.30, 0.70) 0.70 0.1 | 258 82 | 0.01 | 4.0 |
| 54811.00-54821.00 | (79.60, 0.30) 0.60 0.1 | 210 73 | 0.01 | 3.8 |
| -ray flaring date | (l,b) positioning | -ray flux | FDR- | pre-trial | post-trial | Swift -BAT flux | |
| (MJD) | (degrees) | ( ph. cm-2 s-1) | for a single | for a single | () | ||
| detection | detection | ||||||
| 54997.50-54998.50 | (80.50, 0.53) 0.90 0.1 | 180 64 | 0.005 | 3.9 | 3.75 | 2.2 | 0.010 |
| 55001.00-55002.00 | (79.44, 0.93) 0.65 0.1 | 168 67 | 3.5 | 3.35 | 1.57 | 0.015 | |
| 55003.00-55004.00 | (80.35, 1.15) 0.64 0.1 | 157 56 | 3.8 | 3.71 | 2.11 | 0.007 | |
| 55007.00-55008.00 | (79.30, 0.81) 0.57 0.1 | 176 64 | 3.7 | 3.51 | 1.83 | 0.005 | |
| 55025.00-55026.00 | (79.75, 1.15) 0.58 0.1 | 167 70 | 0.006 | 3.3 | 3.20 | 1.29 | 0.008 |
| 55034.00-55035.00 | (80.12, 0.96) 1.00 0.1 | 168 67 | 0.005 | 3.4 | 3.27 | 1.43 | 0.013 |
| 55324.00-55326.00* | (79.12, 0.91) 0.83 0.1 | 170 70 | - | 3.3 | 3.20 | 1.29 | 0.028 to 0.011 |
| 55343.00-55345.00 | (79.89, 0.71) 0.86 0.1 | 290 103 | - | 3.7 | 3.51 | 1.83 | 0.020 to 0.018 |
| repeated flare | |||||||
| occurrence | |||||||
| post-trial | |||||||
| Sum of above detections | (79.69, 0.72) 0.30 0.1 | 160 40 | 6.2 | 7.2 |
* ATel 2609.
ATel 2645
We calculated the post-trial significance for 150 trials, which is equivalent of about 1 year of total exposure time.
| -ray flaring date | (l,b) positioning | -ray flux | pre-trial | post-trial | Swift -BAT flux | |
| (MJD) | (degrees) | ( ph. cm-2 s-1) | for a single | for a single | () | |
| detection | detection | |||||
| 54997.50-54998.50 | (80.42, 0.41) 0.60 0.1 | 67 29 | 3.9 | 3.75 | 2.2 | 0.010 |
| 55000.50-55001.50 | (78.88, 0.56) 0.92 0.1 | 45 24 | 3.0 | 2.99 | 0.89 | 0.015 |
| 55018.50-55019.50 | (79.75, 0.55) 0.60 0.1 | 65 33 | 3.7 | 3.51 | 1.83 | 0.004 |
| 55343.50-55345.50 | (80.07, 0.56) 0.70 0.1 | 94 43 | 3.5 | 3.35 | 1.57 | 0.020 to 0.018 |
| repeated flare | ||||||
| occurrence | ||||||
| post-trial | ||||||
| Sum of above detections | (79.8, 0.5) 0.31 0.1 | 58 18 | 5.1 | 3.8 |
Fig. 3, panels 1-3 provide a close-up of Fig. 1 showing the details of the -ray emission above 100 MeV (panel 1) and 400 MeV (panel 2) detected by AGILE from Cyg X-3 together with simultaneous hard X-ray information from both Swift -BAT and Super-AGILE (panel 3). The interval covering the period 2009 Jun.–Aug. (MJD: 54997.50 - 55055.50) corresponds to a deep and prolonged minimum of the hard X-ray emission from Cyg X-3. The Fermi light curve is also superimposed in panel 1 Abdo et al. 2009b . Several 1-day episodes of -ray flaring emission from Cyg X-3 with flux ph. cm-2 s-1 are detected. Table 6 provides detailed information on the main flare episodes of Fig. 3 and obtained for 1-day time integrations for MeV. Table 7 lists flares for MeV. The coverage of one of the MAGIC observations (Aleksic et al., 2010) of Cyg X-3 in the soft X-ray state that provides an upper limit above 250 GeV is also shown in panel 2.
Fig. 3, panel 5-6 shows the radio monitoring data obtained by our group at 15 GHz at the AMI-LA radio telescope (already published in Abdo et al. 2009b ), the RATAN-600 data at the frequencies 2.15, 4.8, 7.7, 11.2, and 21.7 GHz, and the Metsähovi Radio Observatory data at 37 GHz. Finally, Fig. 3, panels 4-5 shows the 1.3-12 keV data obtained from the XTE/ASM monitoring of Cyg X-3.
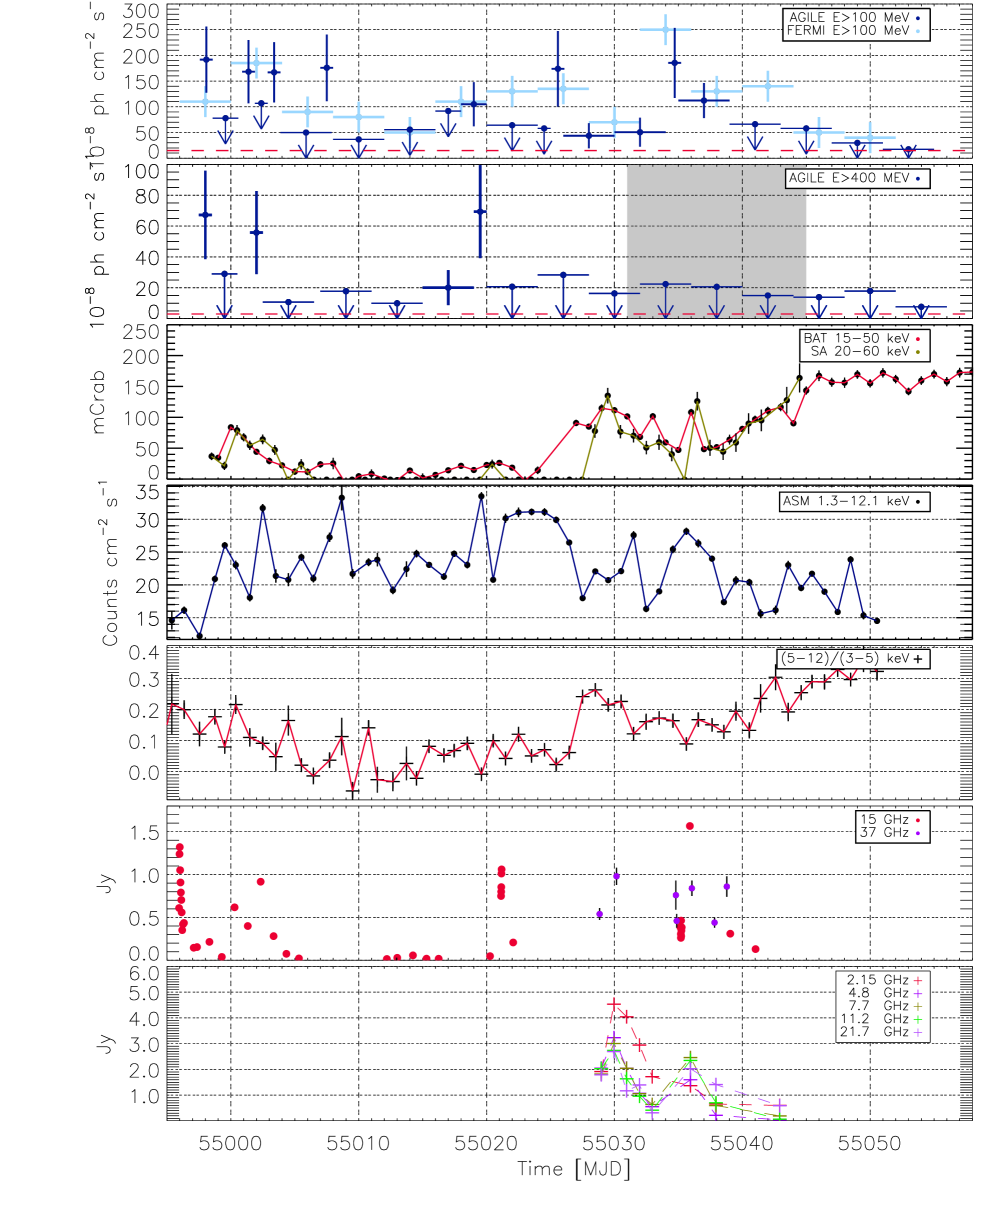
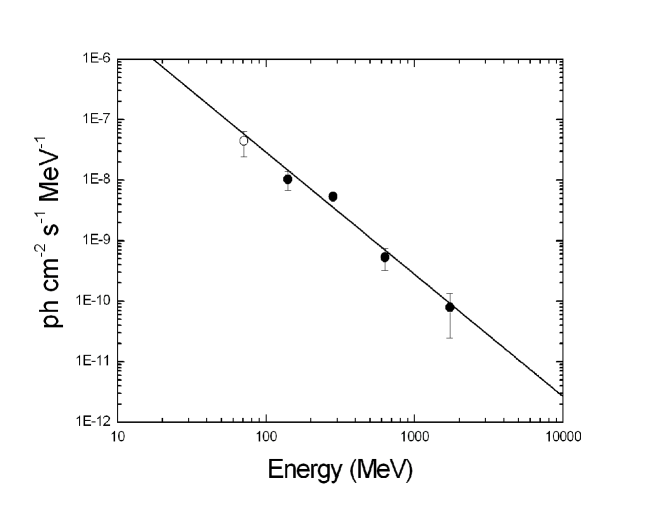
Fig. 4 shows the -ray spectrum obtained by integrating all of the -ray flaring episodes in 2009 Jun.–Jul. A single power-law fit gives a photon spectral index . However, a more complex spectrum with substantial curvature in the energy range 100 MeV - a few GeV cannot be excluded.
2.6 Observations in “spinning” mode
Since early 2009 Nov. the AGILE satellite has been operating in a “spinning” mode implying a smooth and continuous change of the satellite attitude. In this mode, the -ray boresight axis sweeps 360 degrees in about seven minutes. Solar panels are kept perpendicular to the Sun direction by an automatic mechanism, so that the pattern swept on the sky slowly moves with time following the solar panel configuration. The resulting -ray daily exposure covers about 70% of the whole sky every day (leaving uncovered only the regions near the Sun or anti-Sun directions) and provides significant continuous monitoring of exposed sources for many months. The Cygnus region was in a favorable position in the sky, i.e., always in the field of view (within about 50 degrees off-axis) of the AGILE spinning instrument. This was useful for assessing in a consistent way the pattern of -ray variable emission from Cyg X-3 and correlating with other wavelength emission. The AGILE pointing mode had a relatively larger daily exposure compared with that obtained in the spinning mode. However, the AGILE pointings at the Cygnus region required a pre-defined planning strategy, and the overall monitoring livetime was about 50% from 2007 Jul to 2009 Oct.
Since AGILE started operating in spinning mode (2009 Nov.) to 2010 Jun. Cyg X-3 has been mostly in its hard X-ray state that does not favour strong -ray emission (Tavani et al. 2009b, ; Abdo et al. 2009b, ) .
We continuously searched for transient -ray emission from the Cyg X-3 region during the AGILE spinning mode phase with an automatic alert monitoring system (Bulgarelli et al., 2009). In 2010 May this monitoring system detected a signal above from Cyg X-3, that was subsequently verified by a manual analysis. We detected two -ray emission episodes during MJD 55324-55326 (Bulgarelli et al. 2010a, ) not confirmed by Fermi (Corbel et al. 2010a, ), and on MJD 55343-55345 (Bulgarelli et al. 2010b, ) confirmed by Fermi (Corbel et al. 2010b, ). The details of a refined analysis are reported in Table 6 for MeV and in Table 7 for E400 MeV.
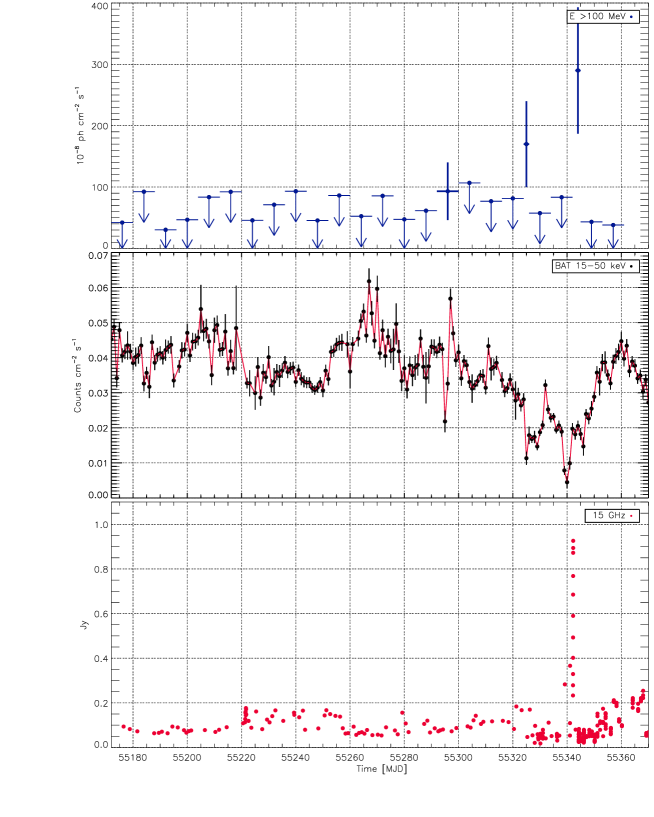
Fig. 5 shows the detailed 1-day hard X-ray lightcurve of Cyg X-3 together with the AGILE-GRID emission episodes and AMI-LA radio monitoring. A 15 GHz radio flare is evident in the data and it anticipates the -ray flare at MJD 55343 by 1-day.
2.7 Combining all Cygnus X-3 flares detected by AGILE
Fig. 6 reports the sum of all the flares detected by AGILE-GRID from Cyg X-3 reported in this paper for E100 MeV. The significance of the sum of all the flares is with a flux of 160 40 ph. cm-2 s-1and a 95 contour level centered in in Galactic coordinates, with a semi-major axis of 0.47∘ and a semi-minor axis of 0.28∘ (including statistical and systematic errors).
The significance of the sum of all the flares for E400 MeV is with a flux of 58 18 ph. cm-2 s-1and a 95 contour level centered in in Galactic coordinates, with a semi-major axis of 0.53∘ and a semi-minor axis of 0.34∘ (including statistical and systematic errors).
The 1FGL J2032.2+4127 and AGL 2030+4129 are both outside the AGILE error box. This fact excludes that the detected flares originate from these nearby sources.
In order to assess the statistical significance of our detections, we consider the post-trial probability of flare occurrence. We have to distinguish two cases:
-
1.
the case of a single flare episode originating from a specific source within a given error box (that we define as “single independent occurrence”);
-
2.
the case of repeated flaring episodes originating from a specific source with a given error box (that we call here “repeated flare occurrence”.
For each individual detection by AGILE reported in Tables 6 and 7 we calculated the post-trial significance of the single independent occurrences, which does not take into account the history of repeated occurrences.
We calculate the post-trial significance for repeated flare occurrences at the Cyg X-3 error-box position as follows. Each independent time period is a single trial. The chance probability of having or more detections at a specific site with a statistic satisfying in trials is given by where is the p-value corresponding to the value. For , we have a p-value of . The estimated probability of 8 detections (E100 MeV) consistent with the null hypothesis in 150 maps is that corresponds to Gaussian standard deviations.
Table 7 reports the repeated flare occurrence significance for E400 MeV.
In order to test the pre-trial type I error (rejecting the null hypothesis when in fact it is true) we also searched for transient emission at the position (l,b)=(78.38, 0) near Cyg X-3 with similar characteristics of the diffuse background. We found a distribution compatible with the expected statistics (the black histogram of Fig. 2).
2.8 Statistical correlations with other wavelenghts
2.8.1 Anticorrelation with hard X-ray emission
We notice that the -ray episodes detected by AGILE are all in correspondence with peculiar states of the hard X-ray emission. Both the -ray emission flaring episodes correspond to 1-day minima of the BAT hard X-ray light-curve. The typical trend of anticorrelated soft and hard X-ray emission from Cyg X-3 is evident and also shown by the ASM hardness ratio trend.
This paper reports eight flares originating from Cyg X-3 for E100 MeV. All are in correspondence with a low hard X-ray flux of Cyg X-3; seven of them are under 0.02 cts. cm-2 s-1in the Swift/BAT, and one is under 0.028 cts. cm-2 s-1. To quantify the relation between -ray emission and hard X-ray emission it is reasonable to set a threshold of 0.028 cts. cm-2 s-1in the Swift/BAT data: the fraction of the time that this source is under this level during the AGILE observation time is . For -ray flares originating from Cyg X-3, is the probability that all the flares are under the hard X-ray threshold, and is the probability of having or more detections in maps (see Section 2.7). We find that the confidence level that all the -ray flares occur at a low hard X-ray flux is normal standard deviations.
We have also calculated the Discrete Cross-Correlation Function (DCF). The DCF correlates two sets of unevenly sampled data (Edelson et al., 1988). We have correlated both BAT/Swift (sampled each day) and AMI-LA (variously sampled more than one time in a day or every few days) with AGILE data (sampled every few days, with a variable time bin size depending by the -ray state of the source). The calculation of the DCF uses a DCF binning of 8 days to take into account the biggest time bin size of AGILE light curve, with a scan time lag of 1 day. The UL are converted into flux and related 1 error considering half of the upper limit. The significance level of the peak was determined by simulating AGILE light curves with a bootstrap selection from the original points.
Choosing the right DCF bin size is a trade off between the high accuracy of the correlation coefficient between sets of data of two time series and the resolution in the description of the cross-correlation curve. We have performed tests with different bin sizes of the AGILE light curve (splitting the same flux in smaller bins) and we have tried also different DCF bin sizes with the AGILE original light curve of Figure 3 and 5. In any case we have found that the peak of the DCF depends only weakly on the specific bin size. Due to the bin size of AGILE light curve, we use the DCF only for the determination of the cross-correlation and not for a measurement of a lag between hard-X and -rays.
Correlating hard X-rays and -rays we find a negative correlation with a 3 confidence level between these frequencies compatible with 0 8 days lag.
2.8.2 Correlation with hard X-ray emission
Despite some gaps in the radio data, in particular during the pointing mode observations, several radio flares are evident in the data. We find a positive correlation above the 3 confidence level between the radio and -rays with a lag of 0 8 days. The same consideration reported for the DCF between X-rays and -rays is valid for the correlation between the radio and -rays, and for this reason the DCF is not used for a measurement of the lag.
3 Discussion
The AGILE -ray monitoring of Cyg X-3 contributes in a significant way to the determination of a repetitive pattern of -ray emission and particle acceleration in this microquasar. Several fast (1- or 2-day) -ray flaring episodes are detected in soft X-ray states. Furthermore, persistent and significant -ray emission is detected in AGILE data usually during a low flux in hard X-rays. The most intense -ray emission above 100 MeV distinctively occurs in coincidence with minima of the hard X-ray emission. As we discuss below, on several occasions a radio flare was detected near or after the -ray peak emission. This trend, that was already apparent in (Tavani et al. 2009b, ) and (Abdo et al. 2009b, ), is confirmed by a more extended monitoring over more than 1 year.
The -ray flaring episodes are demonstrated to be even more relevant for understanding the source dynamics when compared to soft X-ray, hard X-ray, and radio data. Fig. 3 and 5 show the -ray datapoints with multifrequency information.
3.1 General characteristics
Observationally, -ray emission from Cyg X-3 starts to be detectable by AGILE when the Swift -BAT hard X-ray flux decreases below a count rate flux of cts. cm-2 s-1, as shown by the data reported in Table 6 and 7 (see Fig. 3 and 5). Furthermore, -ray flaring appears to be occurring during or immediately before sudden X-ray spectral transitions. The -ray flare recorded on MJD 55324 is associated with a spectral transition from hard to soft X-ray emission, although unlike the other detections, it is not coincident with a radio flare.
The reported data show in general an anti-correlation between the and hard X-ray fluxes, and a correlation between the and soft X-ray fluxes444 We notice that occasionally during rapid variations of the X-ray flux the -ray activity increases and becomes detectable at a even outside the soft X-ray state. See the case reported for MJD 55292-55300 and 55362-55370...
Several -ray flares (55001, 55019, 55034) are associated with 1-2 day delayed radio flares at the level of 1 Jy at 15 GHz as detected by AMI-LA. For other -ray flares, the relation with the radio emission is not so obvious, either for lack of radio monitoring (see the episode at MJD 55025), or for the quasi-simultaneous -ray and radio emission (as in MJD 55343, see Fig. 4). However, the majority of Cyg X-3 -ray flares reported here and in (Tavani et al. 2009b, ) appear to follow a trend characterized by a substantial -ray enhancement preceding radio flaring activity by a few days, which is within the formal DCF error bar of 8 days. The -ray flare on MJD 55019 is possibly associated with a -ray harder spectrum compared to other flares.
An interesting case is provided by the event near MJD 55025. A prominent radio flare reaching 4 Jy at 2.1 GHz (RATAN-600) and 1 Jy at 37 GHz (Metsähovi) occurred on MJD 55030, followed by a secondary radio flare with inverted spectrum near MJD 55035 detected by RATAN-600 as well as by AMI-LA and Metsähovi. AGILE data show that a 1-day -ray flare was detected on MJD 55025, i.e., almost 5 days before the strong radio flare. Lack of radio monitoring preceding this flare does not allow us to determine the association of the MJD 55025 -ray flare with other radio flaring activity. In any case, during the 4 days between the -ray and radio flares the overall -ray flux stayed at a low level. In particular, during the radio flare itself that lasted about 3 days, the -ray flux was below near 100 MeV and above.
A sequence of -ray emission immediately followed. On MJD 55034-55035 the -ray flux shows an increase above for E100 MeV followed by 4 days of high level flux and subsequent decay. One day later (MJD 55035 and following days), the “secondary” radio flare with the inverted spectrum was detected reaching 2 Jy at 11.2 GHz. The excellent multi-frequency coverage by our group during this period (MJD 55030-55040) is enhanced by several TeV observations of Cyg X-3 by the MAGIC group Aleksic et al. (2010) followed after an AGILE alert. It is then interesting to note that the MAGIC 95% confidence upper limit of above 250 GeV obtained from a set of observations including those of interest here provide, for the first time for Cyg X-3, simultaneous broad-band spectral information from 100 MeV to TeV energies.
3.2 The -ray spectrum
Fig. 4 shows the -ray spectrum obtained by summing all the major aforementioned episodes during the period 2009 Jun.-Jul. The complex relation between the -ray emission of Cyg X-3 near 100 MeV up to 1 GeV and the X-ray and radio spectrum will be addressed in detail elsewhere. We emphasize here that the AGILE results set interesting constraints on the hardness of the -ray spectrum near 100 MeV. Our measured power-law spectrum is consistent in being “flat”, that is with a power-law index near 2 in the AGILE-GRID energy range. However, we cannot exclude the existence of spectral curvature of the spectrum in the energy range below or near 100 MeV. We address this point as well as the analysis and implications of the measured broad-band spectrum of Cyg X-3 in (Piano et al. in prep, ).
3.3 AGILE and Fermi comparison
We compare our results on Cyg X-3 with those of Fermi-LAT. There is considerable overlap of emission episodes detected by the two missions during the period 2009 Jun.-Jul. Fig. 3 (top panel) shows the AGILE -ray lightcurves of Cyg X-3 with different time bins and the available Fermi-LAT -ray lightcurve (Abdo et al. 2009b, ). The two instruments have a quite different response and daily exposure at energies near 100 MeV, and the daily effective exposure is influenced by solar panel and other geometric constraints of the pointing strategy. Furthermore, for a source of relatively rapidly varying (within one day or shorter timescale) -ray emission such as Cyg X-3, the two instruments can catch different states of emission. The 1-day flaring AGILE-GRID lightcurve generally agrees with the 4-day averaged Fermi-LAT lightcurve. Panel 2 of Fig. 3 shows the MJD 55019 hard -ray episode detected by AGILE (associated with the radio flare of MJD 55021 and ASM X-ray peak) which is not evident in the 4-day average of the corresponding Fermi-LAT data shown in the top panel.
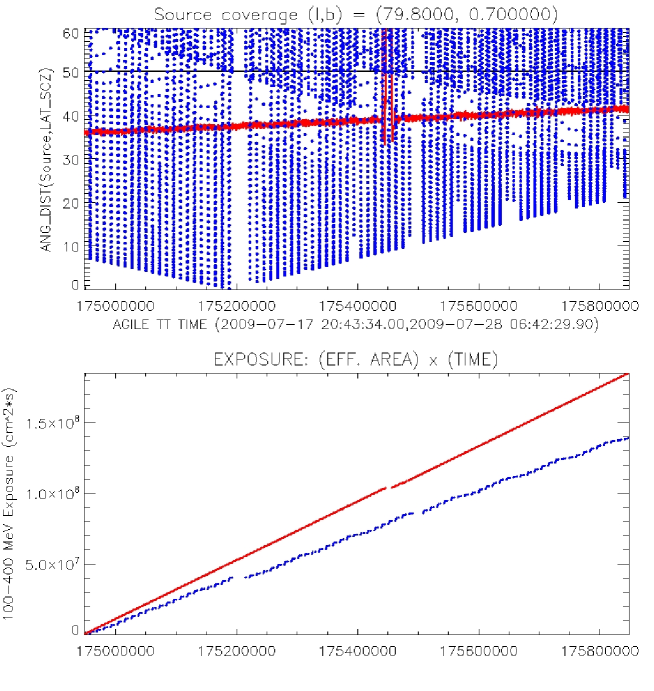
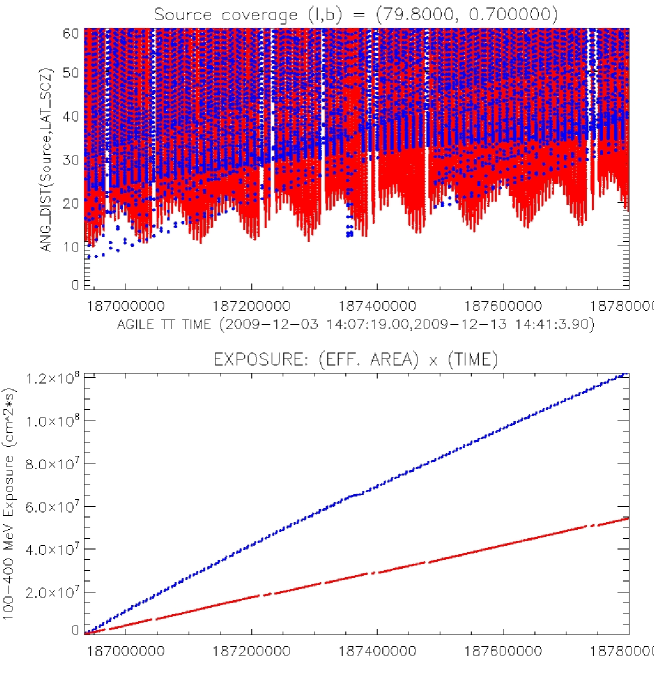
Fig. 7 (top panel) shows the time evolution of the off-axis angle of Cyg X-3 with respect to the instrument boresights of the AGILE-GRID (in red) and Fermi-LAT (in blue) for the 10-day interval covering the period 18-28 July, 2009 with respect to Cyg X-3 position for energies between 100 MeV and 400 MeV. During this interval the position of Cyg X-3 was stable near 30 degree off-axis in the AGILE data. The Fermi-LAT pointing strategy is very different from the AGILE fixed pointing mode strategy, and the Fermi-LAT off-axis angle changes continuously and rapidly for a typical 7-fold sampling of the source every day with a continuous sweep of the pointing direction. This difference in source pointing for Cyg X-3 in July 2009 is clearly shown in the bottom panel of Fig. 7, where the cumulative effective area of AGILE-GRID is greater than the Fermi-LAT (we have used the Pass 6 Version 3 Front photons Instrument Response Function). The cumulative exposure of the two instruments operating with the same pointing strategy with respect to Cyg X-3 position is still comparable (AGILE-GRID effective area is about half that of the Fermi-LAT). Fig. 8 shows the case where AGILE operates in spinning mode.
Both the AGILE-GRID average flux above 100 MeV and spectral index are in good agreement with those reported in the Fermi-LAT First Catalog Abdo et al. (2010) but difficult to reconcile with the results published in Abdo et al. 2009b and (Corbel et al. 2010a, ) who report an average flux above 100 MeV of at the location of Cygnus X-3 outside the active -ray period, consistent with a stable emission. This relatively large flux would have produced a much stronger stable -ray source in the AGILE-GRID data of the Cygnus region.
4 Conclusions
Our present study of the -ray emission from the microquasar Cyg X-3 adds substantially to the information already gathered from the first results of AGILE-GRID (Tavani et al. 2009b, ) and Fermi-LAT (Abdo et al. 2009b, ). We confirm the time variable nature of the extreme particle acceleration in the microquasar Cyg X-3 that manifests itself as -ray emission above 100 MeV.
The overall anticorrelation between the active -ray states of Cyg X-3 and its hard X-ray emission is evident in our data that confirm the conclusions of (Tavani et al. 2009b, ). Both the AGILE pointing and spinning mode observations of the Cygnus region sampled Cyg X-3 in different spectral states, both “hard”, and “soft”. Enhanced -ray emission is definitely produced only during the “soft” spectral states. These states are usually characterized by low values of the radio emission before major radio outbursts occur.
We detected several -ray flaring episodes from Cyg X-3 with fluxes above for photons energies larger than 100 MeV. All these episodes occurred during a low flux in hard X-rays, and were simultaneous with either peak values of the X-ray intensity or low values of the radio flux that typically precede major plasmoid ejections and radio flares. Several episodes of enhanced -ray emission with radio flares were detected (MJD 54998, 55001, 55003, 55007, 55019, 55034, 55343 and possibly 55025). In the majority of cases, (except MJD 55323 that is seems correlated with a fast transition between X-ray states) the -ray emission above 100 MeV precedes or is near the major radio flare during a rapid spectral change transition.
The AGILE monitoring of Cyg X-3 in the spinning mode produced a consistent database with no significant data gaps since 2009 Nov. We have continuously sampled many X-ray state changes. Cyg X-3 stayed in the hard X-ray state most of the time since 2009 Nov. (see Fig. 5), implying a non-detectable -ray emission from Cyg X-3 by AGILE. We finally stress that the AGILE monitoring without temporal gap is crucial for the comprehension of these transient phenomena.
For the first time (around MJD 55000), we witnessed the transition from high to low flux in hard X-ray, with the consequent “ignition” of the -ray emission process. Whether this is really an “ignition” , i.e., an enhanced and very efficient particle acceleration process that start with the -ray production, or a particle and photon transport change of the medium surrounding the Cyg X-3 compact source, is a matter of debate. AGILE will continue to study Cyg X-3 in order to discriminate between theoretical models.
5 Acknowledgements
The AGILE Mission is funded by the Italian Space Agency (ASI) with scientific and programmatic participation by the Italian Institute of Astrophysics (INAF) and the Italian Institute of Nuclear Physics (INFN). Research partially supported through the ASI grants no. I/089/06/2 and I/042/10/0. We acknowledge financial contribution from the agreement ASI-INAF I/009/10/0. The Metsähovi team acknowledges the support from the Academy of Finland for our observing projects (numbers 212656, 210338, and others).
References
- (1)
- (2) Abdo, A.A., et al. (Fermi Collaboration) 2009, Science, 325, 840
- (3) Abdo, A.A., et al. (Fermi Collaboration) 2009, Science, 326, 1512
- Abdo et al. (2010) Abdo, A.A. et al. (Fermi Collaboration) 2010, ApJS 188, 405
- Aleksic et al. (2010) Aleksic J. et al. (MAGIC Collaboration) 2010, ApJ, 721, 843-855
- Argan et al. (2004) Argan, A., et al. 2004, Proc. IEE-NSS, 1, 371
- Barbiellini et al. (2002) Barbiellini, G., et al. 2002, Nucl. Instr. and Meth. A, 490, 146
- Benjamini et al. (1995) Benjamini, Y., Hochberg, Y. 1995, J. R. Stat. Soc. B, 57, 289
- Bulgarelli et al. (2009) Bulgarelli, A., et al. 2008, ASP Conference Series, 411, 362
- Bulgarelli et al. (2010) Bulgarelli, A., et al. 2010, Nucl. Instr. and Meth. A, 614, 213
- (11) Bulgarelli, A., et al., 2011 submitted.
- (12) Bulgarelli, A., et al. 2010, ATel n. 2609
- (13) Bulgarelli, A., et al. 2010, ATel n. 2645
- Camilo et al. (2009) Camilo, F., et al. 2009, ApJ, 705,1 (C09)
- Cattaneo et al. (2011) Cattaneo, P. W., et al. 2011, Proc. of the RICAP 2009, 251
- (16) Chen, A. W., et al. 2011, A&A, 525
- (17) Chen, A. W., et al. 2011b, in prep.
- Chi et al. (1991) Chi X., Wolfendale A.W. 1991, J.Phys.G 17,987
- (19) Corbel, S., et al. 2010, ATel n. 2611
- (20) Corbel, S. and Hays, E. 2010, ATel n. 2646
- Dame et al. (2001) Dame T.M. et al. 2001, ApJ, 547, 792
- Edelson et al. (1988) Edelson, R. A., Krolik, J. H. 1988, ApJ, 333, 646
- Feroci et al. (2007) Feroci, M., et al. 2007, Nucl. Instr. and Meth. A, 581, 728
- Giacconi et al. (1967) Giacconi, R., et al. 1967, ApJ, 148, L119
- Grove et al. (2008) Grove, E., et al. 2008, ATel n. 1850
- Halpern et al. (2008) Halpern, J.P., et al. 2008, ApJ, 688, L33
- Hjalmarsdotter et al. (2009) Hjalmarsdotter, L., Zdziarski, A.A., Szostek, A., Hannikainen, D.C. 2009, MNRAS, 392, 251
- Kalberla et al. (2005) Kalberla, P. M. W. , et al. 2005, AA , 440:775–782
- Koljonen et al. (2010) Koljonen, K.I.I., Hannikainen, D.C., McCollough, M.L., Pooley, G., Trushkin, S.A. 2010, MNRAS, 406, 307
- Labanti et al. (2006) Labanti, C., et al. 2006, Nuclear Physics B Proc. Suppl., 150, 34
- Giuliani et al. (2004) Giuliani, A., et al. 2004, Memorie della Societa Astronomica Italiana Supplementi, 5, 135
- Giuliani et al. (2006) Giuliani, A., et al. 2006, Nucl. Instr. and Meth. A, 568, 692
- Hopkins et al. (2002) Hopkins, A.M., et al. 2002, AJ, 123, 1086
- Mason et al. (1986) Mason, K.O., Cordova, F.A., and White, N.E. 1986, ApJ, 309, 700
- Mattox et al. (1996) Mattox, J. R., et al. 1996, ApJ, 461, 396
- Mattox et al. (2001) Mattox, J. R., Hartman, R. C., Reimer, O. 2001, ApJ, 135, 155
- McCollough et al. (1999) McCollough, M.L., et al. 1999, ApJ, 517, 951
- McLaughlin et al. (1996) McLaughlin, M. A. , et al. 1996, ApJ, 473(2):763
- Miller et al. (2001) Miller, C. J. et al. 2001, ApJ, 122, 349
- Mioduszewski et al. (2001) Mioduszewski A.J., Rupen, M.P., Hjellming, R.M., Pooley, G.G. 2001, ApJ, 553, 766
- Molnar et al. (1988) Molnar, L.A., Reid, M.J., and Grindlay, J.E. 1988, ApJ, 331, 494
- Parsignault et al. (1972) Parsignault, D.R., Gurski, H., Kellog, E.M., et al. 1972, Nature, 239, 123
- Perotti et al. (2006) Perotti, F., et al. 2006, Nucl. Instr. and Meth. A, 556, 228
- (44) Piano, G., et al., in prep.
- Pittori et al. (2009) Pittori, C., et al. 2009, AA , 506, 1563.
- Prest et al. (2003) Prest, M., et al. 2003, Nucl. Instr. and Meth. A, 501, 280.
- Sabatini et al. (2010) Sabatini, S., et al. 2010, ApJ, 712, L10–L15.
- Sanford et al. (1972) Sanford, P. W. and Hawkins, F. H. 1972, Nature Phys Sci, 239, 135
- Szostek et al. (2008) Szostek, A., Zdziarski, A.A., McCollough, M.L. 2008, MNRAS, 388, 1001
- (50) Tavani, M., et al. 2009a, AA , 520, 995
- (51) Tavani, M., et al. 2009b, Nature, 462, 620
- van Kerkwijk et al. (1992) van Kerkwijk, M.H., Charles, P.A., Geballe, T.R., et al. 1992, Nature, 355, 703
- van Kerkwijk et al. (1996) van Kerkwijk, M.H., Geballe, T.R., King, D.L., van der Klis, M., van Paradijs, J. 1996, AA , 314, 521
- Vilhu et al. (2009) Vilhu, O. Hakala, P., Hannikainen, D., McCollough, M., & Koljonen, K. 2009, A&A, 501, 679
- Williams et al. (2011) Williams, P. K. G., et al. 2011, ApJ, 733:L20
- Zdziarski & Gierlinski (2004) Zdziarski, A.A. & Gierlinski, M. 2004, Prog. Theor. Phys. Suppl., 155, 99