Vol.0 (200x) No.0, 000–000
22institutetext: Key Laboratory for the Structure and Evolution of Celestial Objects, Chinese Academy of Sciences, Kunming 650011, China
33institutetext: Graduate School of Chinese Academy of Sciences, Beijing 100049, China
The surge-like eruption of a miniature filament
Abstract
We report on the rare eruption of a miniature H filament that took a surge form. The filament first underwent a full development within 46 minutes and then began to erupt 9 minutes later, followed by a compact, impulsive X-ray class M2.2 flare with a two-ribbon nature only at the early eruption phase. During the eruption, its top rose, whereas the two legs remained rooted in the chromosphere and swelled little perpendicular to the rising direction. This led to a surge-like eruption with a narrow angular extent. Similar to the recent observations for standard and blowout X-ray jets by Moore et al., we thus define it as a “blowout H surge”. Furthermore, our observations showed that the eruption was associated with (1) a coronal mass ejection guided by a preexisting streamer, (2) abrupt, significant, and persistent changes in the photospheric magnetic field around the filament, and (3) sudden disappearance of a small pore. These observations thus provide evidence that blowout surge is a small-scale version of large-scale filament eruption in many aspects. Our observations further suggest that at least part of H surges belong to blowout-type ones, and exact distinction between standard and blowout H surges is important in understanding their different origins and associated eruptive phenomena.
keywords:
Sun: activity — Sun: filaments — Sun: flares — Sun: magnetic field — Sun: coronal mass ejections (CMEs)1 Introduction
Solar filaments show some common characteristics in a broad spectrum of scales. Along the polarity inversion zone between adjacent opposite-polarity photospheric field on the quiet Sun, miniature filaments are the small-scale analog to large-scale ones. Hermans & Martin (1986) concluded that their eruptions appear to be the counterparts of large-scale filament eruptions, which are usually associated with two-ribbon flares and coronal mass ejections (CMEs). Wang et al. (2000) have shown that miniature filaments have a mean lifetime of only 50 minutes, and their eruptions can take varying forms but almost all are accompanied by tiny flares, with spatial patterns very similar to two-ribbon/multiribbon flares in large-scale filament eruptions. Sakajiri et al. (2004) and Ren et al. (2008) also suggested that small- and large-scale filament eruptions have common properties. Therefore, it is reasonable to expect that some small-scale filament eruptions can also relate to CMEs (Innes et al. 2009; Schrijver 2010) and should be explained in the framework of the “standard model” for solar eruptions, in which overlying arcade erupts, producing a flare along with an ejecting filament. However, Wang et al. (2000) showed that most miniature filaments are erupted toward nearby strong network elements, meaning that perhaps most of their mass is transported to other magnetic structures rather than ejected into corona. Therefore, questions are naturally raised: is the mass transport along pre-existing magnetic force lines? Can small-scale filament eruptions be strong enough to escape into the heliosphere? Detailed observations of small-scale filament eruptions could help to answer these questions.
Strongly related dynamical phenomena that can be closely associated with CMEs are plasma ejections following open or far-reaching field lines, which show up as surges in H and jets in EUV and X-ray. H surges are straight or slightly curved mass ejections stretching out and away from small flares at the footpoints in the chromosphere into coronal heights (Roy 1973; Bruzek & Durrant 1977), and it is believed that they are produced by reconnection between emerging flux and ambient open or far-reaching magnetic structures (Schmieder, Van Driel-Gesztelyi, & Freeland 1995; Canfield et al. 1996; Jiang et al. 2007; Madjarska et al. 2007; Chifor et al. 2008; Moreno-Insertis et al. 2008; Patsourakos et al. 2008; Pariat, Antiochos, & DeVore 2010; Jiang et al. 2011; Yang et al. 2011). Therefore, surges have quite different physical processes and scenarios from those of small filament eruptions. However, some observations have showed that both of them can be related to the same kind of eruptive phenomena, specially “narrow CMEs” with angular widths of about 15\degr or less and impulsive solar energetic particle (SEP) events. Gilbert et al. (2001) concluded that 15 narrow CMEs originate in regions of closed magnetic fields since they have a high association with filaments, but Dobrzycka et al. (2003) cannot definitively determine whether they origin from jets or filament eruptions. Liu (2008) showed that large jetlike/diffuse H surges are associated with jetlike/wide-angle CMEs. It is noted that, however, their H data might have inadequate spatial resolution to tell us whether the surge bases include tiny filaments or not. Meanwhile, when white-light jets can be accompanied by either EUV bright points (Paraschiv et al. 2010) or filament eruptions (Wang & Sheeley 2002), impulsive SEP events can also be closely associated with EUV and corresponding white-light jets that involve open field lines (Wang, Pick, & Mason 2006), as well as with motions that look like filament eruptions (Nitta et al. 2006). In order to get a clear physical picture of these eruptive phenomena, it is clear that a definitive distinction of their different origins is desired.
On the other hand, some observations indeed presented evidence that plasma ejections can be physically related with some kinds of activations or eruptions of small filaments. Chae et al.(1999) first reported that H surges, EUV jets, and associated microflares were preceded by a small filament eruption. Zuccarello et al.(2007) showed that the destabilization and disappearance of a small short-lived filament followed two H surges pouring sequentially from part of the filament body. Consistent with previous results (Yamauchi et al. (2005), in particular, Moore et al. (2010) found that in the polar coronal holes (CHs) two thirds of X-ray jets are standard ones that fit the standard reconnection picture for coronal jets, while other one third are so-called blowout jets in which the jet-base magnetic arch, often carrying a filament, undergoes a miniature version of the blowout eruptions that produce major CMEs. Similarly, Raouafi et al. (2010) showed that coronal jets can erupt from coronal micro-sigmoids, and Nisticò et al. (2009) also found some micro-CME-type jet events resembling the classical CMEs. Quite recently, Hong et al. (2011) and Zheng et al. (2011) indeed showed that miniature filament eruptions can lead to blowout jets and small CMEs. Therefore, at least part of plasma ejections are originated from small-scale filament eruptions, and high-resolution observations are needed to understand the possible relation between them or to distinguish them from each other. Similar to the cases in large-scale filament eruptions, in addition, a few examples clearly suggested that flux emergence and cancelation play an important role in disturbing small filaments (Hermans & Martin 1986; Sakajiri et al. 2004; Ren et al. 2008; Hong et al. 2011). It thus appears that small filament eruptions have similar exterior driving agents to that of surges or jets (Yoshimura, Kurokawa, & Shine 2003; Jiang et al. 2007). Like the cases occurring in some major flares (Wang et al. 2002b; Sudol & Harvey 2005; Petrie & Sudol 2010; Wang & Liu 2010), an abrupt, significant, and persistent change in photospheric magnetic field was also found in a CME-associated H mass ejecta event (Uddin et al. 2004; Li et al. 2005). Therefore, it is probable that such extreme change could also take place in small-scale filament eruptions, and detailed magnetic filed observations could help in verifying this possibility.
On 2001 March 27, a surge-shaped eruption occurred in AR 9401 (N21\degr, E33\degr), and was associated with a compact impulsive flare, a CME, and especially, a sudden and permanent change of magnetic field and disappearance of a small pore. High-resolution H observations from Big Bear Solar Observatory (BBSO) help us to find that it was in fact a small-scale filament eruption. Due to the short filament lifetime, the complete process from its formation to eruption was observed, hence provided us with the opportunity to investigate why the eruption took a surge form and its relationship with the CME and photospheric field activity.
2 Observations
The eruption was well covered by full-disk H line-center observations from BBSO, with a 1-minute image cadence and a pixel size of roughly . The magnetic field configuration of the eruptive region was examined using full-disk magnetograms and continuum intensity images from the Michelson Doppler Imager (MDI; Scherrer et al. 1995) aboard the Solar and Heliospheric Observatory (SOHO). The magnetograms have a 1-minute cadence and a pixel size of , while continuum images only have a 96-minute cadence. The MDI data are obtained from nine filtergrams taken in five different position in the Ni i 6768 Å absorption line in right- and left-circularly polarized light, and the continuum intensity is estimated from a filtergram averaging narrowband signals from both sides outside the line. The full-disk BBSO to MDI co-alignment was done by fitting the solar limbs, with an accuracy of about .
This eruption was also examined by using of full-disk EUV observations from the Extreme Ultraviolet Telescope (EIT; Delaboudinière et al. 1995) on SOHO. The 12-minute cadence 195 Å images were obtained for the study with a pixel resolution of . To identify the associated CME, we used the C2 and C3 white-light coronagraph data from the Large Angle and Spectrometric Coronagraphs (LASCO; Brueckner et al. 1995) on SOHO, as well as the CME height-time data that is available in the LASCO Web site. Finally, we used soft X-ray light curves observed by the Geostationary Operational Environmental Satellite (GOES) to track the time of the flare.
3 Results
The surge-like solar eruption was accompanied by a flare of H importance 1N and X-ray class M2.2, which GOES recorded its start, peak, and end times around 16:25, 16:30, and 16:32 UT, respectively. Fig. 1 presents BBSO H line-center images to show the morphological evolution of the event. To aid matching, an MDI magnetogram is given in the first frame. The H flare appeared as a compact one. It started to brighten slightly prior to the GOES flare start time, increased in size, flared through the period of the GOES flare, quickly faded away, and finally disappeared after about 16:40 UT. Therefore, the flare behaved as a compact, impulsive one with a total duration of only 7 minutes. A striking characteristic of the event is that a surge-like mass ejection occurred in the course of the flare, which showed up as extended linear structures with much larger size than that of the compact flare patch. When the GOES flare started (16:25 UT), a single bright structure (indicated by the white arrow) was first ejected from the flare patch. By the GOES flare peak time (16:30 UT), however, the bright structure clearly evolved into a narrow bright loop (indicated by the white arrow) with two legs, ‘1’ and ‘2’ (indicated by the two black arrows). The leg 2 quickly became ambiguous, while the leg 1 largely lengthened towards the northeastern direction and showed slightly curved triangular shape, thus remarkably displayed as a surge (Kurokawa & Kawai 1993). Beginning at about 16:37 UT after the GOES flare ended, two dark components, also labeled as ‘1’ and ‘2’, grew nearly along the same trajectories of the two bright legs (indicated by the two black arrows). When the dark 1 gradually grew to occupy the whole path of the bright 1, the dark 2 underwent a larger development than that of the bright one. It is possible that the dark components were caused by the cooling of earlier, brighter components since they were co-spatial and sheared the same paths. Then the two dark components gradually faded away and became invisible after about 16:55 UT.
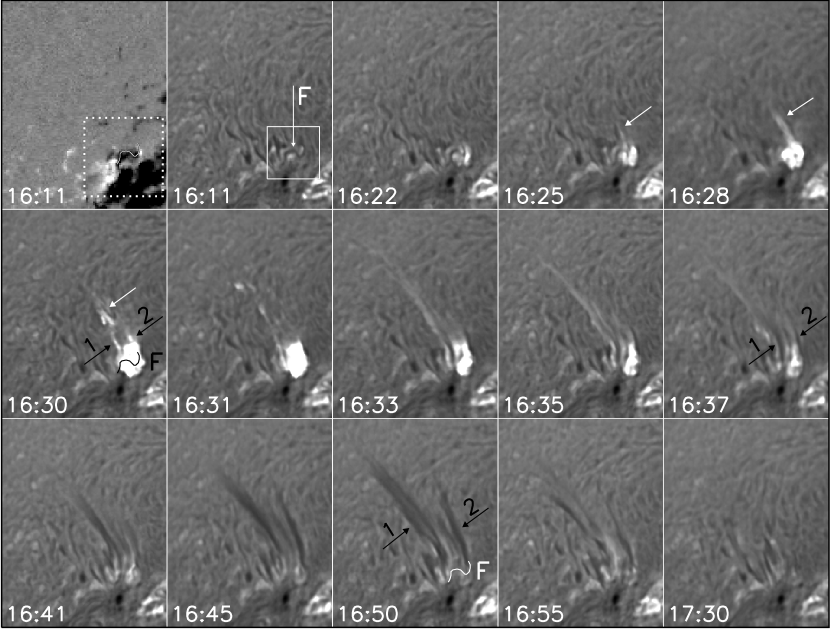
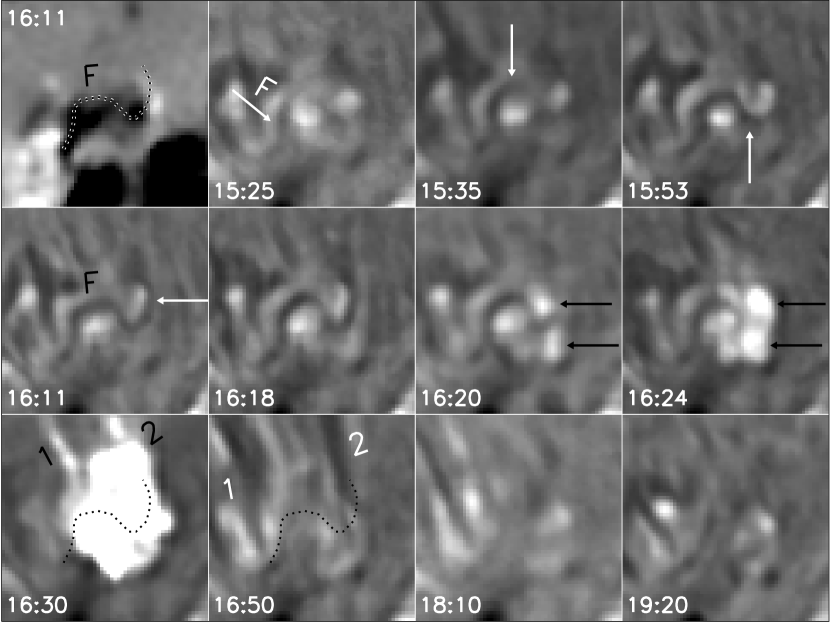
Since H surges can be entirely in emission and dark surges can be preceded by bright ones (Švestka, Farnik, & Tang, 1990), at first glance, the above morphological characteristic of the eruption gives us an impression that this was a surge activity consisting of both bright and dark components, which occurred one after another, first bright then dark. Thanks to the high-resolution H observations, however, we can remark by chance that there existed a tiny filament, ‘F’, at the flare site before the eruption (see the 16:11 UT frame in Fig. 1). Moreover, we found that the legs 1 and 2 were coincided with those of the erupting F (see the 16:30 and 16:50 UT frames in Fig. 1). Therefore, it is very likely that the surge-like ejection was come from the F eruption. This motivates us to further investigate the F evolution in details. Fortunately, BBSO’s observations covered the key process of the F formation and eruption. This is shown by the close-up view of F in Fig. 2. When BBSO’s observations started at 15:25 UT, F was seen as a very small dark feature nearly residing above a magnetic polarity reversal boundary between adjacent opposite-polarity photospheric field. In less than 1 hr, it grew toward the west with a curved path along the polarity reversal boundary (indicated by the white arrows), and by about 16:11 UT, reached its maximum extent with a length of about 3.86 km, about two times as long as miniature filaments with an average projected length of 1.9 km (Wang et al. 2000). Therefore, F was a somewhat larger miniature filament. It is of interest to note that at this time it exhibited an inverse-S shape, consistent with the preferential pattern of dextral filament in the northern hemisphere (Pevtsov et al. 2003). But soon afterwards, its westernmost part began to disappear and two bright patches appeared at its two sides just before the GOES flare started (indicated by the black arrows in the 16:20 and 16:24 UT images). This is consistent with Kahler et al. (1988) that filaments began to erupt before the starting times of associated flares. Finally, the entire F quickly became invisible along with the area increase of the flare. Since F did not recover from such disappearance in the following 2h even when the flare completely faded away, we can conclude that it really underwent an overall violent eruption rather than was simply covered and obscured by the flare emission. It is noted that there were some filament-like dark features around F that were disturbed or even partially disappeared during the eruption. By carefully examining the erupting process, however, it is found that the legs 1 and 2 did not belong to them but just were the two legs of the erupting F. This is clearly indicated by the 16:30 and 16:50 UT H images, where the outlines of F’s axis at 16:11 UT were superposed as dashed lines. Therefore, the surge-like ejection was simply originated from the F eruption at its base in a narrow way: when its two ends were fixed in the chromosphere, its top quickly lifted up but its axis only had a little swelling or expanding perpendicular to the rising direction (also see Fig. 1). This mean that they were the same phenomenon, i.e., a filament eruption taking a surge form (Nisticò et al. 2009; Moore et al. 2010; Raouafi et al. 2010; Hong et al. 2011).
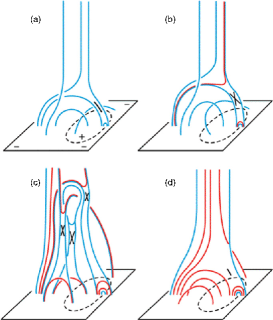
The schematic shown in Figure 3, a copy of Figure 10 in Moore et al. (2010), depicts the scenario for the productions of both standard and blowout jets. The magnetic field setup for both cases is the same that a compact, low-arching bipolar field emerges into a pre-existing, high-reaching, unipolar CH field with negative polarity, thus forms a neutral line surrounding the positive base of the emerging bipole, as well as a current sheet at the interface between the ambient field and its positive-leg (Fig. 3a). If the emerging-arch field has no appreciable shear or twist in it, magnetic reconnection at the current sheet creates a miniature-flare-arcade bight point over the west-side neutral line below the reconnection X-point, as well as a standard X-ray jet with a single-strand spire whipping out of the top side of the reconnection X-point (Fig. 3b). The eruption process then finishes, the field relaxes down to Fig. 3a configuration and the emerging arch to the east of the new reconnection loop in Fig. 3b remains stable. In the blowout jet case, however, an essential difference is that the core field of the emerging bipolar arch is so strongly sheared and twisted that it often shows up as a small filament and has enough free energy to drive a blowout of the arch: the emerging arch becomes destabilized by the earlier dynamics and thus triggers a blowout eruption of the sheared core field as in a filament eruption. As depicted in Fig. 3c, reconnection then occurs at three places that can result in a blowout X-ray jet with a multi-stranded curtain-like appearance (see Moore et al. (2010) for details of the blowout jet eruption process). Significantly, the blowout jet has a substantially larger horizontal size span than that of the standard jet. Finally, the jet narrows and the field configuration relaxes down to the initial state of Fig. 3a (Fig. 3d). It is difficult to make an one-to-one comparison between the above scenario and our event because no soft X-ray or high-resolution EUV imaging observations is available and the magnetic field environment is also different from that described by Moore et al. (2010) in coronal holes. However, two factors make us believe that our H surge was clearly not a standard one. One is that it was originated from the small F eruption, and the other is that its 1 and 2 components quite resembled the curtain-like blowout jet rather than single-strand spire of Moore et al. (2010). Therefore, we can introduce a new term and call it “blowout H surge”. It is interesting to note that the 1 and 2 features in our event were very similar to a pair of thin ejections at the leg locations of a spicule-associated blowout jet from an eruption of relatively cool material in the event shown by Sterling, Harra, & Moore (2010). Taking 16:20 UT as the start time of the F eruption, F had a lifetime of about 55 minutes from its first formation (15:25 UT) through the eruption. This was well consistent with the 50-minute mean lifetime of miniature erupting filaments given by Wang et al. (2000). Similar to a case studied by Sakajiri et al. (2004), in which a miniature filament erupted 25 minutes after its first formation, we see that there was an interval of only 9 minutes between the F eruption start and its full development (16:11 UT). It is clear that the flare was preceded by such an eruption. Although the flare at the main phase was too compact to discern its two ribbons and separating motion (possibly due to the small size of F), similar to the situation in compact flares observed by Tang (1985), the small H brightenings at the initial F eruption phase clearly showed a two-ribbon nature. Consistent with some previous observations (Wang et al. 2000; Sakajiri et al. 2004; Ren et al. 2008; Hong et al. 2011), therefore, we believe that the F eruption was a small-scale version of active-region or quiet-region large-scale filament eruptions and the flare was a direct result of such a small-scale eruption.
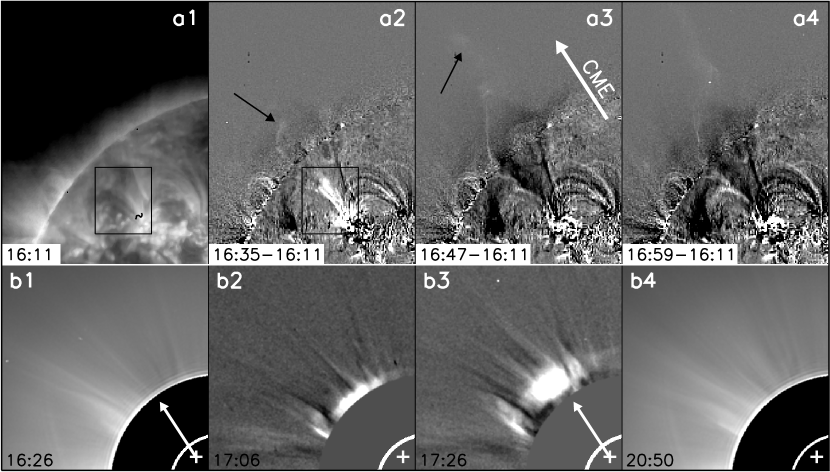
The eruption can be traced going beyond the northeast limb in EIT observations, and was closely associated with a CME observed by LASCO. This is quite obvious in the EIT 195 Å and LASCO C2 images presented in Fig. 4. At 16:35 UT, although there was a thick, nearly straight, jet-shaped bright EUV feature responding to the H surge-like bright structure (see Fig. 1) on the solar disk (included in the black box), the top part of the erupting F had indeed ejected beyond the solar limb and showed a curved loop-like shape (indicated by the black arrow). It can still be clearly discernible at 16:47 UT but then sprayed out the field-of-view (FOV) of EIT after 16:59 UT. Therefore, the EIT observation further confirmed that this was a filament eruption event. The associated CME first appeared in the LASCO C2 FOV at 17:06 UT as a ragged ejection in the northeastern direction that traveled along a thin streamer. It had a width of 66\degr and a central position angle (P.A.) of 46\degr. As indicated by the white arrows, the CME’s eruption direction determined from the central P.A. was along the streamer and consistent with that of the erupting F. It is noteworthy that the streamer was only slightly altered after the passage of the CME (see panels b1 and b4), which was similar to the cases of streamer-puff and over-and-out CMEs recently studied by Bemporad et al.(2005), Moore & Sterling (2007), and Jiang et al. (2009). The height-time (H-T) plot of the CME front at P.A. 38\degr is shown in Fig. 5. By applying second-order polynomial fitting, back extrapolation of the CME front from the H-T plots to the eruptive location yields an estimate of the CME onset time near 16:17 UT, which is very close to the start time of the F eruption at 16:20 UT, as well as the start time of the flare at 16:25 UT. The spatial and temporal consistencies strongly suggest that the CME initiation was closely related to the F eruption. In addition, the application of first- and second-order polynomial fitting to the H-T points gives an average speed of 342 km and an acceleration of -6.2 m . These parameters showed that the CME was a slow one, consistent with the results of that slow CMEs are more often found associated with filament eruptions (Sheeley et al. 1999; St. Cyr et al. 2000). It is noted that the CME front speed is very close to the average F speed of about 344 km estimated from 16:20 to 16:47 UT, and two H-T points of the erupting F at 16:35 and 16:47 UT plotted in Fig. 5 are also close to the extrapolated curves of the CME front, implying the tight relationship between the F eruption and the CME. From 16:25 to 16:31 UT, however, we can exactly determine the top sites of the erupting F in H observations (see Fig. 1), and an average speed (acceleration) of about 151.8 km (1.4m ) is given. In accordance with the result of Zhang et al. (2001), these values indicate that F possibly underwent a large acceleration at its early eruption phase. As compared with the very small F size, however, we would like to point out that the CME had much larger scale. Therefore, the F eruption and the H surge might only serve as a trigger and occupy a small part of the CME. Further observations are necessary to clarify such possibility.

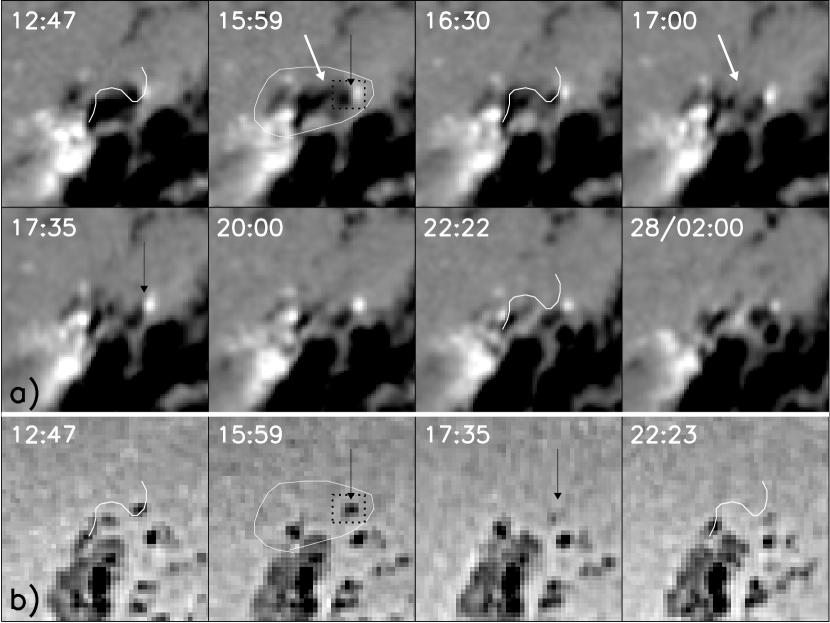
By further examining MDI observations, we found that the F eruption was correlated with a distinct photospheric activity below it. Fig. 6 shows the MDI magnetograms and continuum images around the eruptive region. At first view, it is quite clear that the area of a negative-polarity flux patch at the southern side of F greatly decreased after the eruption (indicated by the white arrows). More strikingly, a small pore just under the western part of F underwent a sudden disappearance (indicated by the black arrows). The pore was clearly seen at 15:59 UT before the eruption while it almost completely disappeared in the next available MDI intensity image at 17:35 UT. Such disappearance thus took place in a timescale of less than 100 minutes. Interestingly, it showed a configuration by making a comparison between the 15:59 UT magnetogram and continuum image. The flux changes in an area containing the eruptive F (indicated by the white contours) and in a smaller area only including the disappearing pore (indicated by the black dashed boxes) are measured and plotted in Fig. 7, and the GOES-8 1-8 Å soft X-ray flux profile is also overplotted to indicate the flare time. After the flare start, we see that the negative flux in the contour (box) area had an abrupt decrease on the order of 4.5 Mx (1.7 Mx) within the flare duration of only 7 minutes, i.e., impulsively dropped about 20% (34.7%), which gives an average flux loss rate of about 1.1 Mx (4.0 Mx). In the following several hours, the change of the negative flux only showed a simple tendency of continuous decrease, and had no indication of a return to the pre-flare condition, indicating that such an impulsive flux loss was permanent, not transient, and thus was not due to the flare emission. We also note that the surrounding positive flux only changed a little relative to the negative flux during the flare. Therefore, the changes of opposite-polarity flux in the contour (box) area were not simultaneous and seemingly not balanced.

4 Conclusions and discussion
By means of high-resolution observations, the event was identified as a surge-like eruption of the miniature filament F, i.e., a blowout surge, instead of a standard surge according to the following observations. (1) F divided opposite-polarity photospheric magnetic field around the AR’s northern periphery. (2) The eruption was followed by a compact, impulsive flare. In the early eruption phase, however, the initial flare brightenings had two ribbons. (3) The evolution timescales of F, from its formation to full development through eventual eruption, was similar to those in previous studies. (4) The two legs of the erupting F were spatially consistent with the two ends of the pre-eruption F. Our observations further showed that the blowout surge was closely associated with the CME along a preexisting streamer. Therefore, these observations strongly indicated that the blowout surge, a filament eruption taking a surge form, was a small-scale version of the large-scale filament eruptions, with the exception of the small time and space scales (Nisticò et al. 2009; Moore et al. 2010; Raouafi et al. 2010; Hong et al. 2011).
An important aspect of the event is that, despite of the very small size of F, its eruption and the following M2.2 flare were temporally and spatially relevant to a common characteristic of photospheric activity in major flares previously observed by some authors (Kosovichev & Zharkova 1999; Wang et al. 2002b; Meunier & Kosovichev 2003; Li, Ding, & Liu 2005; Liu et al. 2005; Sudol & Harvey 2005; Wang & Liu 2010; Li et al. 2011), i.e., the sudden, significant, and persistent decrease in negative flux on the order of 4.5 Mx and on a timescale of 7 minutes. As suggested by Sudol & Harvey (2005), similar changes are ubiquitous features of X-class flares and most likely resulted from that the magnetic field changes direction rather than strength, suggesting that they are consequences rather than trigger of the flares. If so, the observed changes of magnetic field in our example were probably due to that the field lines were pulled or relaxed upward by the erupting F (also see Deng et al. 2005, Wang et al. 2005, and Hudson et al. 2008). As for the puzzling signature of changes of flux imbalance in two polarities, although some possible explanations were offered and discussed (Wang et al. 2002a; Wang et al. 2002b; Liu et al. 2003), we also believe that it was mainly associated with such changes in the magnetic field direction. Another rare phenomenon in this example is that during the rapid flux changes a small pore nearly disappeared in less than 100 minutes. Only one example of Wang et al. (2002a) has demonstrated that a flare can be associated with complete disappearance of a small sunspot in short period, thus our event gives another clear example of that similar pore disappearance can also occur in a blowout surge.
Another key question concerning the event is why F erupted in a surge form? Since formation, maintenance, and instability of F should be controlled by its magnetic field environment (Martin 1990), we can tentatively consider the following three factors. First, the very small size of the F is a main element, which leads it to erupt in a narrow angular extent. We see that the erupting F showed a large rising height relative to the width between its two legs. Second, the eruption is strong enough to open its overlying coronal arcade and escape out into the heliosphere, which is indicated by the occurrence of the following flare and CME. This is clearly different from the cases observed by Wang et al. (2000), in which the most miniature erupting filaments are expelled to new locations. Note that all the miniature filaments of Wang et al. (2000) were on the quiet Sun with low magnetic flux density, while in our example F was located in a region with relatively high flux density. Therefore, it is naturally expected that a small change in the stronger magnetic field might be enough to influence the topology and stability of the F field in a violent manner and lead to a strong eruption (Gaizauskas 1989). Finally, there exists a guiding magnetic field with a twofold functions to channel the F eruption and restrain its lateral swelling. The CME along the streamer suggested that the F eruption from the streamer base should be guided by its open field component. This is very similar to that occurring in standard surges, which could also be ejected along either open magnetic fields or closed large loops. It is noteworthy that, however, the physical scenarios of standard and blowout surges are different. As shown in Fig. 3, magnetic reconnection only occurs between the guiding field and the closed magnetic field of new emerging flux in the standard surge case, while in the blowout surge case reconnection might occur at different places (Moore et al. 2010). Therefore, a clear distinction between standard and blowout surges by using of high-resolution observations is necessary to understand their physical natures and the origin of associated eruptive phenomena. We can imagine that if we only have H observations with poorer spatial resolution, the blowout surge in this example will be readily regarded as a standard one, and thus might lead to misunderstand the origin of the associated CME. Even though the spatial resolution of our observations is high enough, the two phenomena are so easily mistakable for each other that we should differentiate them with great care. It is anticipated that observations from the Solar Dynamics Observatory (SDO) would be great beneficial in this problem.
Acknowledgements.
We thank an anonymous referee for many constructive suggestions and thoughtful comments that helped to improve the clarity and quality of this paper. We are grateful to the observing staff at BBSO for making good observations. We thank the SOHO/MDI, EIT and LASCO teams for data support. This work is supported by the 973 Program (2011CB811400) and by the Natural Science Foundation of China under grants 10973038 and 11173058.References
- [2005] Bemporad, A., Sterling, A. C., & Moore, R. L. et al., 2005, ApJ, 635, L189
- [1995] Brueckner, G. E. et al., 1995, Sol. Phys., 162, 357
- [1977] Bruzek, A. & Durrant, C. J., 1977, Illustrated Glossary for Solar and Solar-Terrestrial Physics (Astrophysics and Space Science Library, Vol. 69; Dordrecht: Reidel)
- [1996] Canfield, R. C., Peardon, K. P., & Leka, K. D. et al., 1996, ApJ, 464, 1016
- [1999] Chae, J., Qiu, J., & Wang, H. et al., 1999, ApJ, 513, L75
- [2008] Chifor, C., Young, P. R., & Isobe, H. et al., 2008, A&A, 481, L57
- [1995] Delaboudinière, J. -P. et al., 1995, Sol. Phys., 162, 291
- [2005] Deng, N., Liu, C., & Yang, G. et al., 2005, ApJ, 623, 1195
- [2003] Dobrzycka, D., Raymond, J. C., & Biesecker, D. A. et al., 2003, ApJ, 588, 586
- [1989] Gaizauskas, V., 1989, Sol. Phys., 121, 135
- [2001] Gilbert, H. R., Serex, E. C., & Holzer, T. E. et al., 2001, ApJ, 550, 1093
- [1986] Hermans, L. M., & Martin, S. R., 1986, in NASA CP-2442, Coronal and Prominence Plasma, ed., A. I. Poland, 369
- [2011] Hong, J., Jiang, Y., & Zheng, R. et al., 2011, ApJ, 738, L20
- [2008] Hudson, H. S., Fisher, G. H., & Welsch, B. T., 2008, in ASP Conf. Ser., Vol. 383, Subsurface and atmospheric influences in solar activity, eds., R. Howe et al. (San Francisco: ASP), 221
- [2009] Innes, D. E., Genetelli, A., & Attie, R. et al., 2009, A&A, 495, 319
- [2011] Jiang, R.-L., Shibata, K., Isobe, H., & Fang, C. 2011, \raa, 11, 701
- [2007] Jiang, Y., Chen, H., & Li, K. et al., 2007, A&A, 469, 331
- [2009] Jiang, Y., Yang, J., & Zheng, R. et al., 2009, ApJ, 693, 1851
- [1988] Kahler, S. W., Moore, R. L., & Kane, S. R. et al., 1988, ApJ, 328, 824
- [1999] Kosovichev, A. G., & Zharkova, V. V., 1999, Sol. Phys., 190, 45
- [1993] Kurokawa, H., & Kawai, G., 1993, in ASP Conf. Ser., Vol. 46, The magnetic and velocity fields of solar active region, eds., H. Zirin, G. Ai & H. Wang (San Francisco: ASP), 507
- [2005] Li, J. P., Ding, M. D., & Liu, Y., 2005, Sol. Phys., 229, 115
- [2011] Li, Y., Jing, J., & Fan, Y. et al., 2011, ApJ, 727, L19
- [2005] Liu, C., Deng, N., & Liu, Y. et al., 2005, ApJ, 622, 722
- [2008] Liu, Y., 2008, Sol. Phys., 249, 75
- [2003] Liu, Y., Jiang, Y., & Ji, H. et al., 2003, ApJ, 593, L137
- [2007] Madjarska, M. S., Doyle, J. G., & Innes, D. E. et al., 2007, ApJ, 670, L57
- [1990] Martin, S. F., 1990, in IAU Colloquium, vol. 117, eds., V. Ruzdjak, & E. Tandberg-Hanssen (Spring-Verlag: New York), 1
- [2003] Meunier, N., & Kosovichev, A., 2003, A&A, 412, 541
- [2010] Moore, R. L., Cirtain, J. W., & Sterling, A. C. et al., 2010, ApJ, 720, 757
- [2007] Moore, R. L., & Sterling, A. C., 2007, ApJ, 661, 543
- [2008] Moreno-Insertis, F., Galsgaard, K., & Ugarte-Urra, I., 2008, ApJ, 673, L211
- [2009] Nisticò, G., Bothmer, V., & Patsourakos, S. et al., 2009, Sol. Phys., 259, 87
- [2006] Nitta, N. V., Reames, D. V., & DeRosa, M. L. et al., 2006, ApJ, 650, 438
- [2010] Paraschiv, A. R., Lacatus, D. A., & Badescu, T. et al., 2010, Sol. Phys., 264, 365
- [2010] Pariat, E., Antiochos, S. K., & DeVore, C. R., 2010, ApJ, 714, 1762
- [2008] Patsourakos, S., Pariat, E., & Vourlidas, A. et al., 2008, ApJ, 680, L73
- [2010] Petrie, G. J. D., & Sudol, J. J., 2010, ApJ, 724, 1218
- [2003] Pevtsov, A. A., Balasubramaniam, K. S., & Rogers, J. W., 2003, ApJ, 595, 500
- [2010] Raouafi, N. -E., Georgoulis, M. K., & Rust, D. M. et al., 2010, ApJ, 718, 981
- [2008] Ren, D., Jiang, Y., & Yang, J. et al., 2008, Ap&SS, 318, 141
- [1973] Roy, J.-R., 1973, Sol. Phys., 28, 95
- [2004] Sakajiri, T., Brooks, D. H., & Yamamoto, T. et al., 2004, ApJ, 616, 578
- [1995] Scherrer, P. H. et al., 1995, Sol. Phys., 162, 129
- [1995] Schmieder, B., Van Driel-Gesztelyi, L., & Freeland, S., 1995, Sol. Phys., 156, 245
- [2010] Schrijver, C. J., 2010, ApJ, 710, 1480
- [1999] Sheeley, N. R., Jr., Walters, H., & Wang, Y.-M. et al., 1999, J. Geophys. Res., 104, 24739
- [2000] St. Cyr, O. C., Howard, R. A., & Sheeley, N. R., Jr. et al., 2000, J. Geophys. Res., 105, 8169
- [2010] Sterling, A. C., Harra, L. K., & Moore, R. L., 2010, ApJ, 722, 1644
- [2005] Sudol, J. J., & Harvey, J. W., ApJ, 635, 647
- [1990] Švestka, Z., Farnik, F., & Tang, F., 1990, Sol. Phys., 127, 149
- [1985] Tang, F., 1985, Sol. Phys., 102, 131
- [2004] Uddin, W., Jain, R., & Yoshimura, E. et al., 2004, Sol. Phys., 225, 325
- [2002a] Wang, H., Ji, H., & Qiu, J. et al., 2002a, ApJ, 580, L177
- [2010] Wang, H., & Liu, C., 2010, ApJ, 716, L195
- [2005] Wang, H., Liu, C., & Deng, Y. et al., 2005, ApJ, 627, 1031
- [2002b] Wang, H., Spirock, T., & Qiu, J. et al., 2002b, ApJ, 576, 497
- [2000] Wang, J., Li, W., & Denker, C. et al., 2000, ApJ, 530, 1071
- [2006] Wang, Y.-M., Pick, M., & Mason, G. M., 2006, ApJ, 639, 495
- [2002] Wang, Y.-M., & Sheeley, N. R., Jr., 2002, ApJ, 575, 542
- [2005] Yamauchi, Y., Wang, H., & Jiang, Y. et al., 2005, ApJ, 629, 572
- [2011] Yang, L.-H., Jiang, Y.-C., Yang, J.-Y. et al., 2011, \raa, 11, 1229
- [2003] Yoshimura, K., Kurokawa, H., & Shine, R., 2003, PASJ, 55, 313
- [2001] Zhang, J., Dere, K. P., Howard, & R. A. et al., 2001, ApJ, 559, 452
- [2011] Zheng, R., Jiang, Y., & Hong, J. et al., 2011, ApJ, 739, L39
- [2007] Zuccarello, F., Battiato, V., & Contarion, L. et al., 2007, A&A, 468, 299