Modern observations of Hubble’s first-discovered Cepheid in M31
Abstract
We present a modern ephemeris and modern light curve of the first-discovered Cepheid variable in M31, Edwin Hubble’s M31-V1. Observers of the American Association of Variable Star Observers undertook these observations during the latter half of 2010. The observations were in support of an outreach program by the Space Telescope Science Institute’s Hubble Heritage project, but the resulting data are the first concentrated observations of M31-V1 made in modern times. AAVSO observers obtained 214 V-band, Rc-band, and unfiltered observations from which a current ephemeris was derived. The ephemeris derived from these observations is . The period derived from the 2010 data are in agreement with the historic values of the period, but the single season of data precludes a more precise determination of the period or measurement of the period change using these data alone. However, using an ephemeris based upon the period derived by Baade and Swope we are able to fit all of the observed data acceptably well. Continued observations in the modern era will be very valuable in linking these modern data with data from the 1920s-30s and 1950s, and will enable us to measure period change in this historic Cepheid. In particular, we strongly encourage intensive observations of this star around predicted times of maximum to constrain the date of maximum to better than 0.5 days.
1 Introduction
The star M31-V1 (RA: 00:41:27.30, Dec: +41:10:10.4, J2000) was the first Cepheid discovered by Edwin Hubble in M31 (Christianson, 1995), thus making it an object of historical as well as astrophysical interest. The object was listed in Hubble (1925) with a period of 31.41 days and a maximum magnitude of 18.2. Hubble published his light curves in full in Hubble (1929), clearly demonstrating that this star and several others like it in M31 exhibited Cepheid-like behavior. After this point, M31 was established as being a unique and distant Galaxy, independent of the Milky Way. Little or no work was done on these Cepheids until the work of W. Baade, published posthumously by H. Swope in 1965 (Baade & Swope, 1965). Baade provided several additional years of data for M31-V1 along with many other variables. Baade’s observations confirmed those of Hubble, and their analysis showed that the gross properties of M31-V1 were not significantly changed since the 1920s. Beyond these two data sets, little or no published time series photometry exists for M31-V1.
M31 has been extensively surveyed for Cepheids in both the spiral arms and disk (Magnier et al., 1997; Kaluzny et al., 1998; Mochejska et al., 2000) and bulge (Ansari et al., 2004). Surveys such as these give an increasingly complete snapshot of the population of Cepheids and other variables in M31, and consequently of the underlying stellar populations from which they arise. What is not yet available for these variables is long temporal coverage with time-series data. The majority of follow-ups of Hubble’s and Baade & Swope’s work are photometric in nature, focused on calibration of the Leavitt Law (Welch et al., 1986; Freedman & Madore, 1990) or on the general stellar population of M31 (Massey et al., 2006) rather than on the individual stars as astrophysical objects for study. This is understandable given the critical importance of the Leavitt Law in modern cosmology and the obvious difficulty of observing stars at the distance of M31, but it gives an incomplete picture of the potential value of M31 Cepheids to stellar astrophysics. Measurements of period change in Cepheids have the potential to reveal more about the underlying stellar population and evolution of M31-V1 and other M31 Cepheids (Turner, Abdel-Latif, & Berdnikov, 2006), and where sufficient data exist to study individual Cepheids in detail, they should be utilized.
In 2010, observers with the American Association of Variable Star Observers (AAVSO) obtained just over 200 days of observations of M31-V1. These observations were in support of a public outreach project by the Hubble Space Telescope Hubble Heritage project, but the resulting data set is also a valuable new set of time series for M31-V1 in the current epoch, the first published time-series for this star in nearly sixty years.
In this paper, we present our analysis of these new time series observations of M31-V1, and place them in context of prior observations by Hubble and by Baade. In Section 2 we describe the observers and observations, and in Section 3 we present the results of our analysis of these data. In Section 4 we present the digitized light curves of the Hubble and Baade & Swope data sets, and our attempt at phasing modern data with these older data sets. In Section 5 we conclude with a discussion of our results and make a case for future observations.
2 Observations
In 2010 the American Association of Variable Star Observers (AAVSO) received a request for observations of this Cepheid by the Hubble Heritage project at STScI. Observations of M31-V1 were tentatively planned with the Hubble Space Telescope to obtain time-series images intended for public outreach (Noll et al., 2011), but a modern ephemeris was unavailable. Such observations would be non-trivial to plan at a ground-based observatory; an adequate ephemeris would require at least two cycles be observed with good signal to noise, and a sufficient number of observations per cycle to adequately detail the light curve. For this star, that would require at least 60 days of coverage, with observations every 2-3 nights at least. For this reason, the AAVSO observer community was asked to provide coverage of M31-V1 for several months prior to the planned HST visit in December 2010 and January 2011.
M31-V1 has a magnitude around (Massey et al., 2006), which makes it a challenging but achievable target for amateur observers with larger telescopes and modern CCD cameras. The AAVSO established a set of comparison stars specifically for this work that lie within 15 arcminutes of M31-V1, using data from the USNO 1.0-meter and Sonoita Research Observatory 0.5-m telescopes. After comparison stars were established and made available through our online chart plotter, the AAVSO issued a call for observations on July 16, 2010 (Waagen, 2010). Eleven different observers attempted observations of this target during the following six month period, and total of 214 positive observations of M31-V1 were made between JD 2455365.9 and JD 2455565.6 (2010 June 18 to 2011 January 4). The resulting light curve of all AAVSO data is shown in Figure 1. An approximate ephemeris was calculated using these data, and HST successfully imaged this region of M31 over several weeks, obtaining their desired data set (Soderblom, 2011).
The eleven observers who contributed data to the HST campaign are given in Table 1. The majority of the observations (152 of 214 total) were obtained using Cousins R () filters, and our analysis is based upon these -band observations. Each observer has a unique telescope and camera system; in general the observers were able to reach a signal to noise of at least 3, but a few observers were able to obtain very good signal to noise, with photometric accuracy much better than 0.1 magnitudes per observation. All of the observations used in this paper are publicly available in the AAVSO International Database, and may be downloaded from the AAVSO’s website (http://www.aavso.org/data-download) using the name “M31_V1”.
The observations are not on a common standard system, but for the purpose of time series analysis, this is not necessary. Observers are using common comparison stars and similar (if not identical) filters, which is sufficient. For our analysis we simply require that the amplitude each observer observes is the same; all zero-point differences were removed prior to time-series analysis via an iterative procedure described below. To find the relative zero points of each observer, we first phased the data using a rough period of 31.41 days, obtained by Fourier transforming the raw data from a single observer (GFB, 65 observations). The entire data set are then folded on that period, yielding a phased light curve of all observers. We then divided the light curves into equal bins of 1/20 of a period, and performed an iterative adjustment of each observer’s magnitude offset to minimize the sum of the variances of the 20 bins:
| (1) |
where is the number of bins, the number of observations per bin, the magnitude of the -th observation by observer in each bin, and the magnitude offset of the -th observer. Each observer’s offset was iteratively adjusted up or down by a maximum of 0.01 magnitudes per step, and the process was repeated until the sum of the variances of the bins reached a minimum. These offsets were then applied to each observer’s data, with observer HQA used as the reference magnitude; the offsets are given in Table 2, and the raw and offset-fit phased light curves are shown in Figure 2.
3 Analysis
We performed a Fourier analysis on the resulting combined light curve to obtain the period, and phased the data to determine the time of maximum for the ephemeris. For the Fourier analysis, we use an iterative cleaning Fourier analysis code based upon the algorithm of Roberts, Lehar, & Dreher (1987) designed for irregularly-spaced observations, which is available from the AAVSO website. Fourier analysis of the light curve yields a peak at a frequency of (or ) with an -band amplitude of magnitudes. The precision of the frequency measurement is limited by the uncertainties in the observations and short temporal span of the data. The minimum error on the frequency can be estimated using the relation for given by Lenz & Breger (2005), which depends directly on the ratio of noise to amplitude, inversely on the span of the data and the square root of the number of data points. We assumed an average error per observation of 0.1 magnitudes, which yields a frequency uncertainty measured from a single season of data (spanning 199.8 days) of about , or . This value matches what was derived from earlier data within uncertainties. This is the minimum error that we expect on the period, and in reality it could be significantly higher if we have underestimated the average uncertainties of the magnitude estimates, .
Phasing the data using this period yields a time-of-maximum of JD with the resulting linear ephemeris being
| (2) |
We note that our method of establishing individual offsets may have influenced the determination of the period slightly, because they were calculated assuming a phasing period for the light curve of 31.4 days. However, we believe that this effect is minimal because the majority of observers obtained data at multiple phases of the light curve. If the period were greatly in error, it is likely that a single constant offset would not decrease the scatter across all phases of the light curve as we have shown. Since the bins are of order 1/20 of the period, we believe that the maximum error in period would be about one bin width, 1.5 days. Given that the period was first estimated using a single observer’s data, we believe that the error in period is likely well below this, and is probably closer to the formal error given above.
3.1 Color curves
Both and band data were submitted by four different observers, three of whom observed this star in both filters on at least one night. We attempted to create color curves using data from these three observers by phasing individual observers’ nightly measures of with the ephemeris given above. The resulting phased color curve is shown in Figure 3. The phase curve is flat within the errors on individual points, but the average value of is around +0.4, which is somewhat bluer than is typical for Milky Way long period Cepheids (Berdnikov & Turner, 1995). However, we caution that while observers are using well-calibrated comparison stars for photometry, the data for these observers was not fully calibrated and transformed to a standard system. The fact that there are zero-point -band differences between observers suggests that there will be -band differences as well. Unfortunately there are no calibrated reference observations in band as there are in , which means that our calculated average of is not reliable. However, we can say that the variation in color over the cycle is smaller than we can measure given the photometric errors.
4 Historic Observations: Hubble & Baade
Both Hubble (1929) and Baade & Swope (1965) published all of their photometry in an easily extractable format, and we keypunched the observations from these two papers into electronic, machine-readble tables. These observations have since been added to the AAVSO International Database and are freely available via the AAVSO website. As part of this project, we wanted to compare how the old data compare to the new by performing the same analyses on the archival data as we did on our own photometry. In this section, we present analyses of the Hubble (1929) and Baade & Swope (1965) data using the same procedure as in Section 3.
4.1 Hubble photometry
Hubble’s observations were described in Hubble (1929), and will be briefly reviewed here. The measurements were made from plates taken with the Mount Wilson 60- and 100-inch telescopes by ten different observers between JD 2418562.7 (1909 September 13) and 2425149.6 (1927 September 26). We digitized 130 positive observations of M31-V1 by Hubble; we included all observations regardless of Hubble’s quality flag (“good”, “fair”, or “poor”) but we did not digitize observations where the star was below the faintest camparison, or where it was not visible. The resulting light curve is shown in Figure 4.
Fourier analysis of Hubble’s data yields a period of , only slightly longer than Hubble’s own measurement of . The error in frequency is , corresponding to an error in period of ; our measured period and that derived by Hubble are identical within the uncertainties. Hubble’s data folded on our period of is shown in Figure 5. The full range amplitude of these data appears to be about the same as for the modern data, around 1.5 magnitudes in the passband of the plates (assumed to be blue). It is possible that Hubble’s comparison stars weren’t well-calibrated, particularly at the faint end, and it is therefore dangerous to make assumptions about the variability by comparing the photographic light curve to the modern curve.
4.2 Baade photometry
This star was observed by Walter Baade with the Palomar 200-inch in 1950 and 1951, although the data were not published until well after his death when Henrietta Swope brought his work to light (Baade & Swope, 1965). Baade and Swope’s magnitudes are likely to be more accurate than Hubble’s; Baade & Swope (1965) used photoelectric calibration star magnitudes (in SA 68) from W. Baum at Palomar and Stebbins, Whitford, & Johnson (1950), and Baade had much stricter control over the consistency of plates used for imaging the variable and calibration fields. The lightcurve of Baade & Swope’s digitized data is shown in Figure 6.
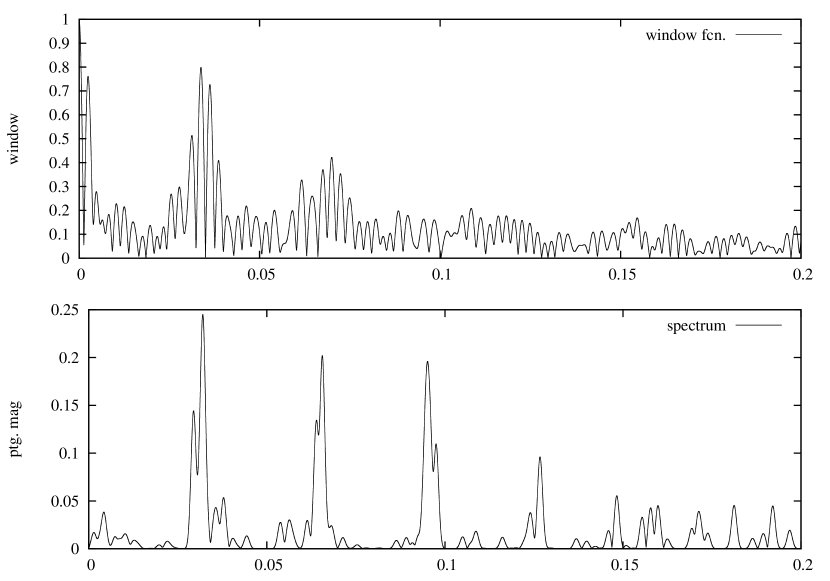
Fourier analysis of these data yields a period of which is at first glance much shorter than the Hubble data. The Baade & Swope data span only two seasons (508.9 days), and are smaller in number than Hubble’s data but the difference in period is still substantial. If we assume the uncertainties in magnitude are around 0.05 mag, the uncertainty in period is on the order of which means the periods are still different by several sigma. The likely explanation for this discrepancy can be seen in the window function and Fourier transform of the Baade data, which clearly show very strong annual and monthly sidelobes (Figure 7). Based upon the dates of observations, he was observing exclusively during dark time around new moon. The Roberts, Lehar, & Dreher (1987) algorithm used for our Fourier calculations generally works very well in most cases, but can still produce spurious results when sidelobes strongly affect the transform. The problem may also be worsened given that the period of M31-V1 is on the order of a month which can be seen in the similarity of the the star’s observed phase from month to month.
Baade & Swope (1965) do not state how their period was calculated, but they appear to have used the Hubble period as a starting point and simply adjusted the period for a best fit. They give a period for M31-V1, stating that it gives a good fit of the earlier Hubble data as well their own. We show a phase curve of the Baade & Swope data phased with our (likely incorrect period) and that obtained by Swope in Figure 8. Both periods produce acceptable phase curves, although the period from Baade & Swope (1965) appears slightly better. We therefore accept the Baade & Swope (1965) period and reject our own. We used the period to generate a test ephemeris with which we attempted to fit all measured historic and modern data together, which we discuss below.
4.3 Ephemeris for combined data
As a final test, we generated an ephemeris for the entire data set from 1908 to 2010 using the 1950-1951 data as a central reference point. We used the period of from Baade & Swope (1965), along with a well-measured time of maximum of JD 2433898.0 to generate predicted times of maximum from 1908 to 2011. In Figure 9 we show these data overlaid onto the light curve. This ephemeris produces a reasonably good fit to the modern data, fitting the maxima to within about 5% in phase. Clearly an ephemeris derived from Baade & Swope (1965) can fit the modern data acceptably well, suggesting that there has been no measurable change in period during the entire course of observations. However, this cannot be guaranteed to be true, primarily because the three epochs of data are very widely separated, and it is possible that different periods could fit the data simply by adjusting both the period and the cycle number to produce better fits. Such a test will be conducted in a future paper planned once another season of data is collected.
The primary reason that variables are observed over long periods of time or in widely-spaced epochs is to look for changes in variations that provide astrophysical insight into their evolution. Some Cepheid variables are known to change over time (Szabados, 1983; Turner, Abdel-Latif, & Berdnikov, 2006), and these changes can yield information about their position on the H-R diagram, evolutionary state, and other physical properties. The Hubble (1929) and Baade & Swope (1965) data sets are a possible starting point for studying period changes in the M31 Cepheids. The observations by AAVSO observers represent a first attempt at detecting such changes serendipitously. The single season of data which we have obtained provides a preliminary constraint on period change in M31-V1, and we expect that additional seasons of data during the current epoch will provide more conclusive constraints. In principle, a similar modern study could be attempted on any Cepheid common to the Hubble and Baade & Swope samples, with the only possible limitation being the available telescope time and the ability of telescopes of small aperture to reach these faint magnitudes. We suggest that any of the M31 Cepheids with maxima brighter than would be suitable targets for future work.
5 Discussion
While the HST campaign was essentially a public outreach and education initiative, the resulting data set from the AAVSO community represents a new and valuable set of data for this star. The quality of observations suggests that the amateur community can do valuable work on the brighter Cepheids in M31 or nearer galaxies in the local group. The 2010 data set will hopefully be the first of several more years of follow-up observations.
The 2010 data set appears to be fully consistent with past observations of M31-V1. The evidence presented here – while based on only a single season of data – is consistent with M31-V1 being physically unchanged since its discovery by Hubble 80 years ago. It is certainly consistent with no significant period change since 1951, when Baade last performed time-series photometry, however we caution that additional seasons of data will be required to confirm that definitively. Subsequent years will enable us to more accurately define the period and times of minimum, and we encourage the continued observation of M31-V1 by the community, both amateur and professional. We especially encourage concentrated -band observations around the times of maximum predicted with the Baade & Swope ephemeris. With well-defined times of maximum we can attempt to measure for this star, and should also be able to rule out the possibility that the period has changed significantly.
References
- Ansari et al. (2004) Ansari, R. et al., 2004, A&A 421, 509
- Baade & Swope (1965) Baade, W. & Swope, H.H., 1965, AJ 70, 212
- Berdnikov & Turner (1995) Berdnikov, L.N. & Turner, D.G., 1995, Ast. L. 21, 534
- Christianson (1995) Christianson, G.E., 1995, Edwin Hubble: Mariner of Nebulae (New York: Farrar, Straus & Giroux)
- Freedman & Madore (1990) Freedman, W.L. & Madore, B.F., 1990, ApJ 365, 186
- Hubble (1925) Hubble, E., 1925, Popular Ast. 33, 252
- Hubble (1929) Hubble, E., 1929, ApJ 69, 103
- Kaluzny et al. (1998) Kaluzny, J. et al., 1998, AJ 115, 1016
- Lenz & Breger (2005) Lenz, W. & Breger, M., 2005, Comm. Ast 146, 53
- Magnier et al. (1997) Magnier, E.A. et al., 1997, A&AS 126, 401
- Massey et al. (2006) Massey, P. et al., 2006, AJ 131, 2478
- Mochejska et al. (2000) Mochejska, B.J. et al., 2000, AJ 120, 810
- Noll et al. (2011) Noll, K. et al., 2011, STScI-PRC11-15
- Roberts, Lehar, & Dreher (1987) Roberts, D.H., Lehar, J., & Dreher, J.W., 1987, AJ 93, 968
- Soderblom (2011) Soderblom, D.R., 2011, BAAS 218, 97.06
- Stebbins, Whitford, & Johnson (1950) Stebbins, J., Whitford, A.E., & Johnson, H.L., 1950, ApJ 112, 469
- Szabados (1983) Szabados, L., 1983, Astrophysics & Space Science 96, 185
- Turner, Abdel-Latif, & Berdnikov (2006) Turner, D.G., Abdel-Latif, M.A.-S., & Berdnikov, L.N., 2006, PASP 118, 410
- Waagen (2010) Waagen, E.O., 2010, AAVSO Alert Notice 422 (2010 July 16)
- Welch et al. (1986) Welch, D.L. et al., 1986, ApJ 305, 583


| Obscode | Name | Location | Total | |||||
|---|---|---|---|---|---|---|---|---|
| GFB | Goff | California, US | 98 | 65 | 29 | … | 4 | … |
| SSTB | Smith | California, US | 38 | 38 | … | … | … | … |
| HQA | Henden | Arizona, US | 28 | 28 | … | … | … | … |
| SRIC | Sabo | Montana, US | 18 | 11 | 7 | … | … | … |
| BHU | Buchheim | California, US | 13 | … | … | 13 | … | … |
| WGR | Walker | Massachusetts, US | 10 | 5 | 5 | … | … | … |
| HBB | Harris | Florida, US | 3 | 2 | 1 | … | … | … |
| BGU | Belcheva | Bulgaria | 2 | … | 1 | … | … | 1 |
| CTX | Crawford | Oregon, US | 2 | 2 | … | … | … | … |
| CMJA | Cook | Ontario, Canada | 1 | 1 | … | … | … | … |
| DKS | Dvorak | Florida, US | 1 | … | … | 1 | … | … |
| Obscode | mag. offset | N(obs) |
|---|---|---|
| HQA | 0.0 | 28 |
| CTX | -0.10 | 2 |
| GFB | -0.11 | 65 |
| HBB | +0.27 | 2 |
| SRIC | +0.09 | 11 |
| SSTB | +0.14 | 38 |
| WGR | +0.29 | 5 |