Optical conductivity of superconducting K0.8Fe2-ySe2
single crystals:
Evidence for a Josephson-coupled phase
Abstract
The optical properties of the iron-chalcogenide superconductor K0.8Fe2-ySe2 with a critical temperature K have been measured over a wide frequency range in the a-b planes above and below . The conductivity is incoherent at room temperature, but becomes coherent (Drude-like) at ; however, k, well above the threshold for the superconductor-insulator transition at k. Below , the superfluid density cm-2 places this material on the scaling line , but in a region associated with Josephson coupling, suggesting this material is inhomogeneous and constitutes a Josephson phase.
pacs:
74.25.Gz, 74.70.-b, 74.81.-g, 63.20.-eThe discovery of superconductivity in the iron-arsenic (pnictide) material LaFeAsO1-xFxKamihara et al. (2008) and the rapid increase in the critical temperature above 50 K through rare-earth substitutions,Ren et al. (2008) has prompted the search for related iron-based superconductors in the hope of achieving even higher values for . While superconductivity was quickly discovered in (Ba1-xKx)Fe2As2Rotter et al. (2008) and the iron-chalcogenide FeTe1-xSex,Fang et al. (2008) the maximum value for in these compounds is and 15 K, respectively. In the iron-based superconductors, scattering between hole and electron pockets in this class of materials is considered a necessary element for high critical temperatures.Chubukov (2012) Indeed, in the KFe2As2 material, the electron pockets that are present in all the other iron-based materials are absent, leaving just the hole pockets at the center of the Brillouin zone and a severely reduced K.Chen et al. (2009); Sato et al. (2009) The discovery of superconductivity in K0.8Fe2-ySe2 with KGuo et al. (2010) was greeted with enthusiasm not only because of the relatively high value for , but also as a result of its unique electronic structure. In this material the hole pockets at the center of the Brillouin zone are absent, leaving just the electron pockets at the edges of the zone;Wang et al. (2011a); Zhang et al. (2011); Qian et al. (2011) however, the value for K is an order of magnitude larger than in the hole-doped analog, suggesting that the spin fluctuation pairing mechanism may have to be re-evaluated.Wang et al. (2011b) In the superconducting state K0.8Fe2-ySe2 displays a nearly isotropic gap of meV on the Fermi surfaces.Wang et al. (2011a); Zhang et al. (2011); Qian et al. (2011) Evidence for phase separation and the coexistence of magnetism and superconductivity has been observed in recent optical work on K0.75Fe1.75Se2Yuan et al. (2012) and the related Rb2Fe4Se5 material;Charnukha et al. (2012) this interpretation is consistent with other recent experiments.Wang et al. (2011c); Ricci et al. (2011a, b); Shermadini et al. (2011)
In this Rapid Communication we present the detailed in-plane optical properties of single crystal of K0.8Fe2-ySe2 ( K) in both the normal and superconducting state. At room temperature the optical properties are dominated by the infrared-active vibrations and other bound excitations; the free-carrier response is incoherent. As the temperature is reduced a coherent, or Drude-like, response is observed just above . Below a weak superconducting response is observed allowing the superfluid density to be estimated. This material is observed to fall on the general scaling line for the cuprate superconductors, ,Homes et al. (2004) but in a region typically associated with the c-axis response where the superconducting response is due to Josephson coupling, suggesting that this material is indeed phase separated and constitutes a Josephson phase.Imry et al. (2008)
Large single crystals of K0.8Fe2-ySe2 were grown using a vertical unidirectional solidification method. Pieces of potassium were added to precursor FeSe to form the nominal composition and then placed into an alumina crucible and sealed in a quartz tube; this tube was then resealed in another quartz tube. This arrangement was heated to C and then cooled to C, at which point the furnace was turned off and allowed to cool slowly to room temperature, yielding mm-sized single crystals. The room temperature resistivity of cm increases slightly upon cooling before beginning to decrease below about 250 K, reaching a value of about 18 cm just before the sample becomes superconducting at K. The value for has been determined from magnetic susceptibility.
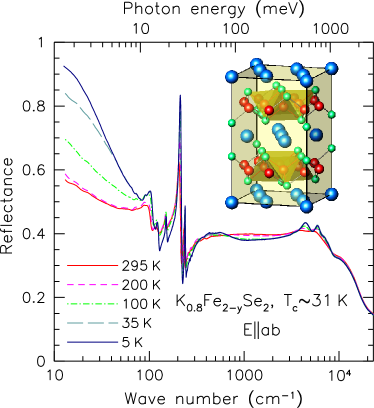
A single crystal of K0.8Fe2-ySe2 approximately was mounted on an optically-black cone and cleaved, revealing an mirror-like surface; the sample was immediately transferred to a cryostat and placed under vacuum. The reflectance for light polarized in the iron-selenide (a-b) planes has been measured using an in-situ overcoating techniqueHomes et al. (1993) from the terahertz (1.5 meV) to the ultraviolet ( eV) region for a variety of temperatures above and below , shown in Fig. 1. The relatively low value for the reflectance is characteristic of a poor metal and it is dominated by the infrared-active vibrations, as well as other electronic features at higher energy. The low-frequency reflectance initially displays little temperature dependence, but begins to increase rapidly below K, with an abrupt increase below . The complicated electronic behavior contained in the reflectance may be seen more clearly in the optical conductivity, which is determined from a Kramers-Kronig analysis of the reflectance.Dressel and Grüner (2001)
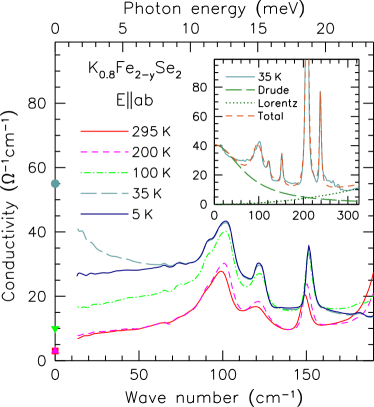
The calculated conductivity is shown in the low-frequency region in Fig. 2. At room temperature the conductivity is dominated by a series of sharp features associated with the infrared-active lattice modes, superimposed on a flat, incoherent electronic background. As the temperature is reduced, the vibrational features narrow and increase slightly in frequency. Below K the low frequency conductivity begins to gradually increase, until just above the response may be described reasonably well by using a Drude-Lorentz model for the complex dielectric function
| (1) |
where is the real part of the dielectric function at high frequency, and are the plasma frequency and scattering rate for the delocalized (Drude) carriers, respectively, and is an effective mass tensor; , and are the position, width, and oscillator strength of the th vibration. The complex conductivity is . The inset in Fig. 2 shows the result of a non-linear least-squares fit to the conductivity at 35 K using a single Drude component as well as a number of Lorentz oscillators to reproduce the narrow phonon features and the broader excitations observed at high frequency.
| () | () | () |
|---|---|---|
| 65.2 (0.2) | 2.5 (0.3) | 10 (2) |
| 73.6 (0.2) | 3.7 (0.4) | 15 (3) |
| 93.7 (0.2) | 18.1 (3.4) | 118 (17) |
| 102.3 (0.6) | 10.5 (0.9) | 103 (17) |
| 121.9 (0.6) | 9.2 (0.8) | 78 (6) |
| 151.7 (0.3) | 3.8 (0.5) | 67 (6) |
| 181.9 (0.3) | 4.5 (0.2) | 16 (2) |
| 208.3 (0.1) | 4.4 (0.1) | 322 (8) |
| 238.3 (0.1) | 4.3 (0.2) | 131 (6) |
| 267.1 (0.2) | 2.9 (0.2) | 22 (3) |
| 278.6 (0.2) | 5.2 (0.2) | 32 (3) |
The large number of vibrations observed in this material (listed in Table 1) is surprising given that in tetragonal BaFe2As2 () only two in-plane infrared active modes are expected and observed, and that even below the magnetic and structural transition the orthorhombic distortion () only yields an additional two modes,Akrap et al. (2009) far fewer than observed here. However, it has been remarked that the tetragonal unit cell for K0.8Fe2-ySe2 (shown in the inset of Fig. 1) is larger and more complicated than the related iron-arsenic structure.Bao et al. (2011); Bacsa et al. (2011); Zavalij et al. (2011) We have determined the the irreducible vibrational representation using the space group,
The modes are Raman active and the modes are silent; only the and vibrations are infrared active along the c axis and in the a-b planes, respectively. The large number of infrared-active modes is in agreement with observation; however, while only 10 modes are predicted, a minimum of 11 modes are observed (two additional features, weak shoulders associated with the two strong modes at and 238 cm-1 are difficult to fit and have not been included). This suggests that some of the observed modes may be due to a secondary phase, the activation of Raman modes due to disorder, or both.
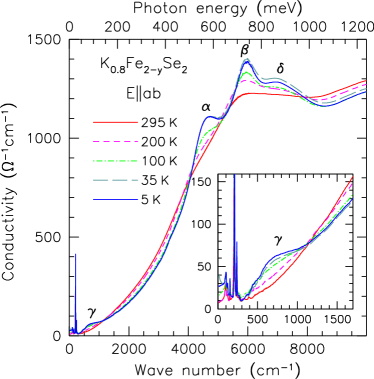
In addition to the lattice modes, there are a number of broad features observed at high frequency, shown in Fig. 3. The prominent features at and 7100 cm-1 have been observed in optical studies of the K and Rb doped iron selenidesChen et al. (2011); Charnukha et al. (2012) and are labeled , and , respectively. We also observe an unusual low-energy feature at cm-1, denoted . The three high-frequency features are thought to be related to spin-controlled interband transitions.Chen et al. (2011); Charnukha et al. (2012) Given that the 760 cm-1 feature displays the same temperature dependence, it is possible that it may have a similar origin. The spectral weight associated with these features increases at low temperature; however, this is compensated by a decrease in adjacent regions so that the total spectral weight is constant when is sufficiently large ( eV).
The Drude parameters cm-1 and cm-1 determined from the fit to the optical conductivity at 35 K not reveal that the Drude plasma frequency is more than an order of magnitude smaller than what is observed in comparable iron-pnictide Tu et al. (2010) or iron-chalcogenide materials.Homes et al. (2010) A generalized-Drude modelAllen and Mikkelsen (1977); Puchkov et al. (1996) indicates that the enhancement of the effective mass at 35 K is rather small, . This corresponds to a dilute carrier concentration of cm-3, considerably less than the estimates based on NMR measurements.Torchetti et al. (2011) Given the small value for , it is reasonable to ask whether or not this material is homogeneous. Just above we note that cm-1, or mcm. The highly-anisotropic nature of these materialsWang et al. (2011d) suggests that the transport be described in terms of a sheet resistance , where is the separation between the iron-chalcogenide sheets. Using ÅBao et al. (2011); Bacsa et al. (2011); Zavalij et al. (2011) yields k. This value is significantly larger than the threshold for the superconductor-insulator transitionStrongin et al. (1970) observed to occur close to k, suggesting that this material may not be homogeneous.
Below in the superconducting state the conductivity shows a characteristic suppression below cm-1. The strength of the condensate may be determined from the Ferrell-Glover-Tinkham sum rule, , where is the superconducting plasma frequency and is a cut-off frequency, allowing the superfluid density to be calculated. The small value for the missing area, the large amount of residual conductivity, and the proximity to a number of phonon modes can all be significant sources of uncertainty for this sum rule. However, these difficulties can be overcome by using the alternative method in the , limit.Jiang et al. (1996) The value cm-1 (yielding an effective penetration depth m) is an order of magnitude smaller than what is observed in other iron-arsenicTu et al. (2010) and iron-chalcogenideHomes et al. (2010) superconductors. It has been pointed out that a number of the iron-based superconductors fall on the scaling relation initially observed for the cuprate superconductors, ,Homes et al. (2004) shown in Fig. 4.
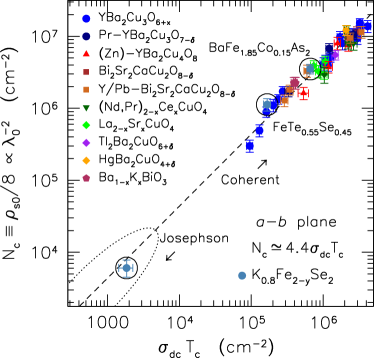
The inhomogeneous nature of this material makes it difficult to associate a given value for with the superconducting regions. If we consider the residual conductivity to originate mainly from a weakly-metallic component that does not contribute to superconductivity, then we can estimate cm-1 in the limit; we attach the provision that there is a considerable amount of uncertainty associated with this estimate. Using these values, K0.8Fe2-ySe2 does indeed fall on the scaling line in Fig. 4; however, it does so in a region associated with the response along the c axis in the cuprates where the superconductivity is due to Josephson coupling between the copper-oxygen planes. This is further evidence that the material is inhomogeneous and that it constitutes a Josephson phase, in agreement with other recent results.Yuan et al. (2012); Charnukha et al. (2012); Wang et al. (2011c); Ricci et al. (2011a, b); Shermadini et al. (2011) While it is tempting to associate the decrease in the low-frequency conductivity below with the formation of a superconducting energy gap meV, this value is significantly smaller than the ARPES estimates of meV.Wang et al. (2011a); Zhang et al. (2011); Qian et al. (2011) Moreover, the previous statement that the superconductivity in this material is due to Josephson coupling implies that the energy scale for changes in the reflectance and conductivity should occur in the region of the renormalized superconducting plasma frequency, ; allowing that cm-1 represents an average value for a distribution of frequencies Yuan et al. (2012) and given the experimentally-determined value at 50 meV, then cm-1 is reasonably close to the changes observed in the conductivity below about 65 cm-1.
In summary, the in-plane optical conductivity of K0.8Fe2-ySe2 ( K) is incoherent at room temperature where it is dominated by infrared-active lattice modes and other high-frequency bound excitations. Just above a coherent, Drude-like, response emerges, but the fitted value cm-1 is quite small. Moreover, k at 35 K, well above the threshold for the superconductor-insulator transition observed at k. Below the superconducting plasma frequency cm-1 is more than an order of magnitude smaller than what is observed in other iron-based superconductors. This material falls on the scaling line , but does so in a region associated with Josephson coupling along the poorly-conducting c axis in the cuprate superconductors. Taken together, the normal and superconducting state properties suggest an inhomogeneous, phase separated material, in which the superconductivity is due to Josephson coupling.
We are grateful to C. Petrovic for suggesting this series of experiments. We would like to acknowledge useful discussions with W. Bao, A. V. Chubukov, Q. Li, M. Rechner, A. M. Tsvelik, and N. L. Wang. Research supported by the U.S. Department of Energy, Office of Basic Energy Sciences, Division of Materials Sciences and Engineering under Contract No. DE-AC02-98CH10886. Z. X. and J. W. are supported by the Center for Emergent Superconductivity, an Energy Frontier Research Consortium supported by the Office of Basic Energy Science of the Department of Energy
References
- Kamihara et al. (2008) Y. Kamihara, T. Watanabe, M. Hirano, and H. Hosono, J. Am. Chem. Soc. 130, 3296 (2008).
- Ren et al. (2008) Z.-A. Ren, J. Yang, W. Lu, W. Yi, X.-L. Shen, Z.-C. Li, G.-C. Che, X.-L. Dong, L.-L. Sun, F. Zhou, and Z.-X. Zhao, EPL 82, 57002 (2008).
- Rotter et al. (2008) M. Rotter, M. Tegel, and D. Johrendt, Phys. Rev. Lett. 101, 107006 (2008).
- Fang et al. (2008) M. H. Fang, H. M. Pham, B. Qian, T. J. Liu, E. K. Vehstedt, Y. Liu, L. Spinu, and Z. Q. Mao, Phys. Rev. B 78, 224503 (2008).
- Chubukov (2012) A. Chubukov, Ann. Rev. Conden. Matt. Phys. 3, 57 (2012).
- Chen et al. (2009) H. Chen, Y. Ren, Y. Qiu, W. Bao, R. H. Liu, G. Wu, T. Wu, Y. L. Xie, X. F. Wang, Q. Huang, and X. H. Chen, EPL 85, 17006 (2009).
- Sato et al. (2009) T. Sato, K. Nakayama, Y. Sekiba, P. Richard, Y.-M. Xu, S. Souma, T. Takahashi, G. F. Chen, J. L. Luo, N. L. Wang, and H. Ding, Phys. Rev. Lett. 103, 047002 (2009).
- Guo et al. (2010) J. Guo, S. Jin, G. Wang, S. Wang, K. Zhu, T. Zhou, M. He, and X. Chen, Phys. Rev. B 82, 180520(R) (2010).
- Wang et al. (2011a) X.-P. Wang, T. Qian, P. Richard, P. Zhang, J. Dong, H.-D. Wang, C.-H. Dong, M.-H. Fang, and H. Ding, EPL 93, 57001 (2011a).
- Zhang et al. (2011) Y. Zhang, L. X. Yang, M. Xu, Z. R. Ye, F. Chen, C. He, H. C. Xu, J. Jiang, B. P. Xie, J. J. Ying, X. F. Wang, X. H. Chen, J. P. Hu, M. Matsunami, S. Kimura, and D. L. Feng, Nature Mater. 10, 273 277 (2011).
- Qian et al. (2011) T. Qian, X.-P. Wang, W.-C. Jin, P. Zhang, P. Richard, G. Xu, X. Dai, Z. Fang, J.-G. Guo, X.-L. Chen, and H. Ding, Phys. Rev. Lett. 106, 187001 (2011).
- Wang et al. (2011b) F. Wang, F. Yang, M. Gao, Z.-Y. Lu, T. Xiang, and D.-H. Lee, EPL 93, 57003 (2011b).
- Yuan et al. (2012) R. H. Yuan, T. Dong, Y. J. Song, G. F. Chen, J. P. Hu, J. Q. Li, and N. L. Wang, Sci. Rep. 2, 221 (2012).
- Charnukha et al. (2012) A. Charnukha, J. Deisenhofer, D. Pröpper, M. Schmidt, Z. Wang, Y. Goncharov, A. N. Yaresko, V. Tsurkan, B. Keimer, A. Loidl, and A. V. Boris, Phys. Rev. B 85, 100504(R) (2012).
- Wang et al. (2011c) Z. Wang, Y. J. Song, H. L. Shi, Z. W. Wang, Z. Chen, H. F. Tian, G. F. Chen, J. G. Guo, H. X. Yang, and J. Q. Li, Phys. Rev. B 83, 140505(R) (2011c).
- Ricci et al. (2011a) A. Ricci, N. Poccia, G. Campi, B. Joseph, G. Arrighetti, L. Barba, M. Reynolds, M. Burghammer, H. Takeya, Y. Mizuguchi, Y. Takano, M. Colapietro, N. L. Saini, and A. Bianconi, Phys. Rev. B 84, 060511(R) (2011a).
- Ricci et al. (2011b) A. Ricci, N. Poccia, B. Joseph, G. Arrighetti, L. Barba, J. Plaisier, G. Campi, Y. Mizuguchi, H. Takeya, Y. Takano, N. L. Saini, and A. Bianconi, Supercond. Sci. and Technol. 24, 082002 (2011b).
- Shermadini et al. (2011) Z. Shermadini, A. Krzton-Maziopa, M. Bendele, R. Khasanov, H. Luetkens, K. Conder, E. Pomjakushina, S. Weyeneth, V. Pomjakushin, O. Bossen, and A. Amato, Phys. Rev. Lett. 106, 117602 (2011).
- Homes et al. (2004) C. C. Homes, S. V. Dordevic, M. Strongin, D. A. Bonn, R. Liang, W. N. Hardy, S. Komiya, Y. Ando, G. Yu, N. Kaneko, X. Zhao, M. Greven, D. N. Basov, and T. Timusk, Nature (London) 430, 539 (2004).
- Imry et al. (2008) Y. Imry, M. Strongin, and C. Homes, Physica C 468, 288 (2008).
- Homes et al. (1993) C. C. Homes, M. Reedyk, D. A. Crandles, and T. Timusk, Appl. Opt. 32, 2976 (1993).
- Dressel and Grüner (2001) M. Dressel and G. Grüner, Electrodynamics of Solids (Cambridge University Press, Cambridge, 2001).
- Akrap et al. (2009) A. Akrap, J. J. Tu, L. J. Li, G. H. Cao, Z. A. Xu, and C. C. Homes, Phys. Rev. B 80, 180502(R) (2009).
- Bao et al. (2011) W. Bao, Q.-Z. Huang, G.-F. Chen, M. A. Green, D.-M. Wang, J.-B. He, and Y.-M. Qiu, Chin. Phys. Lett. 28, 086104 (2011).
- Bacsa et al. (2011) J. Bacsa, A. Y. Ganin, Y. Takabayashi, K. E. Christensen, K. Prassides, M. J. Rosseinsky, and J. B. Claridge, Chem. Sci. 2, 1054 (2011).
- Zavalij et al. (2011) P. Zavalij, W. Bao, X. F. Wang, J. J. Ying, X. H. Chen, D. M. Wang, J. B. He, X. Q. Wang, G. F. Chen, P.-Y. Hsieh, Q. Huang, and M. A. Green, Phys. Rev. B 83, 132509 (2011).
- Chen et al. (2011) Z. G. Chen, R. H. Yuan, T. Dong, G. Xu, Y. G. Shi, P. Zheng, J. L. Luo, J. G. Guo, X. L. Chen, and N. L. Wang, Phys. Rev. B 83, 220507(R) (2011).
- (28) A further mode at cm-1 has been included in the fits.
- Tu et al. (2010) J. J. Tu, J. Li, W. Liu, A. Punnoose, Y. Gong, Y. H. Ren, L. J. Li, G. H. Cao, Z. A. Xu, and C. C. Homes, Phys. Rev. B 82, 174509 (2010).
- Homes et al. (2010) C. C. Homes, A. Akrap, J. S. Wen, Z. J. Xu, Z. W. Lin, Q. Li, and G. D. Gu, Phys. Rev. B 81, 180508(R) (2010).
- Allen and Mikkelsen (1977) J. W. Allen and J. C. Mikkelsen, Phys. Rev. B 15, 2952 (1977).
- Puchkov et al. (1996) A. V. Puchkov, D. N. Basov, and T. Timusk, J. Phys: Condens. Matter 8, 10049 (1996).
- Torchetti et al. (2011) D. A. Torchetti, M. Fu, D. C. Christensen, K. J. Nelson, T. Imai, H. C. Lei, and C. Petrovic, Phys. Rev. B 83, 104508 (2011).
- Wang et al. (2011d) H.-D. Wang, C.-H. Dong, Z.-J. Li, Q.-H. Mao, S.-S. Zhu, C.-M. Feng, H. Q. Yuan, and M.-H. Fang, EPL 93, 47004 (2011d).
- Strongin et al. (1970) M. Strongin, R. S. Thompson, O. F. Kammerer, and J. E. Crow, Phys. Rev. B 1, 1078 (1970).
- Jiang et al. (1996) C. Jiang, E. Schachinger, J. P. Carbotte, D. Basov, and T. Timusk, Phys. Rev. B 54, 1264 (1996).