Min-Bias and the Underlying Event at the LHC
Abstract
In a very short time the experiments at the LHC have collected a large amount of data that can be used to study minimum bias (MB) collisions and the underlying event (UE) in great detail. The CDF PYTHIA Tune DW predictions for the LHC UE data at and are examined in detail. The behavior of the UE at the LHC is roughly what we expected. The LHC PYTHIA Tune Z1 does an excellent job describing the LHC UE data. The modeling of MB (i.e., the overall inelastic cross section) is more complicated because one must include a model of diffraction. The ability of PYTHIA Tune DW and Tune Z1 to simultaneously describe both the UE in a hard scattering process and MB collisions are studied. No model describes perfectly all the features of MB collisions at the LHC.
I Introduction
The total proton-proton cross section is the sum of the elastic and inelastic components, . Three distinct processes contribute to the inelastic cross section; single diffraction, double-diffraction, and everything else, which is referred to as “non-diffractive” (ND) component. For elastic scattering neither of the beam particles breaks apart (i.e., color singlet exchange). For single and double diffraction one or both of the beam particles are excited into a high mass color singlet state (i.e., N* states) which then decays. Single and double diffraction also corresponds to color singlet exchange between the beam hadrons. When color is exchanged the outgoing remnants are no longer color singlets and one has a separation of color resulting in a multitude of quark-antiquark pairs being pulled out of the vacuum. The non-diffractive component, , involves color exchange and the separation of color. However, the non-diffractive collisions have both a soft and hard component. Most of the time the color exchange between partons in the beam hadrons occurs through a soft interaction (i.e., no high transverse momentum) and the two beam hadrons “ooze” through each other producing lots of soft particles with a uniform distribution in rapidity and many particles flying down the beam pipe. Occasionally, there is a hard scattering among the constituent partons producing outgoing particles and “jets” with high transverse momentum.
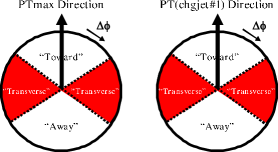
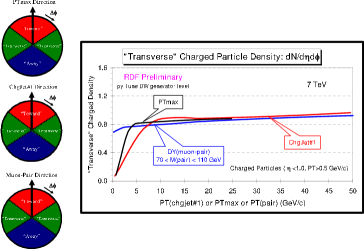
Min-bias (MB) is a generic term which refers to events that are selected with a “loose” trigger that accepts a large fraction of the overall inelastic cross section. All triggers produce some bias and the term “min-bias” is meaningless until one specifies the precise trigger used to collect the data. The underlying event (UE) consists of particles that accompany a hard scattering such as the beam-beam remnants (BBR) and the particles that arise from multiple parton interactions (MPI) . The UE is an unavoidable background to hard-scattering collider events. MB and UE are not the same object! The majority of MB collisions are soft while the UE is studied in events in which a hard-scattering has occurred. One uses the“jet” structure of the hard hadron-hadron collision to experimentally study the UE cdfue1 . As shown in Fig. 1, on an event-by-event bases, the leading charged particle, PTmax, or the leading charged particle jet, chgjet#, can be used to isolate regions of - space that are very sensitive to the modeling of the UE. The pseudo-rapidity is defined by , where is the center-of-mass polar scattering angle and is the azimuthal angle of outgoing charged particles. In particular, the “transverse” region defined by , where , where is the azimuthal angle of PTmax (or chgjet#) and is the azimuthal angle of a charged particle is roughly perpendicular to the plane of the hard -to- parton-parton scattering and is therefore very sensitive to the UE.
QCD Monte-Carlo generators such as PYTHIA pythia6 have parameters which may be adjusted to control the behavior of their event modeling. A specified set of these parameters that has been adjusted to better fit some aspects of the data is referred to as a tune skands1 . In Section 2, I will review briefly the CDF PYTHIA tunes. PYTHIA Tune DW does a very nice job in describing the CDF Run 2 underlying event data. In Section 3, we will take a close look at how well PYTHIA Tune DW did at predicting the behavior of the UE at and at the LHC. We will see that Tune DW does a fairly good job in describing the LHC UE data. However, Tune DW does not reproduce perfectly all the features of the data and after seeing the data one can construct improved LHC UE tunes. The first ATLAS LHC tune was Tune AMBT1 ambt1 and CMS has Tune Z1 and Tune Z2 which I will discuss in Section 4. MB and the UE are not the same object, however, in PYTHIA the modeling of the UE in a hard scattering process and the modeling of the inelastic non-diffractive cross section are related. In Section 5, I will examine how well the PYTHIA tunes fit the LHC MB data. The summary and conclusions are in Section 6.
II Studying the UE at CDF
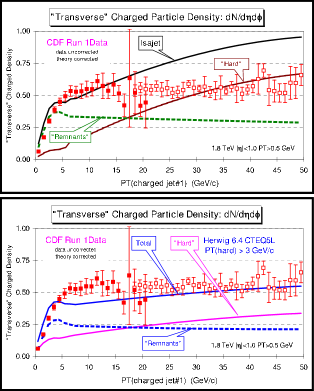
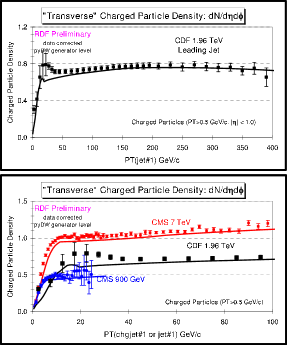
Figure 2 shows some of the first comparisons to come from the CDF UE studies cdfue1 . The CDF Run 1 data at on the density of charged particles in the “transverse” region as defined by the leading charged particle jet, chgjet#, are compared with ISAJET isajet (without MPI) and HERWIG herwig (without MPI) using the ISAJET and HERWIG default parameters with . The Monte-Carlo predictions are divided into two categories: charged particles that arise from the break-up of the beam and target (beam-beam remnants); and charged particles that arise from the outgoing jets plus initial and final-state radiation (hard scattering component). HERWIG has improved modeling of the parton-showers (modified leading-log), whereas ISAJET simply uses the leading-log approximation. The modified leading-log takes into account the angle-ordering of the shower that is indicated by higher order corrections. Clearly, the hard-scattering component of HERWIG does a much better job in describing the data than does the hard-scattering component of ISAJET. However, it became clear that the beam-beam remnants of HERWIG were too soft to describe the CDF Run 1 UE data. To describe the data one needs to include MPI.
| Parameter | Tune A | Tune B | Tune DW | Tune D6 | Tune DWT |
|---|---|---|---|---|---|
| CTEQ5L | CTEQ5L | CTEQ5L | CTEQ6L | CTEQ5L | |
| MSTP(81) | |||||
| MSTP(82) | |||||
| PARP(82) | |||||
| PARP(83) | |||||
| PARP(84) | |||||
| PARP(85) | |||||
| PARP(86) | |||||
| PARP(89) | |||||
| PARP(90) | |||||
| PARP(62) | |||||
| PARP(64) | |||||
| PARP(67) | |||||
| MSTP(91) | |||||
| PARP(91) | |||||
| PARP(93) |
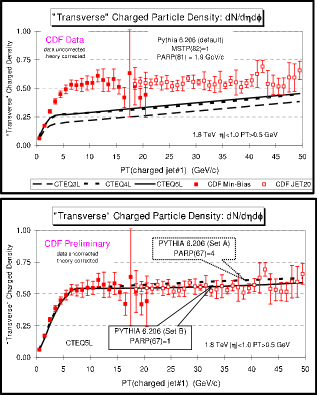
Figure 3 shows the first attempts to tune the parameters of PYTHIA to fit the CDF Run 1 UE data and Table 1 give the value of the parameters for the some of the CDF tunes. The perturbative -to- parton-parton differential cross section diverges like , where is the transverse momentum of the outgoing parton in the parton-parton center-of-mass frame. PYTHIA regulates this cross section by including a smooth cut-off as follows: . This approaches the perturbative result for large scales and is finite as . The primary hard scattering processes and the MPI are regulated in the same way with the one parameter PARP(). This parameter governs the amount of MPI in the event. Smaller values of results in more MPI due to a larger MPI cross-section. PARP() sets the high scale for initial-state radiation in PYTHIA . It determines the maximal parton virtuality allowed in time-like showers. The larger the value of PARP() the more initial-state radiation in the event. Tune A has more initial-state radiation and less MPI and Tune B has less initial-state radiation and slightly more MPI. However, as can be seen in Fig. 3 one cannot discriminate between them by simply looking at the activity in the “transverse” region.
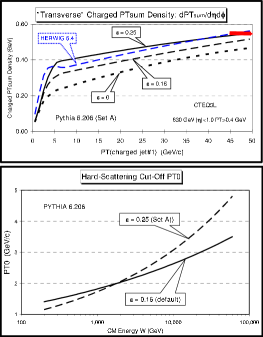
The CDF studies indicated that is around at . However, this cut-off is expected depend on the center-of-mass energy of the hadron-hadron collision, . PYTHIA parameterizes this energy dependence as follows: , where PARP() is the reference energy and the parameter PARP() determines the energy dependence. Fig. 4 shows how the PARP() parameter for Tune A was determined. I determined the value of 0.25 by comparing the UE activity in the CDF data at and cdf630 .
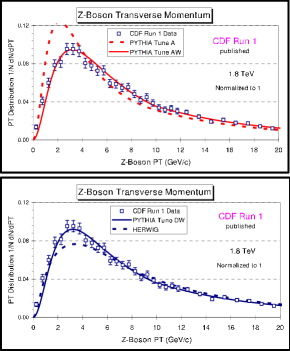
Figure 5 shows that Tune A does not fit the CDF Run 1 Z-boson distribution very well cdfzpt . PYTHIA Tune AW was adjusted to fit the Z-boson distribution as well as the underlying event at the Tevatron. The UE activity of Tune A and Tune AW are nearly identical. PYTHIA Tune DW is very similar to Tune AW except Tune DW has PARP() , which is the preferred value determined by the DØ Collaboration in fitting their dijet distribution d0pub .
The MPI tune depends on the choice of parton distribution function (PDF). One must choose a PDF and then tune to fit the UE. Tune A, B, AW, and DW use CTEQ5L. Tune D6 is similar to tune DW except it uses CTEQ6L as the PDF. Note that in changing from CTEQ5L to CTEQ6L, PARP() decreased by a factor of in order to get the same UE activity.
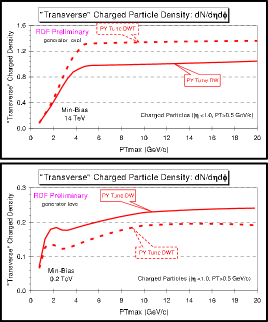
PYTHIA Tune A, AW, DW, and D6 use PARP() , which is much different than the PYTHIA default value of . Tune DWT uses the default value of . Tune DW and Tune DWT are identical at , but Tune DW and DWT extrapolate to other energies differently. Tune DWT produces more activity in the UE at energies above the Tevatron than does Tune DW, but predicts less activity than Tune DW in the UE at energies below the Tevatron as shown in Fig. 6. The data from the STAR Collaboration at at RHIC data star favor the energy dependence of Tune DW and rule out the energy dependence of Tune DWT.
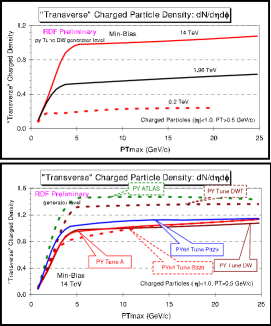
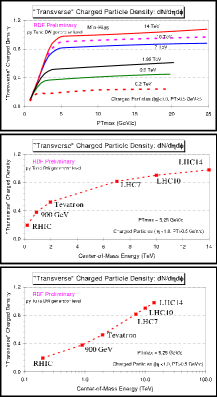
Fig. 7 shows the extrapolations of PYTHIA Tune A, Tune DW, Tune DWT, Tune S320, Tune P329, and pyATLAS to the LHC (). Tune pyATLAS is the original ATLAS tune that used the default parameter of PARP() . Both Tune DWT and the old pyATLAS tune are ruled out by the RHIC UE data star . Tune S320 is the original Perugia0 tune from Peter Skands skands1 and Tune P329 is a “professor” tune from Hendrik Hoeth. In November of 2009 Tune DW, Tune S320, and Tune P329 seemed to be converging on the same predictions for the LHC. I began to feel that we could make accurate LHC predictions with some confidence. Fig. 8 shows the charged particle density in the “transverse” region at 7 TeV as defined by PTmax, chgjet#, and the muon-pair in Drell-Yan production as predicted from PYTHIA Tune DW. The density of charged particles in the “transverse” region goes to zero as PTmax or (chgjet# go to zero due to kinematics. If PTmax is equal to zero then there are no charged particles anywhere in the region considered. Similarly for (chgjet#. However, if the (muon-pair) goes to zero there is still the hard scale of the mass of the muon-pair and, hence, the charge particle density is not zero at (muon-pair) .
Figure 9 show the center-of-mass energy dependence of the charged particle density in the “transverse” region predicted by PYTHIA Tune DW. The height of the “plateau” in the “transverse” region does not increase linearly with the center-of-mass energy. For energies above the Tevatron it increases more like a straight line on a log plot (or a small power of ). The UE activity is predicted by PYTHIA Tune DW to increase by about a factor of two in going from to and then to increase by only about in going from to .
III PYTHIA 6.2 Tune DW and the LHC UE Data
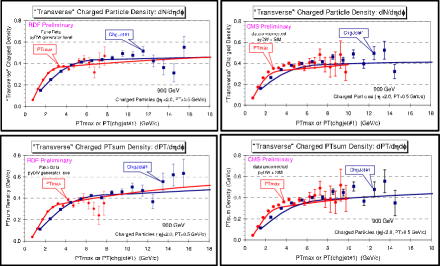
The left column of Figure 10 shows two plots that I presented at the MB&UE CMS Workshop at CERN on November 6, 2009 before we had LHC data. The plots show generator level predictions of PYTHIA Tune DW at for the transverse charged particle density and the transverse charged PTsum density as defined by the leading charged particle (PTmax) and the leading charged particle jet ((chgjet#) for charged particles with and . The plots also show fake data at generated from PYTHIA Tune DW assuming MB events ( events in the plot). The fake data agree perfectly with Tune DW since it was generated from Tune DW! This is what I expected the data to look like if CMS received MB triggers at . The right column of Figure 10 shows the data CMS collected at the LHC during the commissioning period of December 2009 cmsue1 . The data are uncorrected and compared with PYTHIA Tune DW after detector simulation ( events in the plot). CMS did not quite get MB triggers, but we got enough to get a first look at the underlying event activity at . PYTHIA Tune DW did a fairly good job in describing the features of this data, but it does not fit the data perfectly. It does not fit the real data quite as well as it fits the fake data! However, we saw roughly what we expected to see.
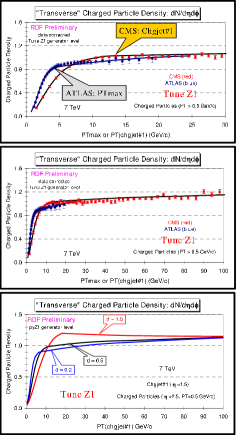
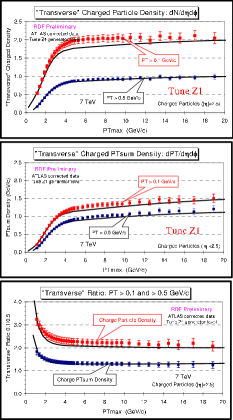
Figure 11 shows early CMS cmsue2 and ATLAS atlas1 data at and on the transverse charged particle density and the transverse charged PTsum density compared with the predictions of PYTHIA Tune DW. Here CMS useed the leading charged particle jet (chgjet#) to define the transverse region and ATLAS used the leading charged particle, PTmax. The ATLAS data are corrected to the particle level and compared with Tune DW at the generator level. The CMS data are uncorrected and compared with Tune DW after detector simulation. Tune DW predicted about the right amount of activity in the “plateau”, but does not fit the low rise very well. Figure 12 shows early CMS and ATLAS data on the ratio between and ( divided by ) for the transverse charged particle density and the transverse charged PTsum density compared with PYTHIA Tune DW. Tune DW predicted that the transverse charged particle density would increase by about a factor of two in going from to and that the transverse PTsum density would have a slightly larger increase. Both these predictions are seen in the data, although Tune DW does not fit very well the energy dependence of the low approach to the “plateau”.
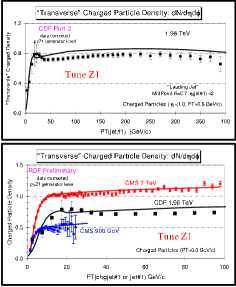
Figure 13 shows the CDF data at cdfue2 on the charged particle density in the “transverse” region as defined by the leading calorimeter jet, jet#, as a function of together with the recent CMS data cmsue3 at and on the charged particle density in the “transverse” region as defined by the leading charged particle jet, chgjet#, as a function of (chgjet# compared with PYTHIA Tune DW. I would say that the agreement at all three energies is fairly good. Tune DW, however, is not a perfect fit to the LHC UE data. It does not fit the Tevatron data perfectly either! We expect a lot from the QCD Monte-Carlo models. We want them to fit perfectly which is, of course, not always possible.
| Parameter | Tune Z1 | Tune Z2 | AMBT1 |
|---|---|---|---|
| PDF - Parton Distribution Function | CTEQ5L | CTEQ6L | LO* |
| PARP(82) - MPI Cut-off | |||
| PARP(89) - Reference energy, E0 | |||
| PARP(90) - MPI Energy Extrapolation | |||
| PARP(77) - CR Suppression | |||
| PARP(78) - CR Strength | |||
| PARP(80) - Probability colored parton from BBR | |||
| PARP(83) - Matter fraction in core | |||
| PARP(84) - Core of matter overlap | |||
| PARP(62) - ISR Cut-off | |||
| PARP(93) - primordial kT-max | |||
| MSTP(81) - MPI, ISR, FSR, BBR model | |||
| MSTP(82) - Double gaussion matter distribution | |||
| MSTP(91) - Gaussian primordial kT | |||
| MSTP(95) - strategy for color reconnection |
IV PYTHIA 6.4 CMS UE Tune Z1 and Tune Z2
Tune DW is a PYTHIA tune (Q2-ordered parton showers, old MPI model) designed by me to fit the CDF underlying event data at . Now that we have LHC data at and both ATLAS and CMS have LHC tunes. The ATLAS Tune AMBT1 ambt1 is a PYTHIA tune (-ordered parton showers, new MPI model) designed to fit the ATLAS LHC MB data for Nchg and (i.e., “diffraction suppressed MB”). They also included their underlying event data for PTmax , but the errors on the data are large in this region and hence their UE data did not have much influence on the resulting tune. The ATLAS AMBT1 tune does significantly better at fitting the LHC “diffraction suppressed MB” data, but does not do so well at fitting the LHC underlying event data. I started with the ATLAS Tune AMBT1 and varied a few of the parameter to improve the fit to the CMS underlying event data at and . The parameters of the ATLAS Tune AMBT1 and the CMS UE Tune Z1 are shown in Table 2.
Tune Z1 is a PYTHIA tune that uses the CTEQ5L PDF. CDF wanted also a PYTHIA tune that uses the CTEQ6L PDF. I know from my experience with Tune DW and Tune D6 (Table 1) that in going from CTEQ5L to CTEQ6L that I would have to decrease the value of PARP(), so I decreased it by a factor of (which is precisely the Tune D6 to Tune DW ratio) and produced Tune Z2. The parameters of Tune Z2 are also shown in Table 2. In my haste, I set PARP() for Tune Z2 which is the same value that I deermined for Tune Z1.
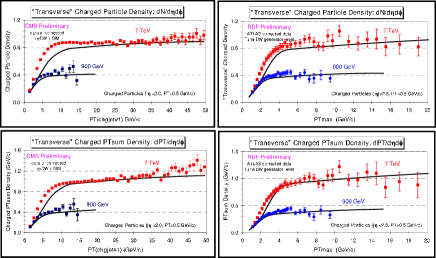
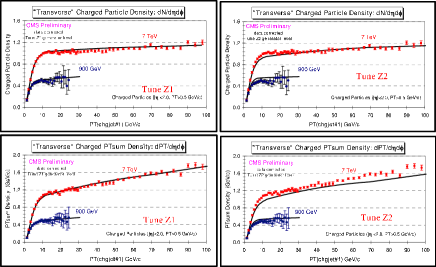
Figure 14 shows the more recent CMS data at and cmsue3 on the transverse charged particle density and the transverse charged PTsum density as defined by the leading charged particle jet, chgjet#. This data are corrected to the particle level and compared and with PYTHIA Tune Z1 and Tune Z2. Tune Z1 does a much better job in describing the low rise to the plateau than Tune DW. Tune Z2 does not describe the CMS UE data quite as well as Tune Z1.
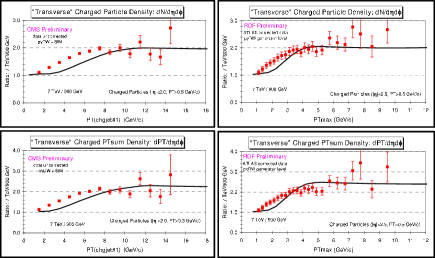
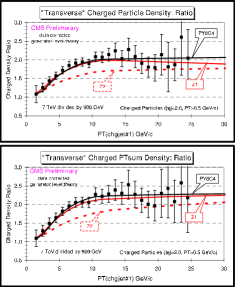
Figure 15 shows CMS data on the ratio of and ( divided by ) for the transverse charged particle density and the transverse charged PTsum density compared with PYTHIA Tune Z1, Tune Z2, and the PYTHIA 8 Tune 4C from Corke and Sjöstrand corke . Tune Z1 and Tune Z2 have the same value of PARP() , however, Tune Z1 fits the energy dependence quite nicely while Tune Z2 does not. In constructing Tune Z2, I forgot that the PDF also affects the energy dependence. When I changed from CTEQ5L (Tune Z1) to CTEQ6L (Tune Z2) I should have also changed PARP() as well as PARP(). The PYTHIA 8 Tune 4C uses CTEQ6L but has and fits the energy dependence very nicely. However, Tune 4C does not fit the LHC UE data at and as well as Tune Z1 does.
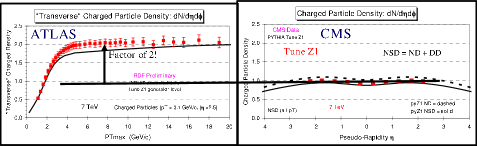
Figure 16 shows the latest ATLAS data atlas2 at and on the transverse charged particle density and the transverse charged PTsum density as defined by the leading charged particle, PTmax, for charged particles with and . The data are corrected to the particle level and compared with PYTHIA Tune Z1. Tune Z1 describes very well both the CMS and ATLAS UE data. Fig. 17 compares the CMS data using chgjet# with the ATLAS data which uses PTmax approach. Tune Z1 describes the differences between the CMS chgjet# and the ATLAS PTmax approach very well. It is interesting that the activity in the “plateau” of the “transverse” region is larger for the chgjet# approach than it is for the PTmax analysis. Could it be that when one requires a charged particle jet with a certain value of (chgjet# that you bias the UE to be more active, because a more active UE can contribute some to the leading charged particle jet? In an attempt to understand this, in Fig. 17 I looked at the dependence of the transverse charged particle density on the charged particle jet size (i.e., radius) as predicted by PYTHIA Tune Z1. I constructed charged particle jets using the Anti-KT algorithm with , , and . The charged particles have and and the leading charged particle jet is restricted to be in the region . For very narrow jets the UE “plateau” is nearly the same as in the PTmax approach. As the jets become larger in radius the UE “plateau” becomes more active! The object that is being used to define the “transverse” region can bias the UE to be more active. Amazing!
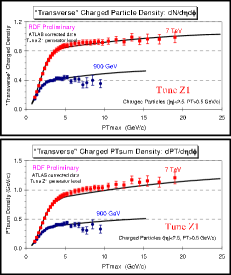
Figure 18 shows the recent ATLAS data at atlas2 on the transverse charged particle density and the transverse charged PTsum density as defined by the leading charged particle, PTmax, for charged particles with and compared with PYTHIA Tune Z1. Fig. 18 also shows the ratio of the ATLAS data with and compared with PYTHIA Tune Z1. All of the CDF UE measurements involved charged particles with . This is the first look at the UE in the region below and there are a lot of soft particles! The transverse charged particle density increases by about a factor of in going from to . Tune Z1 describes this increase better than Tune DW, however, Tune Z1 still does not have quite enough soft particles.
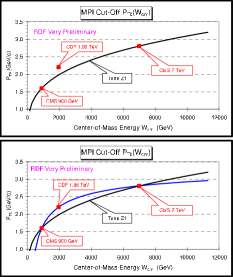
Figure 19 shows the CDF data at on the charged particle density in the “transverse” region as defined by the leading calorimeter jet, jet#, as a function of together with the CMS data at and on the charged particle density in the transverse region as defined by the leading charged particle jet, chgjet#, as a function of (chgjet# compared with PYTHIA Tune Z1. Fig. 19 shows the CMS PYTHIA Tune Z1 and Fig. 13 shows the CDF PYTHIA Tune DW. Neither of the tunes describe perfectly all three energies. Tune Z1 is in very good agreement with the UE data at and but is a little high at . One can see this in Fig. 20 which shows the PYTHIA Tune Z1 -to- hard scattering cut-off, , at and as determined by fitting the CMS UE data in Fig. 14 together with functional form of PYTHIA, , with PARP() , PARP() , and . Here is the hadron-hadron center-of-mass energy. Fig. 20 also shows the value of at that would fit better the CDF data in Fig. 19. The PYTHIA functional form predicts a smaller cut-off at resulting in a more active UE than observed in the CDF “leading jet” data in Fig. 19 skands2 . I believe it is premature to consider other functional forms for . I believe that we will find a PYTHIA tune that simultaneously describes , , and . Remember the energy dependence of the UE depends not only on PARP(), but also on the choice of PDF!
V PYTHIA Tunes and the LHC MB Data
Since PYTHIA regulates both the primary hard scattering and the MPI with the same cut-off, , with PYTHIA one can model the overall non-diffractive (ND) cross section by simply letting the transverse momentum of the primary hard scattering go to zero. The non-diffractive cross section then consists of BBR plus soft MPI with one of the MPI occasionally being hard. In this simple approach the UE in a hard-scattering process is related to MB collisions, but they are not the same. Of course, to model MB collisions one must also add a model of single (SD) and double diffraction (DD). This makes the modeling of MB much more complicated than the modeling of the UE. One cannot trust the PYTHIA 6.2 modeling of SD and DD.
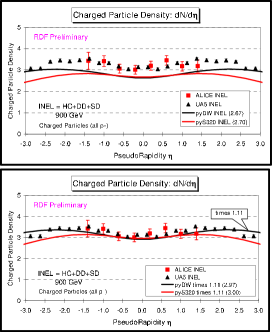
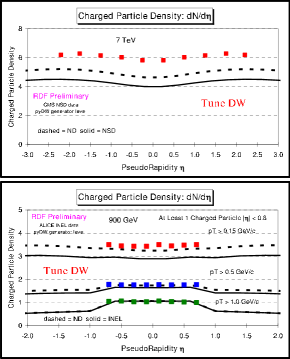
Figure 21 shows the inelastic (INEL) data from ALICE and UA5 at alice1 on the charged particle density, (all ) compared with PYTHIA Tune DW and Tune S320 skands1 . Both these tunes are about below the data. The INEL cross section is the sum of ND + SD + DD. Fig. 22 shows the non-single diffraction (NSD) data from CMS cmsmb1 on the charged particle density, (all ) compared with PYTHIA Tune DW. The solid curve is NSD and the dashed curve is inelastic non-diffraction (ND) component. The NSD cross section is the sum of ND + DD. Fig. 22 also shows the INEL data from ALICE at 900 GeV alice2 on the charged particle density, , with PTcut and with at lease one charged particle with PTcut and for PTcut , , and compared with PYTHIA Tune DW. Tune DW was tuned to fit the Tevatron data with . Two things change when we extrapolate from the Tevatron to the LHC. Of course the center-of-mass energy changes, but also we have started looking at softer particles (i.e., ). Fig. 22 shows that Tune DW does okay for , but does not produce enough soft particles below . One can also see that, at least in PYTHIA , the modeling of SD and DD is more important at the lower values.
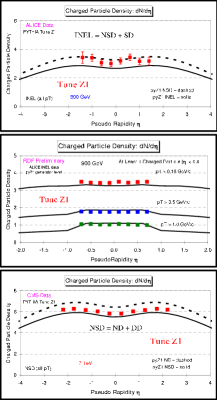
Figure 23 compares the CMS and ALICE charged particle densities, , with PYTHIA 6.4 Tune Z1. Tune Z1 does a better job at fitting the MB data than does Tune DW and it produced more soft particles below than does Tune DW. However, Tune Z1 does not fit the MB data perfectly.
Figure 24 compares the activity in the UE of a hard scattering process with an average MB collision. The activity in the UE of a hard scattering process at is roughly a factor of two greater than it is for an average MB collision and Tune Z1 describes this difference fairly well. In PYTHIA this difference comes from the fact that there are more MPI in a hard scattering process than in a typical MB collision. By demanding a hard scattering you force the collision to be more central (i.e., smaller impact parameter), which increases the chance of MPI.
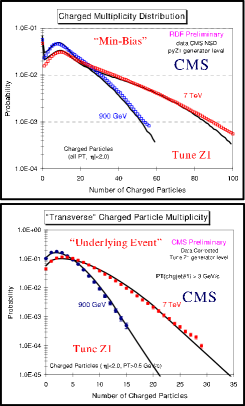
Figure 25 shows the data from CMS at and cmsmb2 on the charged particle multiplicity distribution (, all ) compared with PYTHIA Tune Z1 and the data from CMS at and on the charged particle multiplicity distribution in the “transverse” region as defined by the leading charged particle jet, chgjet#, for (chgjet# compared with PYTHIA Tune Z1. You are asking a lot of the QCD Monte-Carlo model when you expect it to simultaneously describe both MB and the UE in a hard scattering process. I think it is amazing that Tune Z1 does as well as it does in describing both!
VI Summary and Conclusions
The PYTHIA Tune DW which was created from CDF UE studies at the Tevatron did a fairly good job in predicting the LHC UE data and . The behavior of the UE at the LHC is roughly what we expected. Remember this is “soft” QCD! The LHC PYTHIA Tune Z1 does a very nice job describing the UE data at and . The UE is part of a hard scattering process. MB collisions quite often contain no hard scattering and are therefore more difficult to model. Since PYTHIA regulates both the primary hard scattering and the MPI with the same cut-off, , with PYTHIA one can model the overall non-diffractive (ND) cross section by simply letting the transverse momentum of the primary hard scattering go to zero. In this approach the UE in a hard-scattering process is related to MB collisions, but they are not the same. Of course, to model MB collisions one must also add a model of single (SD) and double diffraction (DD). Tune Z1 does a fairly good job of simultaneously describing both MB and the UE in a hard scattering process. I think it is amazing that it does as well on MB as it does!
There are a lot of factors of two floating around. The charged particle density in the “transverse” region increases by about a factor of two in going from and (Fig. 15). At the charged particle density in the “transverse” region increases by about a factor of two in going from to (Fig. 18). The charged particle density in the “transverse” region is about a factor of two larger than the density of particles in a typical MB collision (Fig. 24). All of these factors of two are described fairly well by PYTHIA Tune Z1. PYTHIA pythia8 also does a fairly good job on many of the MB observables, but so far it does not fit the LHC UE data as well as Tune Z1.
In order to describe the bulk of the LHC MB data one must include a model of diffraction. Experimentally, it is not possible to uniquely separate diffractive from non-diffractive collisions. However, one can construct samples of “diffraction enhanced MB” and “diffraction suppressed MB” events and compare with the models. The “diffraction enhanced MB” samples are selected by requiring some type of rapidity gap cmsfwd ; atlas3 . We have learned that PYTHIA does a poor job of modeling of diffraction. PHOJET phojet and PYTHIA do a better job with diffraction.
In a very short time the experiments at the LHC have collected a large amount of data that can be used to study MB collisions and the UE in great detail. This data can be compared with the Tevatron MB and UE data to further constrain and improve the QCD Monte-Carlo models we use to simulate hadron-hadron collision. At present none of the tunes describe perfectly the UE data at both the Tevatron and the LHC. However, I believe the tunes will continue to improve. We are just getting started! The future will include more comparisons with PYTHIA , HERWIG++ hw++ , and SHERPA sherpa .
References
- (1) Charged Jet Evolution and the Underlying Event in Proton-Antiproton Collisions at TeV, The CDF Collaboration, Phys. Rev. D65, 092002, (2002).
- (2) T. Sjöstrand, Phys. Lett. 157B, 321 (1985); M. Bengtsson, T. Sjöstrand, and M. van Zijl, Z. Phys. C32, 67 (1986); T. Sjöstrand and M. van Zijl, Phys. Rev. D36, 2019 (1987). T. Sjöstrand, P. Eden, C. Friberg, L. Lonnblad, G. Miu, S. Mrenna and E. Norrbin, Computer Physics Commun. 135, 238 (2001).
- (3) The Perugia Tunes, P. Skands, 2009, arXiv:0905.3418v1.
- (4) Charged Particle Multiplicities in pp Interactions at and TeV in a Diffractive Limited Phase-Space Measured with the ATLAS Detector at the LHC and New PYTHIA 6 Tune, The ATLAS Collaboration, ATLAS-CONF-2010-031.
- (5) F. Paige and S. Protopopescu, BNL Report BNL38034, 1986 (unpublished), version 7.32.
- (6) G. Marchesini and B. R. Webber, Nucl. Phys B310, 461 (1988); I. G. Knowles, Nucl. Phys. B310, 571 (1988); S. Catani, G. Marchesini, and B. R. Webber, Nucl. Phys. B349, 635 (1991).
- (7) The Underlying Event in Hard Interactions at the Tevatron Proton-Antiproton Collider, The CDF Collaboration , Phys. Rev. D70, 072002 (2004).
- (8) Measurement of the Z PT Distribution in Proton-Antiproton Collisions at at TeV, The CDF Collaboration, Phys. Rev. Lett. 67, 2937-2941 (1991).
- (9) Phys. Rev. Lett. 94, 221801 (2005).
- (10) Underlying Event Studies at RHIC, Helen Caines, arXiv:0910.5203v1.
- (11) First Measurement of the Underlying Event Activity at the LHC with TeV, The CMS Collaboration, Eur. Phys. J. C70, 555-572, 2010, arXiv:1006.2083 [hep-ex].
- (12) Measurement of the Underlying Event Activity at the LHC at TeV and Comparison with TeV, CMS Physics Analysis Summary, CMS-PAS-QCD-10-010, CERN, 2010.
- (13) Track-Based Underlying Event Measurements in pp Collisions at GeV and TeV with the ATLAS Detector at the LHC, The ATLAS Collaboration, ATLAS-CONF-2010-029.
- (14) Studying the Underlying Event in Drell-Yan and High Transverse Momentum Jet Production at the Tevatron, The CDF Collaboration, Phys. Rev. D82, 034001 (2010), arXiv:1003.3146.
- (15) Measurement of the Underlying Event Activity at the LHC at TeV and Comparison with TeV, The CMS Collaboration, J. High Energy Phys. 09 (2011) 109, arXiv:1107.0330.
- (16) Interleaved Parton Showers and Tuning Prospects, Richard Corke and Torbjörn Sjöstrand, JHEP 1103:032 (2011), arXiv:1011.1759v1 [hep-ph].
- (17) Measurement of Underlying Event Characteristics using Charged Particles in collisions GeV and TeV with the ATLAS Detector, The ATLAS Collaboration, Phys. Rev. D83 (2011) 112001, arXiv:1012.0791.
- (18) See also, Energy Scaling of Minimum-Bias Tunes, Holger Schulz and Peter Skands, arXiv:1103.3649v1 [hep-ph].
- (19) First Proton-Proton Collisions at the LHC as Observed with the ALICE Detector: Measurement of the Charged Particle Pseudorapidity Density at 900 GeV, The ALICE Collaboration, Eur. Phys. J. C65, 111 (2010), arXiv:0911.5430.
- (20) Transverse-Momentum and Pseudorapidity Distributions of Charged Hadrons in Collisions at 7 TeV, The CMS Collaboration, Phys. Rev. Lett. 105, 02200 (2010), arXiv:1005.3299.
- (21) Talk presented by C. Zampolli at the LPCC MB&UE Working Group Meeting, CERN, June 9, 2010.
- (22) Charged Particle Multiplicities in pp Interactions at , , and TeV, The CMS Collaboration, J. High Energy Phys. 01, 079 (2011), arXiv:1011.5531.
- (23) A Brief Introduction to PYTHIA 8.1, T. Sjöstrand, S. Mrenna, and P. Skands, Comput. Phys. Commun. 178, 852 867 (2008), arXiv:0710.3820 [hep-ph].
- (24) Observation of Diffraction in Proton-Proton Collisions at and GeV Centre-of-Mass Wnergies at the LHC, The CMS Collaboration, CMS-PAS FWD-10-001.
- (25) Studies of Diffractive Enhanced Minimum Bias Events in ATLAS, The ATLAS Collaboration, ATLAS-CONF-2010-048.
- (26) F.W. Bopp, R. Engel and J. Ranft, arXiv:hep-ph/9803437. R. Engel, J. Ranft and S. Roesler, Phys. Rev. D52, 1459 (1995).
- (27) M. Bahr et al., Herwig++ Physics and Manual, Eur. Phys. J. C58 (2008), arXiv:0803.0883 [hep-ph]. M. Bahr et al., Herwig++ 2.3 Release Note, arXiv:0812.0529 [hep-ph].
- (28) T. Gleisberg, et al. JHEP 0402 (2004) 056 [hep-ph/0311263]; T. Gleisberg, et al. JHEP 0902 (2009) 007, arXiv:0811.4622 [hep-ph].